Managing clinic tenders without structured performance tracking often creates delays, cost overruns, compliance gaps, and poor visibility. However, modern clinics deal with multiple vendors, strict healthcare regulations, budget constraints, and high service expectations. Therefore, procurement teams must rely on accurate, real-time insights instead of manual Excel tracking alone.
That is exactly where a Clinic Tender KPI Dashboard in Power BI becomes a powerful and practical solution.
In this in-depth and SEO-friendly guide, you will learn what a Clinic Tender KPI Dashboard in Power BI is, why it matters, how it works, its detailed page structure, KPI logic, Excel data design, advantages, best practices, and frequently asked questions. By the end of this article, you will clearly understand how this dashboard transforms raw tender data into actionable insights for better clinic procurement decisions.
Click to buy Clinic Tender KPI Dashboard in Power BI
What Is a Clinic Tender KPI Dashboard in Power BI?
A Clinic Tender KPI Dashboard in Power BI is a ready-to-use analytical reporting solution designed to monitor, analyze, and evaluate key performance indicators related to clinic tender processes.
Instead of managing scattered Excel sheets and static procurement reports, this dashboard consolidates all tender KPIs into a single interactive Power BI report. As a result, clinic administrators, procurement managers, and finance teams gain instant visibility into tender performance, targets, trends, and year-over-year comparisons.
Moreover, because the dashboard uses Excel as the data source, clinics can implement it quickly without complex system integrations. Consequently, even small and mid-size clinics can adopt advanced analytics without high IT costs.
Why Do Clinics Need a Tender KPI Dashboard?
Clinic tender management involves medical equipment procurement, service contracts, maintenance agreements, and vendor selection. Therefore, even a small inefficiency can directly affect patient care and operational budgets.
Without a KPI dashboard:
- Teams rely on manual tracking
- Decision-making slows down
- Target misses remain hidden
- Vendor accountability weakens
However, with a Clinic Tender KPI Dashboard in Power BI, clinics gain:
- Centralized performance monitoring
- Transparent target vs actual tracking
- Early identification of risks
- Data-driven procurement governance
As a result, clinics improve efficiency while maintaining compliance and cost control.
How Does a Clinic Tender KPI Dashboard in Power BI Work?
The dashboard works on a simple yet powerful data flow:
- Data Entry in Excel
- Data Modeling in Power BI
- KPI Calculations Using DAX
- Interactive Visualization and Analysis
Because Excel acts as the backend, users only need to update monthly actuals and targets. Power BI then automatically refreshes all KPIs, charts, and indicators.
Page Structure of the Clinic Tender KPI Dashboard in Power BI
This ready-to-use dashboard contains three well-structured pages, each serving a specific analytical purpose.
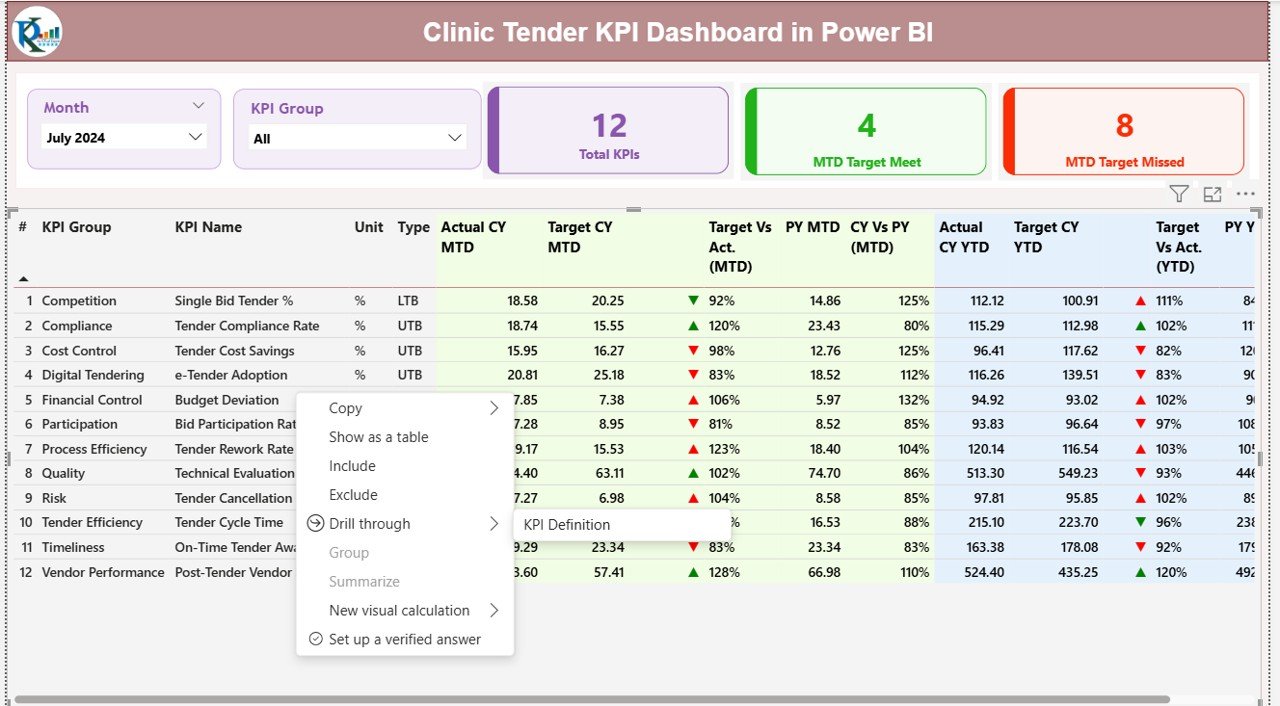
Summary Page – How Do You Monitor Overall Tender Performance?
The Summary Page acts as the control center of the dashboard. It provides a high-level overview of all clinic tender KPIs.
Top-Level Slicers
- Month Slicer – Select reporting month instantly
- KPI Group Slicer – Filter KPIs by category
Because of these slicers, users can focus on specific periods or tender categories without scrolling through large datasets.
KPI Cards at the Top
- Total KPIs Count
- MTD Target Meet Count
- MTD Target Missed Count
These cards immediately show whether clinic tenders perform as expected.
Detailed KPI Table Explained
Below the cards, the dashboard displays a comprehensive KPI table with rich insights.
Key Columns Explained Clearly:
- KPI Number – Unique sequence number of each KPI
- KPI Group – Tender category or procurement group
- KPI Name – Name of the performance metric
- Unit – Unit of measurement (%, days, amount, count)
Type –
LTB (Lower the Better)
UTB (Upper the Better)
MTD Performance Metrics
Actual CY MTD – Current Year Month-to-Date actual value
Target CY MTD – Target value for current month
MTD Icon –
▲ Green = Target met
▼ Red = Target missed
Target vs Actual (MTD) – Actual ÷ Target
PY MTD – Previous Year MTD value
CY vs PY (MTD) – CY MTD ÷ PY MTD
YTD Performance Metrics
Actual CY YTD – Current Year Year-to-Date actual
- Target CY YTD – Current Year YTD target
- YTD Icon – Visual status indicator
- Target vs Actual (YTD) – Actual ÷ Target
- PY YTD – Previous Year YTD value
- CY vs PY (YTD) – CY YTD ÷ PY YTD
Because of this structure, users can evaluate short-term and long-term tender performance at the same time.

Click to buy Clinic Tender KPI Dashboard in Power BI
KPI Trend Page – How Do You Analyze Tender Trends?
The KPI Trend Page focuses on performance patterns over time.
Key Features of This Page
Two Combo Charts
MTD trend comparison
YTD trend comparison
Current Year Actual
Previous Year Actual
Target Values
A KPI Name slicer on the left allows users to select any KPI and instantly view its trend.
Therefore, clinics can:
Identify seasonal tender patterns
Compare year-over-year improvements
Detect declining performance early

Click to buy Clinic Tender KPI Dashboard in Power BI
KPI Definition Page – What Does Each KPI Mean?
The KPI Definition Page acts as a drill-through and reference page.
What This Page Contains
- KPI Formula
- KPI Definition
- KPI Type (LTB or UTB)
This page remains hidden to keep the interface clean. However, users can drill through from the Summary Page whenever they need clarity.
A Back button at the top-left helps users return to the main dashboard easily.
Click to buy Clinic Tender KPI Dashboard in Power BI
Excel Data Structure for the Clinic Tender KPI Dashboard
The dashboard uses a simple and clean Excel backend with three worksheets. Because of this design, even non-technical users can manage data confidently.
Input_Actual Sheet
In this sheet, users enter actual performance values.
Required Columns:
- KPI Name
- Month (use first date of the month)
- MTD Value
- YTD Value
Input_Target Sheet
In this sheet, users enter target values.
Required Columns:
- KPI Name
- Month
- MTD Target
- YTD Target
KPI Definition Sheet
This sheet defines the KPI structure.
Required Columns:
- KPI Number
- KPI Group
- KPI Name
- Unit
- Formula
- Definition
- Type (LTB / UTB)
Because of this structure, Power BI can calculate all metrics automatically without manual formulas in Excel.
Advantages of a Clinic Tender KPI Dashboard in Power BI
Centralized Tender Performance Monitoring
Instead of checking multiple files, teams monitor all tender KPIs in one dashboard.
Faster and Better Decision-Making
Because insights update automatically, clinics respond to issues quickly.
Improved Transparency and Governance
Clear KPIs increase accountability across procurement teams and vendors.
Target vs Actual Visibility
Visual indicators highlight gaps instantly.
Year-Over-Year Performance Comparison
Clinics measure progress and justify strategic improvements.
Easy Implementation with Excel
No complex systems or integrations required.
Best Practices for the Clinic Tender KPI Dashboard in Power BI
Define Clear and Measurable KPIs
Always align KPIs with clinic procurement goals.
Maintain Data Accuracy in Excel
Clean and consistent data ensures reliable insights.
Review KPIs Monthly
Regular reviews help clinics correct issues early.
Use LTB and UTB Logic Correctly
Ensure performance indicators reflect true success or failure.
Train Users on KPI Interpretation
When users understand KPIs, decisions improve.
Keep KPI Definitions Updated
Clear definitions prevent misinterpretation across teams.
Who Should Use a Clinic Tender KPI Dashboard?
- Clinic Administrators
- Procurement Managers
- Finance Teams
- Compliance Officers
- Hospital Management Committees
Because the dashboard supports strategic and operational needs, it fits clinics of all sizes.
Conclusion: Why Is a Clinic Tender KPI Dashboard Essential?
A Clinic Tender KPI Dashboard in Power BI transforms complex tender data into clear, actionable insights. Instead of manual tracking and delayed reports, clinics gain real-time visibility into performance, targets, and trends.
As a result, clinics improve procurement efficiency, control costs, strengthen compliance, and support better healthcare delivery. Therefore, adopting this dashboard is not just a reporting upgrade—it is a strategic improvement for modern clinic management.
Frequently Asked Questions (FAQs)
What is the main purpose of a Clinic Tender KPI Dashboard?
The dashboard helps clinics monitor tender performance, compare targets vs actuals, and improve procurement decisions.
Can small clinics use this dashboard?
Yes, because it uses Excel as the data source, small clinics can implement it easily.
Do users need advanced Power BI skills?
No. Users only update Excel data and interact with slicers.
How often should clinics update the data?
Clinics should update data monthly for accurate MTD and YTD analysis.
Can clinics customize KPIs?
Yes. Users can add or modify KPIs through the KPI Definition sheet.
Does the dashboard support year-over-year analysis?
Yes. It includes CY vs PY comparisons for both MTD and YTD metrics.
Visit our YouTube channel to learn step-by-step video tutorials
Watch the step-by-step video tutorial:
Click to buy Clinic Tender KPI Dashboard in Power BI