Influencer marketing continues to grow rapidly. As brands invest more in influencer platforms, they need accurate performance tracking to ensure results. However, many teams still rely on scattered spreadsheets, manual reports, and guesswork. Because of that, decisions often lack clarity and confidence.
That is exactly why an Influencer Platforms KPI Dashboard in Excel becomes essential.
This article explains what an Influencer Platforms KPI Dashboard in Excel is, why you need it, how it works, and how to use it effectively. Moreover, you will learn about its features, advantages, best practices, and real-world use cases. Finally, you will find frequently asked questions with clear answers.
By the end of this guide, you will clearly understand how Excel dashboards transform influencer platform data into powerful business insights.
Click to buy Influencer Platforms KPI Dashboard in Excel
What Is an Influencer Platforms KPI Dashboard in Excel?
An Influencer Platforms KPI Dashboard in Excel is a ready-to-use performance tracking tool designed to monitor key performance indicators related to influencer platforms.
Instead of reviewing raw data from multiple sources, this dashboard consolidates everything into one interactive view. As a result, marketing teams can instantly track performance, identify trends, and measure success.
Moreover, Excel allows complete flexibility. You can customize KPIs, adjust targets, and analyze data without complex software. Therefore, both small teams and large enterprises benefit from this dashboard.
Why Do Influencer Platforms Need KPI Dashboards?
Influencer platforms generate large volumes of data every month. However, data alone does not create value. You must analyze it correctly.
Without a structured KPI dashboard:
- Teams struggle to compare actual results against targets
- Trends remain hidden in raw data
- Decision-making becomes slow and reactive
- Performance reviews consume unnecessary time
On the other hand, when you use an Influencer Platforms KPI Dashboard in Excel, you gain clarity, speed, and control.
How Does an Influencer Platforms KPI Dashboard in Excel Work?
The dashboard works by collecting data from Actual, Target, and Previous Year sources. Then, Excel formulas and pivot logic convert that data into meaningful insights.
Because the dashboard includes monthly selection, you can analyze performance for any period instantly. Additionally, conditional formatting highlights gaps and achievements clearly.
As a result, you can focus on strategy instead of manual reporting.
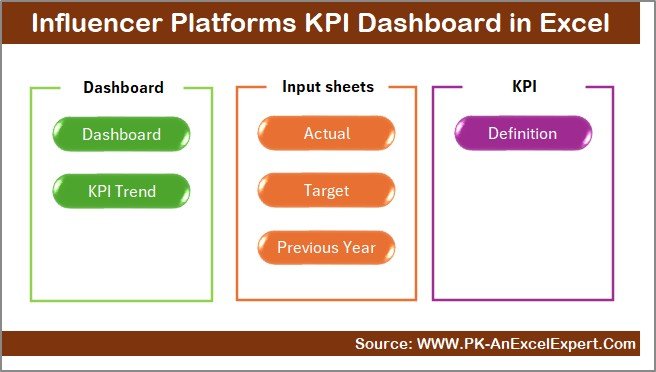
What Worksheets Are Included in the Influencer Platforms KPI Dashboard in Excel?
This dashboard contains 7 well-structured worksheets, each designed for a specific purpose.
Summary Page: How Does the Navigation Work?
The Summary Page works as an index sheet.
Here, you see 6 navigation buttons that instantly take you to other sheets. Because of this structure, users do not waste time searching for information.
Moreover, the clean layout improves usability and reduces learning time.
Click to buy Influencer Platforms KPI Dashboard in Excel
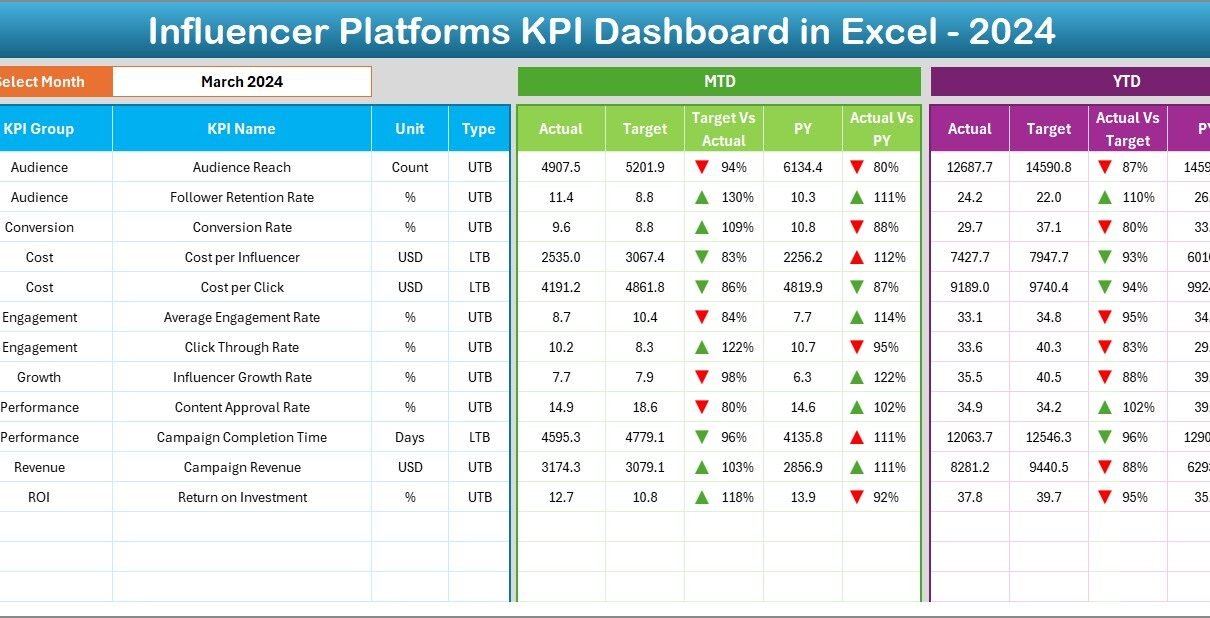
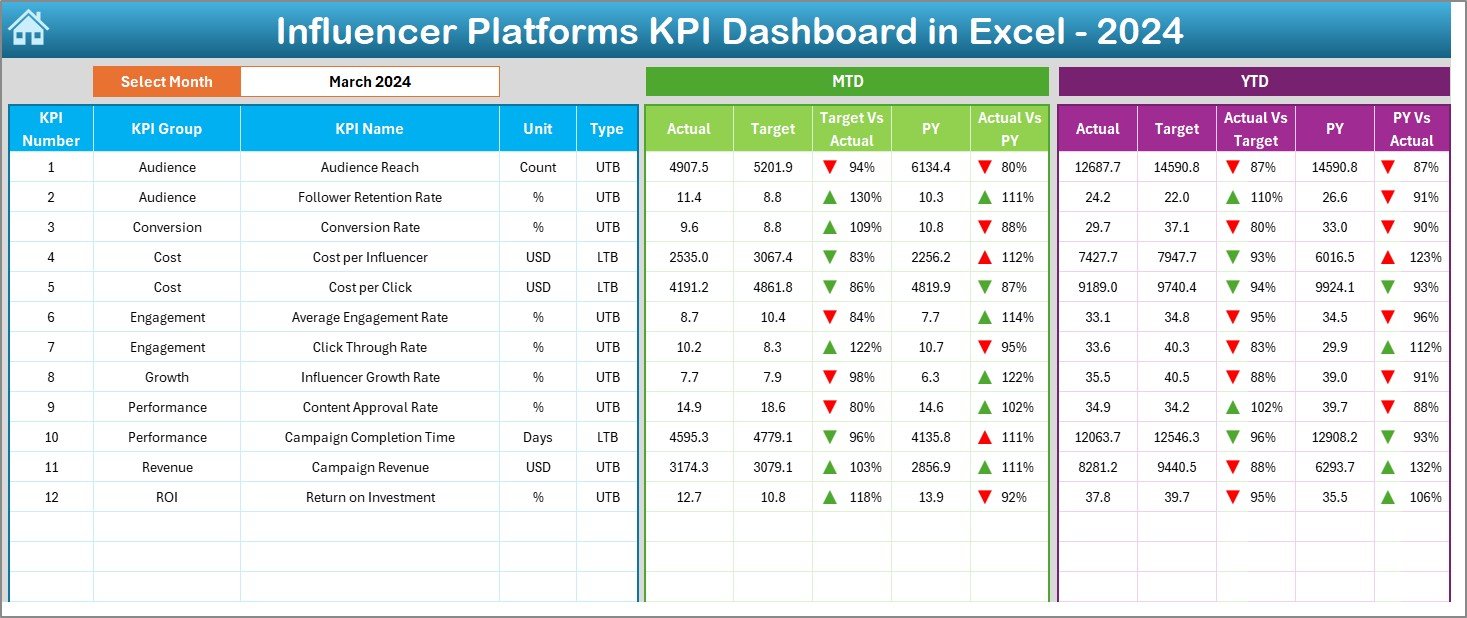
Dashboard Sheet: What Insights Does the Main Dashboard Show?
The Dashboard sheet acts as the heart of the entire file.
Key Features of the Dashboard Sheet
- Month selection drop-down available on cell D3
- Automatic refresh of all KPIs based on selected month
- Clear comparison between Actual, Target, and Previous Year data
MTD Performance Tracking
On this sheet, you can see:
- MTD Actual
- MTD Target
- MTD Previous Year
- Target vs Actual %
- Previous Year vs Actual %
Excel displays up and down arrows using conditional formatting. Therefore, performance status becomes instantly visible.
YTD Performance Tracking
Along with MTD, the dashboard also displays:
- YTD Actual
- YTD Target
- YTD Previous Year
- Target vs Actual %
- Previous Year vs Actual %
As a result, you can evaluate both short-term and long-term performance in one view.
Click to buy Influencer Platforms KPI Dashboard in Excel
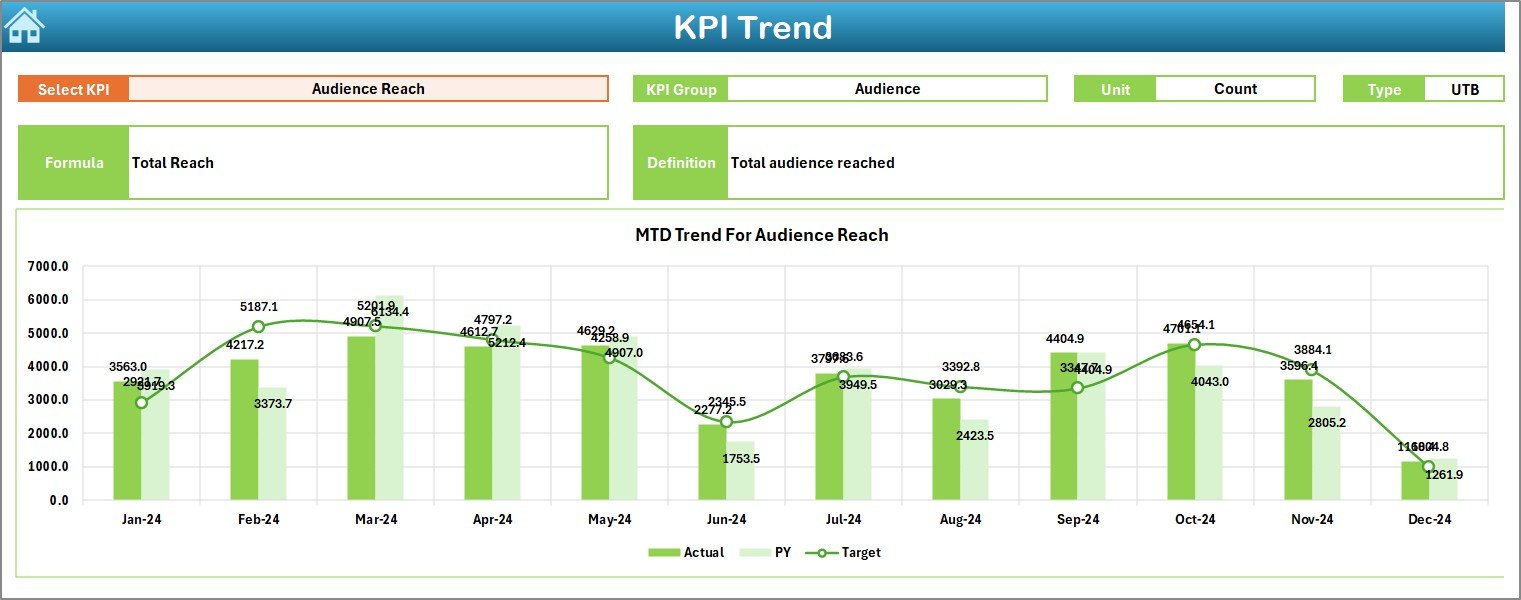
Trend Sheet: How Can You Analyze KPI Trends?
The Trend Sheet allows deep KPI analysis.
What Can You Select?
- KPI Name from a drop-down at cell C3
What Information Is Displayed?
Once you select a KPI, Excel automatically shows:
- KPI Group
- KPI Unit
- KPI Type (Lower the Better or Upper the Better)
- KPI Formula
- KPI Definition
Trend Charts Included
The sheet also displays:
- MTD trend chart for Actual, Target, and Previous Year
- YTD trend chart for Actual, Target, and Previous Year
Therefore, you can easily identify growth patterns, seasonal trends, and performance gaps.
Click to buy Influencer Platforms KPI Dashboard in Excel
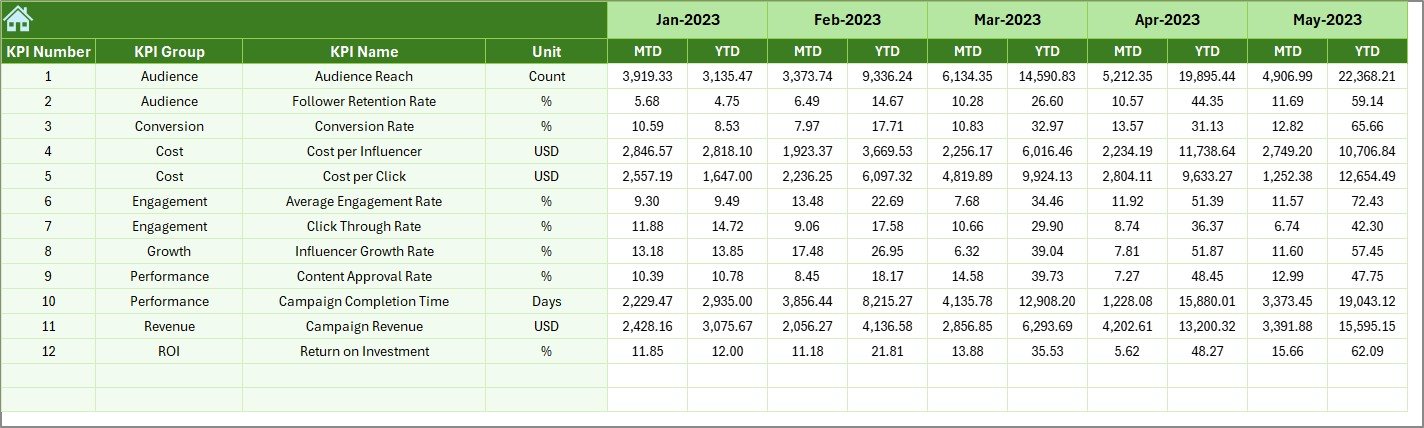
Actual Numbers Input Sheet: How Do You Enter Data?
The Actual Numbers Input Sheet stores all actual performance values.
How Data Entry Works
- Select the starting month of the year in cell E1
- Enter MTD and YTD actual numbers for each KPI
- Update values monthly without changing formulas
Because this sheet separates input from analysis, data integrity stays protected.

Click to buy Influencer Platforms KPI Dashboard in Excel
Target Sheet: How Are Targets Managed?
The Target Sheet helps define performance goals.
Here, you enter:
- Monthly MTD target values
- Monthly YTD target values
Since targets remain separate from actuals, comparisons stay accurate and transparent.

Click to buy Influencer Platforms KPI Dashboard in Excel
Previous Year Number Sheet: Why Is Historical Data Important?
The Previous Year Number Sheet stores last year’s performance data.
By comparing current performance with historical numbers, you can:
- Measure growth accurately
- Identify long-term improvements
- Detect performance declines early
This comparison strengthens strategic planning significantly.
Click to buy Influencer Platforms KPI Dashboard in Excel
KPI Definition Sheet: How Do You Maintain KPI Clarity?
The KPI Definition Sheet acts as a reference library.
In this sheet, you maintain:
- KPI Name
- KPI Group
- Unit of Measurement
- Formula
- KPI Definition
Because definitions remain standardized, all stakeholders interpret KPIs consistently.

Click to buy Influencer Platforms KPI Dashboard in Excel
What KPIs Can You Track Using This Dashboard?
An Influencer Platforms KPI Dashboard in Excel supports a wide range of KPIs, including:
- Influencer engagement rate
- Campaign reach
- Cost per engagement
- Influencer conversion rate
- ROI from influencer campaigns
- Platform onboarding growth
- Active influencer ratio
- Campaign completion rate
You can easily add or modify KPIs based on business needs.
Advantages of Influencer Platforms KPI Dashboard in Excel
Using this dashboard delivers several powerful advantages.
Centralized Performance View
All KPIs stay in one place. Therefore, reporting becomes faster and more reliable.
Time Savings
Since Excel automates calculations and visuals, teams reduce manual effort significantly.
Better Decision-Making
Clear trends and comparisons help teams act confidently and quickly.
Customizable Structure
You can adjust KPIs, targets, and layouts without technical dependency.
Cost-Effective Solution
Excel eliminates the need for expensive analytics tools.
Who Should Use an Influencer Platforms KPI Dashboard in Excel?
This dashboard benefits:
- Influencer platform managers
- Digital marketing teams
- Brand partnership managers
- Campaign analysts
- Marketing agencies
- Performance reporting teams
Because Excel remains widely used, adoption stays easy.
How Does This Dashboard Improve Influencer Marketing Strategy?
When teams track KPIs consistently, strategy improves naturally.
You can:
- Identify top-performing influencers
- Optimize campaign budgets
- Improve platform engagement
- Align targets with business goals
- Measure ROI accurately
As a result, influencer programs become scalable and profitable.
Best Practices for the Influencer Platforms KPI Dashboard in Excel
To get maximum value, follow these best practices.
Update Data Regularly
Enter actual numbers monthly to keep insights accurate.
Maintain Clear KPI Definitions
Ensure all KPIs have clear formulas and explanations.
Review Trends Monthly
Analyze trend charts regularly to detect changes early.
Use Targets Strategically
Set realistic targets based on historical data.
Limit Manual Formula Changes
Protect calculation cells to avoid errors.
How Can You Customize the Dashboard?
Excel allows complete flexibility.
You can:
- Add new KPIs
- Modify KPI groups
- Change time periods
- Enhance charts and formatting
- Integrate additional data sources
Because of this flexibility, the dashboard grows with your business.
Conclusion: Why Should You Use an Influencer Platforms KPI Dashboard in Excel?
An Influencer Platforms KPI Dashboard in Excel transforms raw data into clear insights. It improves visibility, saves time, and supports confident decision-making.
Instead of managing scattered reports, you gain a single source of truth. Moreover, Excel keeps the solution affordable, flexible, and easy to use.
If you manage influencer platforms or campaigns, this dashboard becomes an essential performance management tool.
Frequently Asked Questions About Influencer Platforms KPI Dashboard in Excel
What Is the Main Purpose of This Dashboard?
The dashboard tracks influencer platform performance using structured KPIs and visual insights.
Can Beginners Use This Dashboard?
Yes. The navigation buttons and simple layout make it beginner-friendly.
Do I Need Advanced Excel Skills?
No. Basic Excel knowledge works perfectly.
Can I Add More KPIs?
Yes. You can easily add or modify KPIs in the definition and input sheets.
How Often Should I Update the Dashboard?
You should update it monthly for accurate analysis.
Does the Dashboard Support Year-Over-Year Comparison?
Yes. It includes full Previous Year comparison for both MTD and YTD.
Can This Dashboard Support Multiple Influencer Platforms?
Yes. You can structure KPIs to track multiple platforms within the same file.
Visit our YouTube channel to learn step-by-step video tutorials
Watch the step-by-step video tutorial:
Click to buy Influencer Platforms KPI Dashboard in Excel