Vertical farming continues to reshape modern agriculture. As urbanization increases and arable land becomes limited, vertical farming offers a sustainable and efficient way to grow crops indoors. However, managing vertical farming operations involves multiple variables such as energy usage, crop yield, operational costs, revenue, and profit margins. Without a structured analytics system, decision-making becomes slow and inaccurate.
That is exactly why a Vertical Farming Dashboard in Excel becomes an essential management and reporting tool.
This ready-to-use dashboard transforms raw farming data into clear visual insights. Instead of manually reviewing spreadsheets, farm managers, agritech startups, and sustainability teams gain instant visibility into performance across crops, countries, growth systems, and months.
In this detailed article, you will learn what a Vertical Farming Dashboard in Excel is, how it works, its dashboard pages, advantages, best practices, and frequently asked questions. By the end, you will clearly understand how this dashboard supports smarter operational and financial decisions.
Click to Purchases Vertical Farming Dashboard in Excel
What Is a Vertical Farming Dashboard in Excel?
A Vertical Farming Dashboard in Excel is a structured and visual reporting tool designed to track and analyze key performance metrics of vertical farming operations.
Instead of handling multiple Excel sheets with disconnected data, this dashboard consolidates all information into one interactive Excel file. As a result, users can analyze costs, revenue, yield, and profitability from a single screen.
Moreover, because the dashboard is built entirely in Excel, it remains easy to use, flexible, and accessible—without requiring advanced software or technical skills.
Why Do Vertical Farming Businesses Need a Dashboard?
Vertical farming operations involve complex systems such as hydroponics, aeroponics, and aquaponics. At the same time, energy consumption, crop selection, and geographic conditions significantly impact profitability.
Without a centralized dashboard, businesses often face:
-
Limited visibility into operational costs
-
Difficulty tracking yield performance
-
Poor comparison across crop types
-
Delayed financial insights
-
Manual and time-consuming reporting
Therefore, a vertical farming dashboard becomes essential.
With a Vertical Farming Dashboard in Excel, teams gain clarity, consistency, and control over operational and financial performance.
Click to Purchases Vertical Farming Dashboard in Excel
How Does the Vertical Farming Dashboard in Excel Work?
The dashboard works by using a structured data sheet as its source. Once users update the data, the dashboard automatically refreshes all charts and KPIs.
Additionally, the dashboard uses slicers, KPI cards, and charts to simplify analysis. Because of this design, users can explore data without writing formulas or creating charts manually.
Most importantly, the dashboard supports multi-dimensional analysis, which includes crop type, country, growth system, and time-based trends.
What Pages Are Included in the Vertical Farming Dashboard in Excel?
This dashboard contains five analytical pages, each focused on a specific aspect of vertical farming performance.
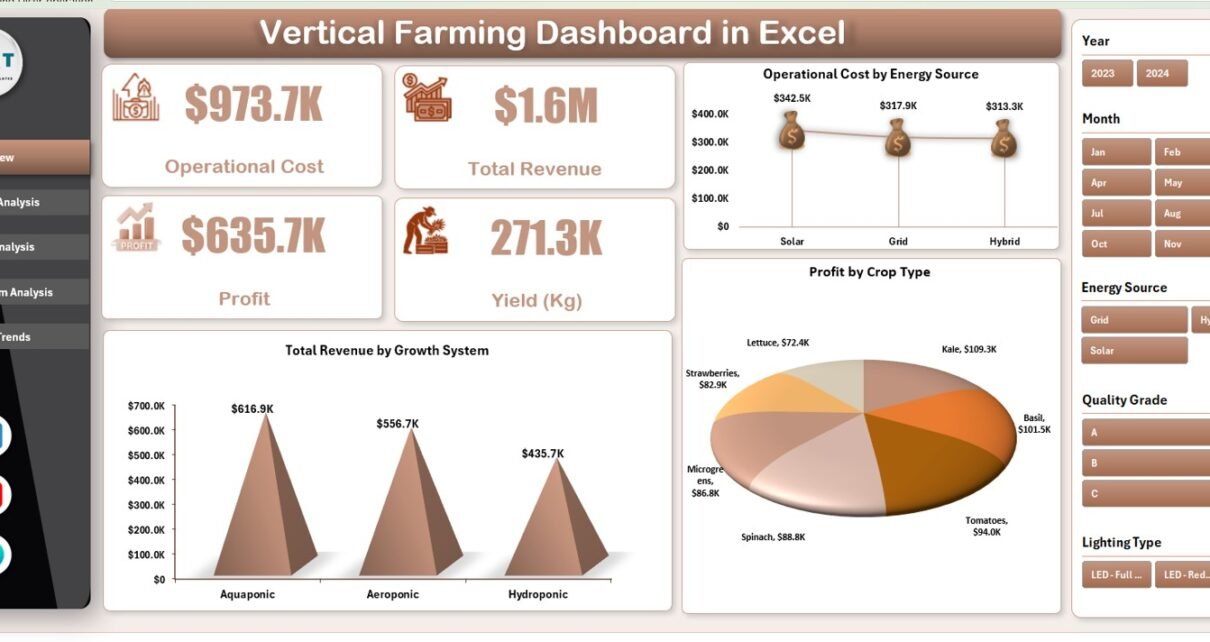
What Is the Overview Page and Why Is It Important?

The Overview Page acts as the central summary of the dashboard.
What Slicers Are Available on the Overview Page?
On the right side of the dashboard, users can find slicers that allow quick filtering across key dimensions. These slicers help users focus on specific data without navigating multiple sheets.
What KPI Cards Are Displayed?
The Overview Page displays four KPI cards:
-
Operational Cost
-
Total Revenue
-
Profit
-
Yield (Kg)
These cards provide instant insight into overall farm performance.
What Charts Are Included on the Overview Page?
The Overview Page includes three key charts:
-
Total Revenue by Growth System
-
Operational Cost by Energy Source
-
Profit by Crop Type
Because these charts appear on the main page, users can quickly understand cost drivers and revenue contributors.
Click to Purchases Vertical Farming Dashboard in Excel
What Is the Crop Type Analysis Page Used For?

The Crop Type Analysis Page focuses on performance comparison across different crops.
What Charts Are Included on the Crop Type Analysis Page?
This page contains four detailed charts:
-
Yield (Kg) by Crop Type
-
Operational Cost by Crop Type
-
Profit Margin (%) by Crop Type
-
Total Revenue by Crop Type
These visuals help identify which crops deliver the highest yield and profitability.
Why Is Crop Type Analysis Important?
Crop selection directly impacts yield, cost efficiency, and revenue. Therefore, this page helps decision-makers:
-
Optimize crop portfolios
-
Identify low-performing crops
-
Improve pricing and production strategies
What Is the Country Analysis Page Used For?
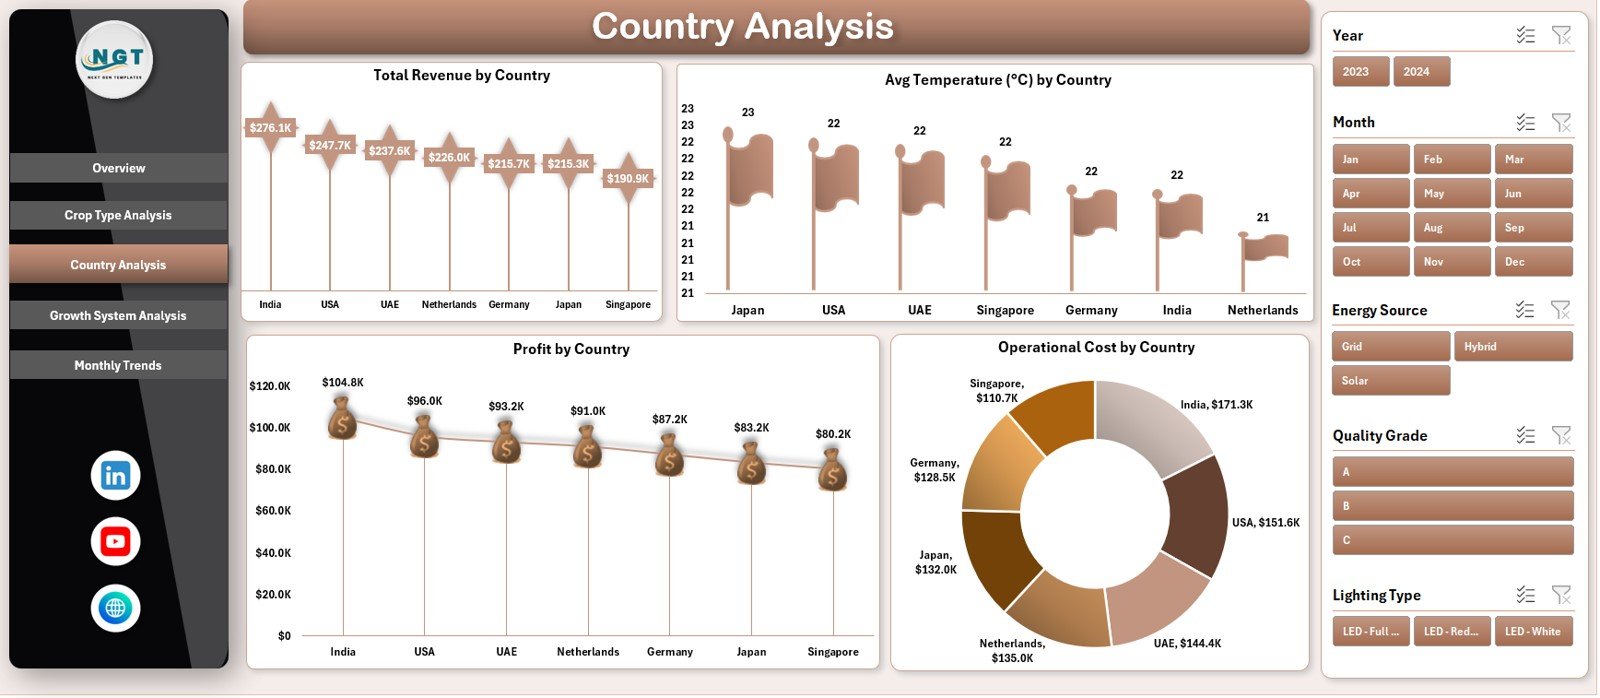
The Country Analysis Page compares vertical farming performance across geographic locations.
What Charts Are Displayed on the Country Analysis Page?
This page includes four charts:
-
Total Revenue by Country
-
Average Temperature (°C) by Country
-
Profit by Country
-
Operational Cost by Country
These charts show how climate and geography affect farm performance.
Click to Purchases Vertical Farming Dashboard in Excel
How Does Country Analysis Support Decision-Making?
Country-level analysis helps organizations:
-
Compare regional profitability
-
Understand climate impact on yield
-
Plan expansion strategies
-
Optimize location-based investments
What Is the Growth System Analysis Page?
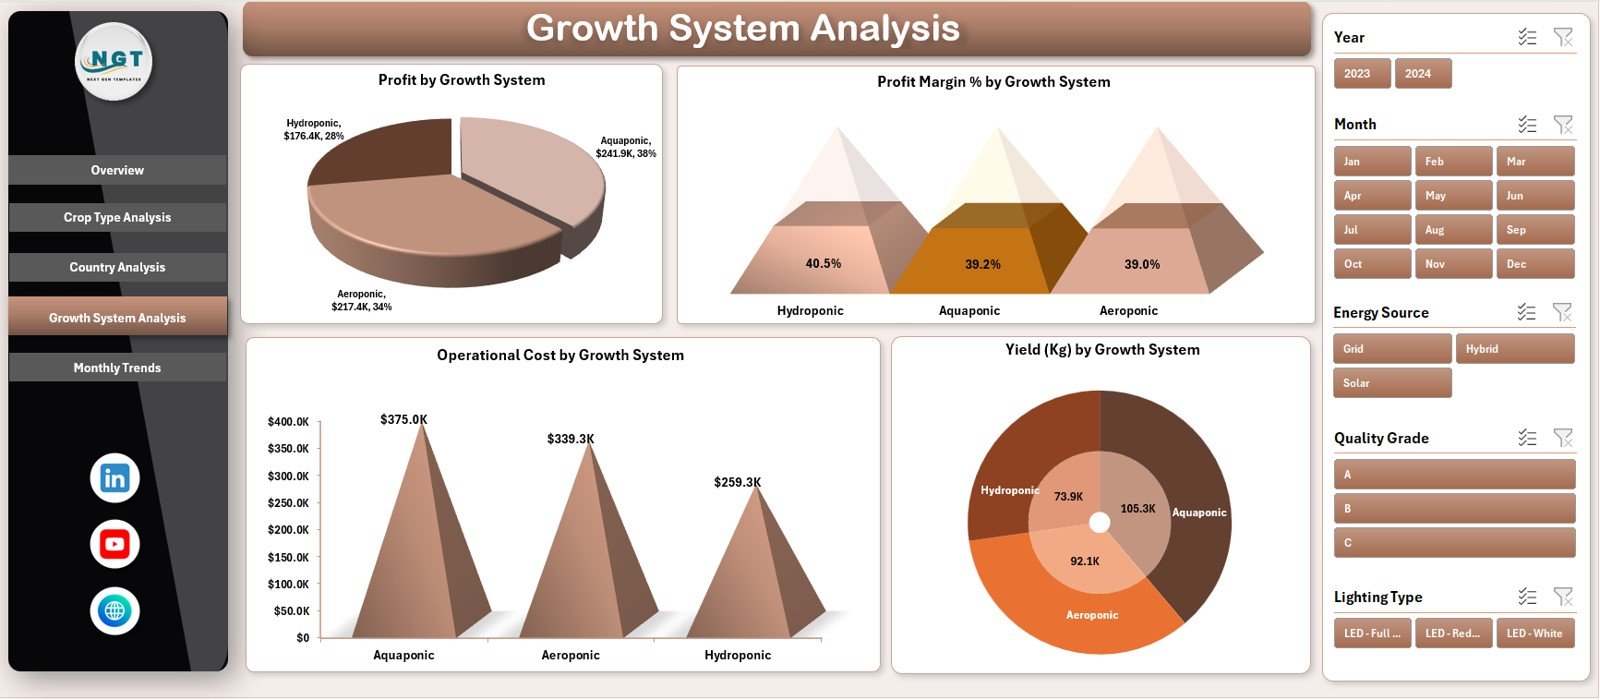
The Growth System Analysis Page evaluates performance across different vertical farming systems.
What Charts Are Included on This Page?
This page displays four charts:
-
Profit by Growth System
-
Profit Margin (%) by Growth System
-
Operational Cost by Growth System
-
Yield (Kg) by Growth System
Because growth systems directly affect efficiency, this page plays a critical role in operational planning.
Why Is Growth System Analysis Important?
Different growth systems consume varying levels of energy and resources. Therefore, this analysis helps teams:
-
Select cost-effective systems
-
Improve energy efficiency
-
Increase yield consistency
What Is the Monthly Trends Page Used For?
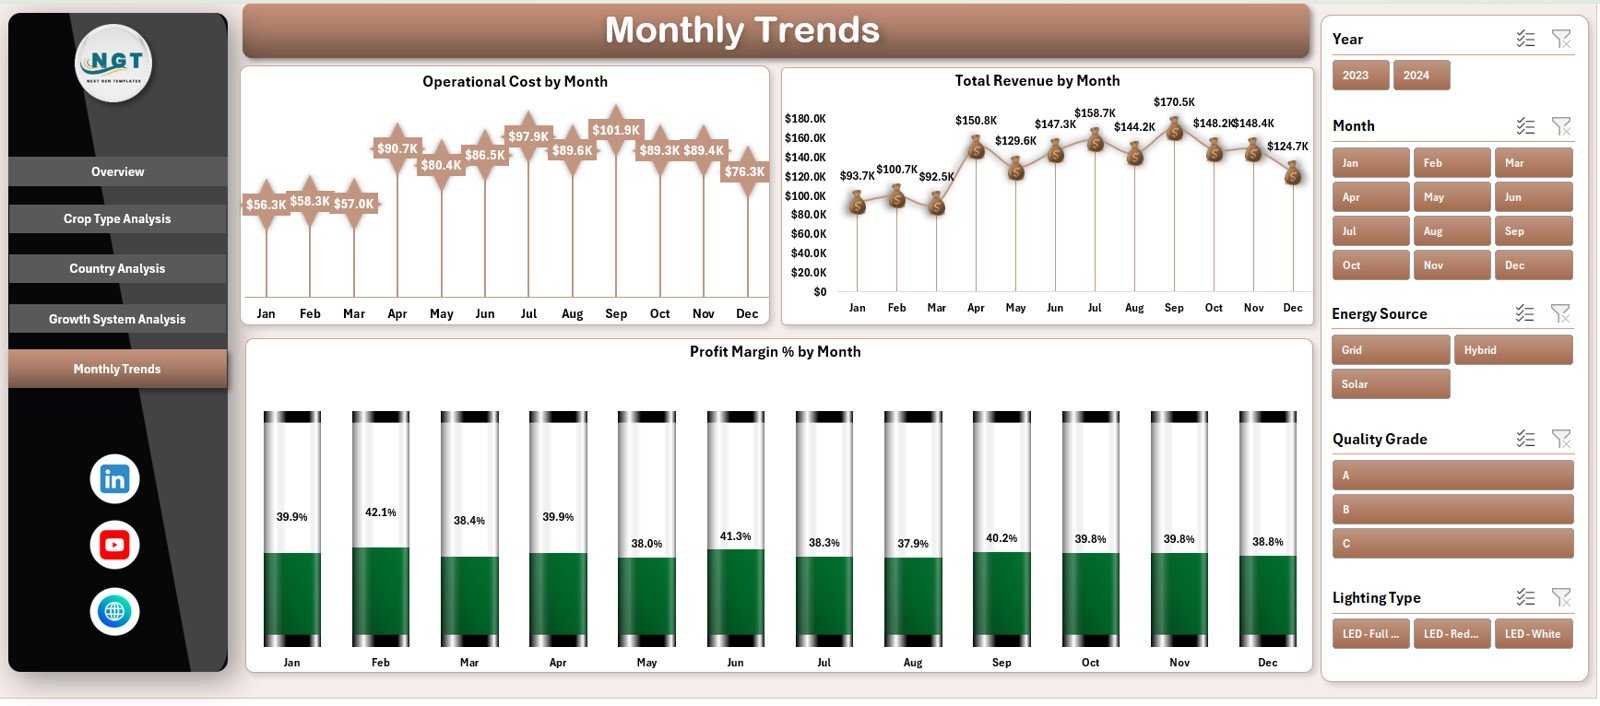
The Monthly Trends Page tracks time-based performance.
What Charts Are Included on the Monthly Trends Page?
This page contains three trend charts:
-
Operational Cost by Month
-
Total Revenue by Month
-
Profit Margin (%) by Month
These charts help users identify seasonal patterns and cost fluctuations.
How Do Monthly Trends Improve Planning?
By analyzing monthly trends, teams can:
-
Forecast future performance
-
Identify peak and low periods
-
Improve budget planning
-
Optimize production schedules
Advantages of Vertical Farming Dashboard in Excel
Using this dashboard offers several practical and strategic benefits.
1. Centralized Performance Monitoring
All key metrics remain in one Excel file.
2. Faster Decision-Making
Visual insights reduce analysis time.
3. Improved Cost Control
Operational cost tracking highlights inefficiencies.
4. Yield Optimization
Crop-level insights support better production planning.
5. Revenue and Profit Visibility
Financial metrics remain clear and transparent.
6. Easy Customization
Excel allows flexible changes and additions.
7. No Advanced Tools Required
Anyone familiar with Excel can use the dashboard.
Click to Purchases Vertical Farming Dashboard in Excel
Best Practices for Vertical Farming Dashboard in Excel
To maximize the value of the dashboard, follow these best practices.
1. Maintain Accurate Data
Ensure data entry remains consistent and correct.
2. Update Data Regularly
Monthly updates keep insights relevant.
3. Use Slicers for Focused Analysis
Avoid analyzing all data at once.
4. Review Trends, Not Just Totals
Trends reveal hidden patterns.
5. Compare Crop and System Performance
Use comparison charts for optimization.
6. Align Metrics with Business Goals
Track KPIs that support profitability and sustainability.
How Does This Dashboard Support Sustainable Farming?
This dashboard helps organizations:
-
Reduce energy waste
-
Optimize crop yield
-
Improve profit margins
-
Support sustainable agriculture goals
-
Make data-driven decisions
As a result, vertical farming operations become more efficient and scalable.
Click to Purchases Vertical Farming Dashboard in Excel
Conclusion: Why Should You Use a Vertical Farming Dashboard in Excel?
A Vertical Farming Dashboard in Excel turns complex agricultural data into clear, actionable insights. Instead of reacting late, teams can monitor performance continuously and make informed decisions.
Because it combines financial, operational, and production metrics into one visual tool, this dashboard becomes an essential asset for modern vertical farming businesses.
Ultimately, it supports efficiency, profitability, and long-term sustainability.
Frequently Asked Questions (FAQs)
What is a Vertical Farming Dashboard in Excel?
It is an Excel-based dashboard that tracks costs, revenue, yield, and profit for vertical farming operations.
Who can use this dashboard?
Farm managers, agritech startups, analysts, and sustainability teams.
Does the dashboard support multiple crop types?
Yes, it includes detailed crop-level analysis.
Can I customize the dashboard?
Yes, Excel allows easy customization.
Does the dashboard show monthly trends?
Yes, it includes monthly cost, revenue, and profit trends.
Is Excel enough for vertical farming analytics?
Yes, Excel provides flexibility and accessibility for performance tracking.
Click to Purchases Vertical Farming Dashboard in Excel
Visit our YouTube channel to learn step-by-step video tutorials