Financial audits demand precision, transparency, and speed. However, many audit teams still rely on scattered Excel files, manual calculations, and static reports. As a result, auditors waste time, miss trends, and struggle to explain results clearly. Therefore, organizations now adopt a Financial Auditing KPI Dashboard in Power BI to bring clarity, control, and confidence into the audit process.
A Financial Auditing KPI Dashboard in Power BI converts raw audit data into clear visuals, actionable KPIs, and real-time insights. Instead of checking multiple sheets, auditors monitor performance from one interactive dashboard. Consequently, audit quality improves, reporting time reduces, and stakeholders gain trust.
In this detailed guide, you will learn everything about the Financial Auditing KPI Dashboard in Power BI. Moreover, you will understand how it works, its page-wise structure, advantages, best practices, and frequently asked questions. Additionally, the language remains simple and practical so anyone can implement it easily.
Click to buy Financial Auditing KPI Dashboard in Power BI
What Is a Financial Auditing KPI Dashboard in Power BI?
A Financial Auditing KPI Dashboard in Power BI is a ready-to-use analytics solution designed to track, measure, and visualize audit-related key performance indicators. It helps internal auditors, external auditors, compliance teams, and finance leaders monitor audit effectiveness and efficiency.
Instead of reviewing long audit reports, users view KPIs such as audit completion status, target achievement, and year-over-year comparisons on one screen. As a result, decision-making becomes faster and more accurate.
Why Do Audit Teams Prefer Power BI for KPI Dashboards?
Audit teams choose Power BI because it delivers:
- Interactive visuals instead of static tables
- Automated calculations instead of manual formulas
- Drill-through analysis instead of guesswork
- Clean presentation for management and regulators
Therefore, Power BI fits perfectly into modern financial auditing workflows.
Why Do Financial Audits Need KPI Dashboards?
Financial audits involve multiple KPIs across departments, periods, and audit types. However, manual tracking creates confusion and delays. Hence, a KPI dashboard becomes essential.
How a KPI Dashboard Solves These Problems
A Financial Auditing KPI Dashboard in Power BI:
- Centralizes all audit KPIs
- Automates MTD and YTD calculations
- Highlights target achievements instantly
- Enables quick drill-down into details
- Improves audit transparency and control
Overview of Financial Auditing KPI Dashboard in Power BI
This dashboard works as a ready-to-use Power BI file connected to an Excel data source. You only update the Excel file, and the dashboard refreshes automatically.
Data Source: Excel-Based Structure
The dashboard uses an Excel file with three structured worksheets:
- Input_Actual
- Input_Target
- KPI Definition
Because Excel acts as the data source, users maintain flexibility without complex integrations.
Dashboard Structured
The Financial Auditing KPI Dashboard in Power BI contains three well-designed pages. Each page serves a clear purpose and improves analysis.
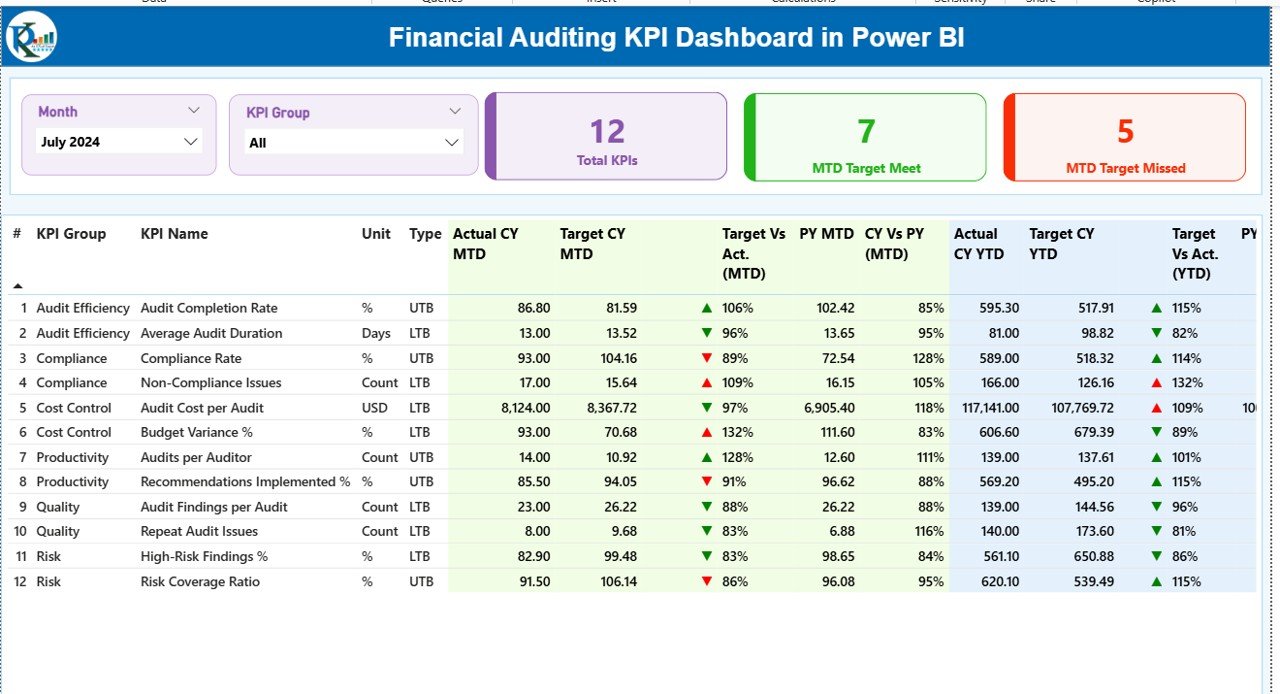
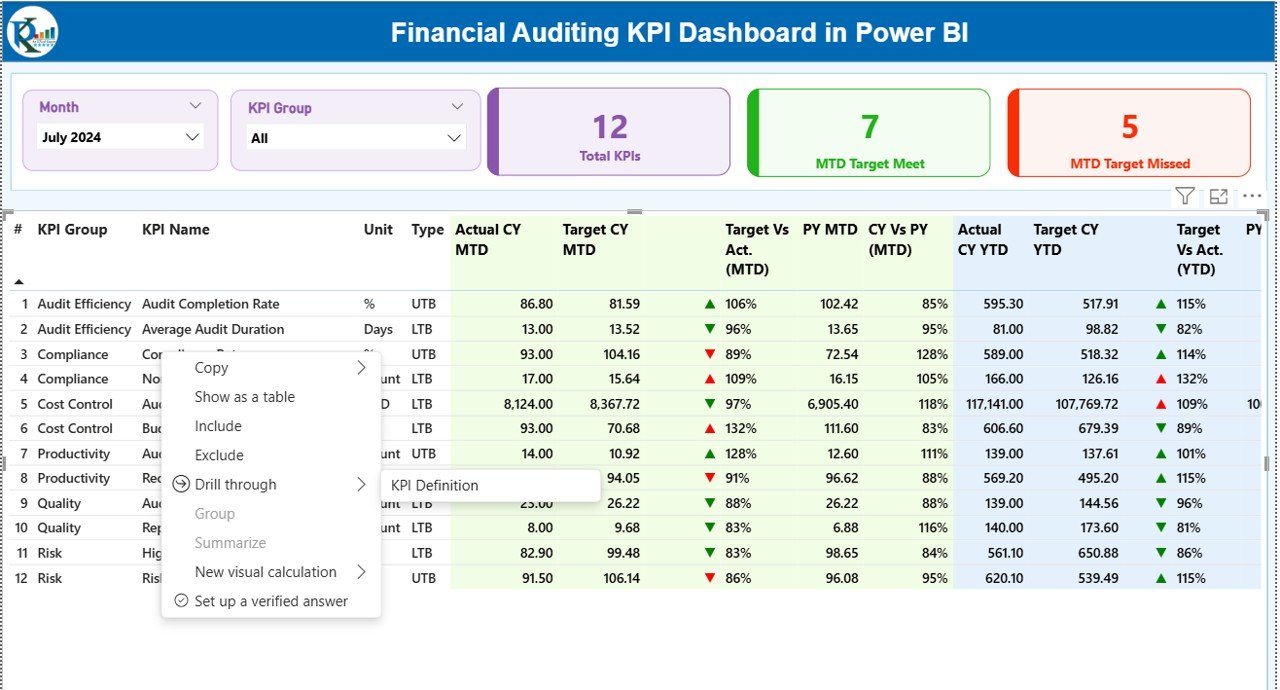
Summary Page
The Summary Page acts as the control center of the dashboard. Auditors start their analysis here.
Top-Level Slicers
At the top, users see:
- Month Slicer – Select any month easily
- KPI Group Slicer – Filter KPIs by audit category
These slicers update the entire dashboard instantly.
KPI Cards for Quick Insights
Below the slicers, three KPI cards display:
- Total KPIs Count
- MTD Target Met Count
- MTD Target Missed Count
These cards provide an instant health check of audit performance.
Detailed KPI Table Explained
The detailed table displays comprehensive audit KPI data, including:
- KPI Number – Unique sequence number
- KPI Group – Audit category
- KPI Name – KPI description
- Unit – Measurement unit
- Type – LTB (Lower the Better) or UTB (Upper the Better)
MTD Performance Columns
- Actual CY MTD – Current year actual MTD value
- Target CY MTD – Target MTD value
- MTD Icon – ▲ or ▼ to show status
- Target vs Actual (MTD) – Actual ÷ Target
- PY MTD – Previous year MTD value
- CY vs PY (MTD) – Year-over-year comparison
YTD Performance Columns
- Actual CY YTD – Current year YTD value
- Target CY YTD – Target YTD value
- YTD Icon – ▲ or ▼ for target status
- Target vs Actual (YTD) – Actual ÷ Target
- PY YTD – Previous year YTD value
- CY vs PY (YTD) – Year-over-year comparison
Because of icons and percentages, users identify issues instantly.
Click to buy Financial Auditing KPI Dashboard in Power BI
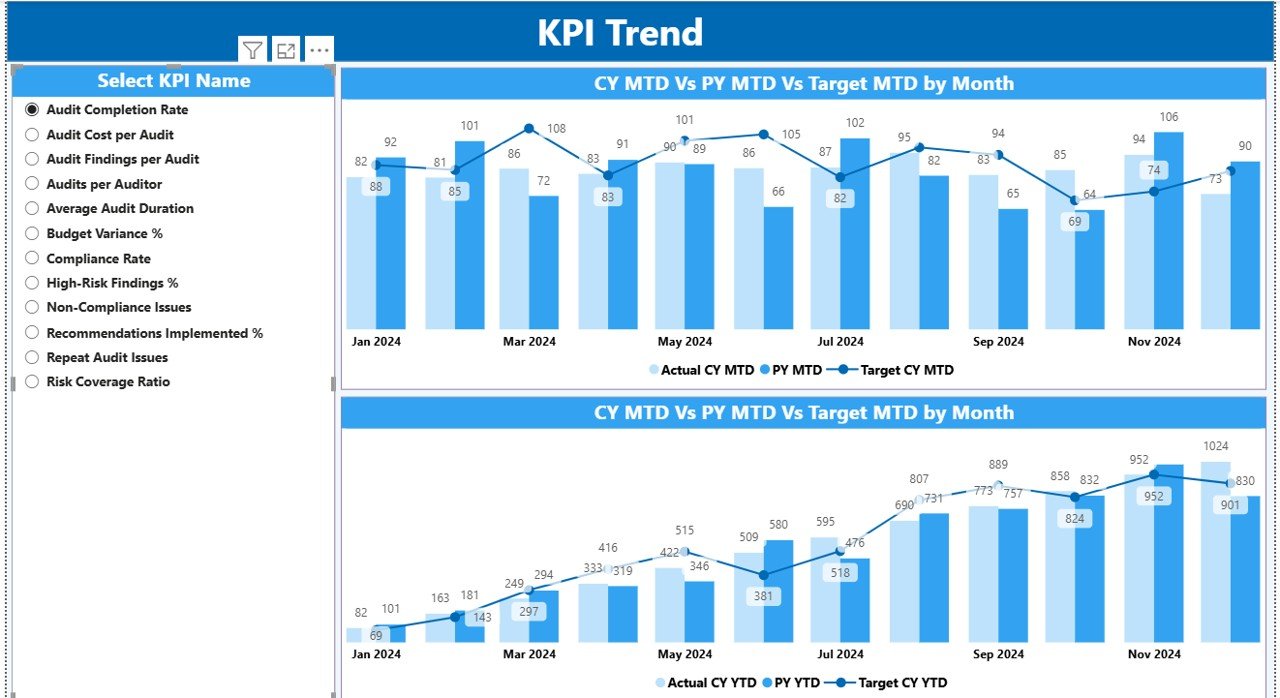
KPI Trend Page
The KPI Trend Page focuses on performance over time. Therefore, it supports deeper analysis.
Key Features of the KPI Trend Page
This page includes:
- Two Combo Charts
MTD performance comparison
YTD performance comparison
Each chart shows:
- Current Year Actual
- Previous Year Actual
- Target Values
KPI Selection Slicer
A slicer on the left lets users select any KPI. Once selected, the charts update automatically. As a result, auditors analyze trends without switching reports.
Click to buy Financial Auditing KPI Dashboard in Power BI
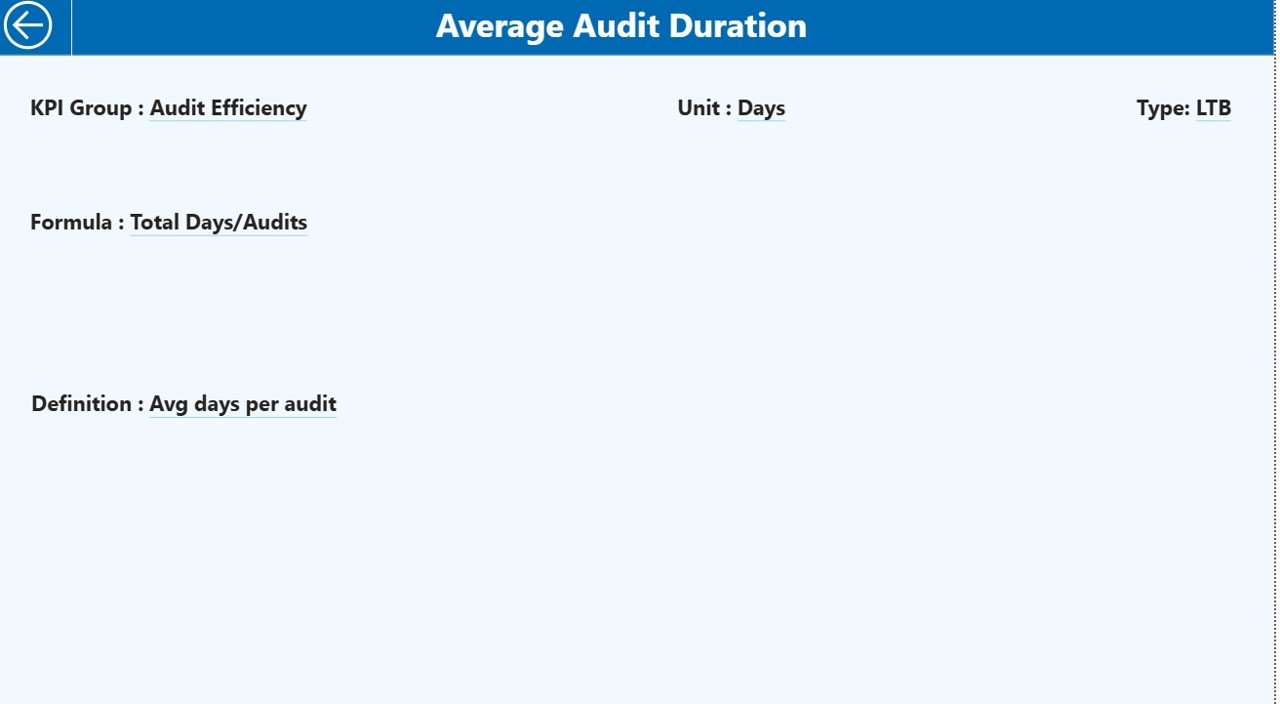
KPI Definition Page
The KPI Definition Page acts as a drill-through page. Although it stays hidden, it plays a critical role.
What Information Does It Show?
This page displays:
- KPI Formula
- KPI Definition
- KPI Type (LTB or UTB)
From the summary page, users drill through to this page. After reviewing details, they click the Back button to return.
Therefore, auditors always understand what each KPI represents.
Click to buy Financial Auditing KPI Dashboard in Power BI
How Does the Excel Data Model Work?
The dashboard depends on a structured Excel file. Hence, correct data entry ensures accurate results.
Input_Actual Sheet
In this sheet, users enter:
- KPI Name
- Month (first date of the month)
- MTD Actual Value
- YTD Actual Value
Click to buy Financial Auditing KPI Dashboard in Power BI
Input_Target Sheet
Here, users enter:
- KPI Name
- Month (first date of the month)
- MTD Target Value
- YTD Target Value
KPI Definition Sheet
This sheet includes:
- KPI Number
- KPI Group
- KPI Name
- Unit
- Formula
- Definition
- Type (LTB or UTB)
Because of this structure, the dashboard calculates everything automatically.
Advantages of Financial Auditing KPI Dashboard in Power BI
Why Should Audit Teams Use This Dashboard?
A Financial Auditing KPI Dashboard in Power BI offers several benefits:
- Centralized audit performance monitoring
- Faster audit reporting cycles
- Clear target vs actual tracking
- Easy identification of audit risks
- Trend analysis for continuous improvement
- Transparent reporting for management
As a result, audit teams deliver better outcomes.
Who Can Use a Financial Auditing KPI Dashboard?
This dashboard fits multiple roles, including:
- Internal Audit Teams
- External Audit Firms
- Compliance Officers
- CFOs and Finance Managers
- Risk Management Teams
Because of its flexibility, both small firms and large enterprises benefit equally.
How Does This Dashboard Improve Audit Decision-Making?
This dashboard improves decision-making by:
- Highlighting underperforming KPIs instantly
- Showing year-over-year audit trends
- Supporting data-driven audit planning
- Reducing dependency on manual reports
Therefore, auditors move from reactive to proactive audits.
Best Practices for the Financial Auditing KPI Dashboard in Power BI
How Can You Get the Best Results from This Dashboard?
Follow these best practices to maximize value:
- Update Excel data regularly
- Maintain consistent KPI definitions
- Use LTB and UTB types correctly
- Validate target values periodically
- Review trends monthly and quarterly
- Train audit teams on KPI interpretation
When teams follow these practices, dashboard insights remain accurate and reliable.
Common KPIs Tracked in Financial Auditing Dashboards
Although KPIs vary by organization, common audit KPIs include:
- Audit Completion Rate
- Audit Cycle Time
- Compliance Rate
- Findings Closure Rate
- High-Risk Findings Count
- Repeat Audit Issues
These KPIs help measure both efficiency and effectiveness.
How Does This Dashboard Support Compliance and Governance?
A Financial Auditing KPI Dashboard in Power BI supports governance by:
- Providing clear audit trails
- Enabling timely corrective actions
- Improving transparency for regulators
- Supporting internal control assessments
Therefore, organizations strengthen their compliance posture.
How Can You Customize This Dashboard?
Customization remains easy and flexible. You can:
- Add new KPIs
- Modify KPI groups
- Change targets
- Apply additional slicers
- Adjust visuals
Because Power BI supports scalability, the dashboard grows with your organization.
What Makes This Dashboard Better Than Traditional Reports?
Traditional reports often:
- Take longer to prepare
- Lack interactivity
- Fail to show trends
- Confuse stakeholders
In contrast, this dashboard:
- Updates automatically
- Encourages exploration
- Simplifies explanations
- Enhances audit confidence
Final Thoughts: Why Financial Auditing KPI Dashboards Matter
Financial auditing continues to evolve. Therefore, audit teams must adopt modern tools to stay effective. A Financial Auditing KPI Dashboard in Power BI transforms audit data into insights that drive accountability, transparency, and improvement.
When organizations combine structured Excel data with Power BI visuals, they gain a powerful audit management solution. As a result, audits become faster, clearer, and more impactful.
Frequently Asked Questions (FAQs)
What Is a Financial Auditing KPI Dashboard in Power BI?
It is an interactive Power BI dashboard that tracks and visualizes audit KPIs using Excel as a data source.
Do I Need Advanced Power BI Skills to Use This Dashboard?
No. You only update Excel data. The dashboard handles calculations automatically.
Can I Add More KPIs to the Dashboard?
Yes. You can add new KPIs by updating the Excel sheets.
How Often Should I Update the Data?
You should update data monthly or as audit cycles require.
Is This Dashboard Suitable for External Audits?
Yes. Both internal and external audit teams can use it.
Can This Dashboard Support Regulatory Reporting?
Yes. It improves transparency and supports compliance reviews.
Watch the step-by-step video tutorial:
Click to buy Financial Auditing KPI Dashboard in Power BI
Visit our YouTube channel to learn step-by-step video tutorials