Financial crime continues to grow across the globe. As a result, organizations must strengthen their compliance and monitoring systems. Among all compliance areas, Anti-Money Laundering (AML) remains one of the most critical. However, tracking AML performance manually using scattered reports creates delays, errors, and compliance risks.
That is exactly where an Anti-Money Laundering (AML) KPI Dashboard in Excel plays a powerful role.
This article explains what an AML KPI Dashboard in Excel is, why organizations need it, how it works, its worksheets, key features, advantages, best practices, and frequently asked questions. Moreover, this guide helps compliance teams, auditors, and risk managers gain full control over AML performance tracking.
Click to Purchases Anti-Money Laundering (AML) KPI Dashboard in Excel
What Is an Anti-Money Laundering (AML) KPI Dashboard in Excel?
An Anti-Money Laundering (AML) KPI Dashboard in Excel is a ready-to-use, interactive reporting tool that tracks, measures, and analyzes AML-related key performance indicators in a structured format.
Instead of reviewing multiple files, emails, and static reports, teams use one centralized Excel dashboard to:
-
Monitor AML compliance performance
-
Track monthly and yearly trends
-
Compare targets with actual performance
-
Analyze previous year results
-
Identify compliance gaps early
Because Excel supports formulas, charts, drop-downs, and conditional formatting, the AML KPI Dashboard becomes both powerful and easy to use.
Why Do Organizations Need an AML KPI Dashboard in Excel?
Financial institutions face strict regulatory pressure. Therefore, they must track AML metrics accurately and consistently. However, manual tracking leads to confusion and delayed reporting.
An AML KPI Dashboard in Excel solves these challenges effectively.
Key Reasons Organizations Use an AML KPI Dashboard
-
AML regulations require regular monitoring
-
Auditors demand accurate historical data
-
Management needs quick insights
-
Compliance teams require monthly tracking
-
Risk teams need trend analysis
As a result, organizations move from reactive compliance to proactive risk management.
How Does an AML KPI Dashboard in Excel Work?
The AML KPI Dashboard works through a structured worksheet design. Each worksheet serves a specific purpose. Together, all sheets create a complete AML performance tracking system.
Users enter actual numbers, target values, and previous year data. Then, the dashboard automatically calculates MTD, YTD, Target vs Actual, and PY vs Actual using formulas.
Consequently, decision-makers see clear insights without manual calculations.
Click to Purchases Anti-Money Laundering (AML) KPI Dashboard in Excel
What Are the Key Features of the AML KPI Dashboard in Excel?
The AML KPI Dashboard includes 7 professionally designed worksheets. Each sheet plays a crucial role in compliance monitoring.
Let us explore each worksheet in detail.
1. What Is the Home Sheet in the AML KPI Dashboard?
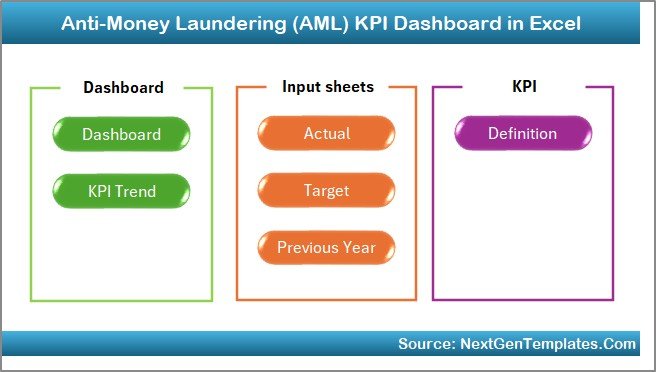
The Home Sheet works as an index page.
Key Highlights of the Home Sheet
-
Clean and professional layout
-
6 navigation buttons
-
One-click movement to any worksheet
-
User-friendly design
Because of this structure, users navigate the dashboard quickly without confusion.
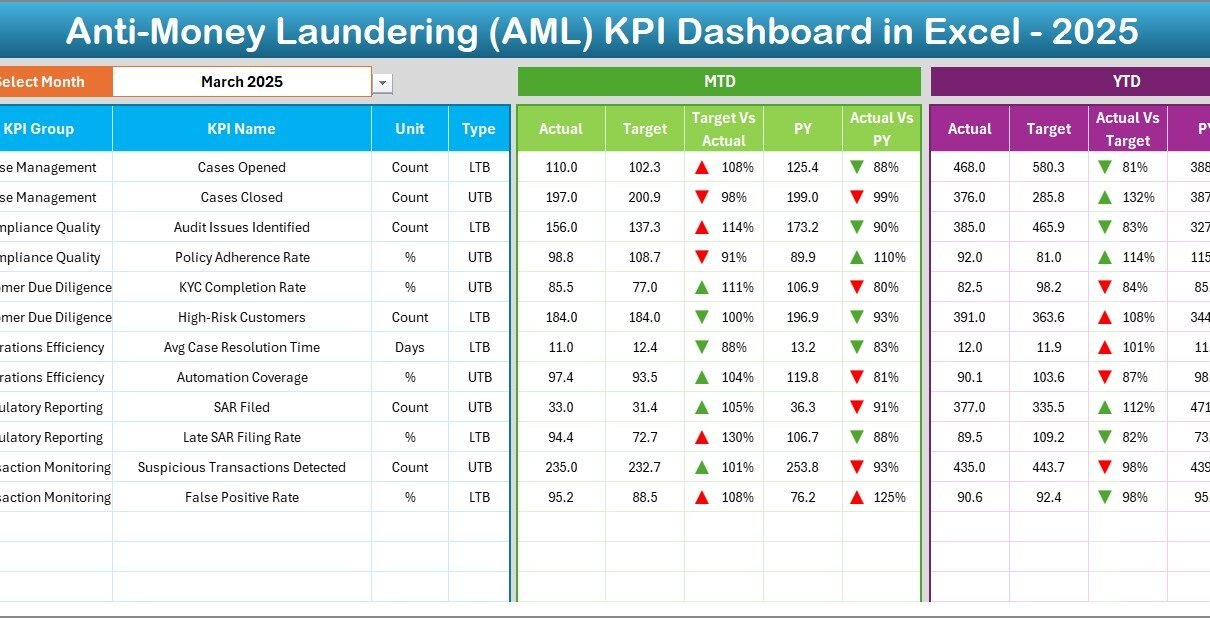
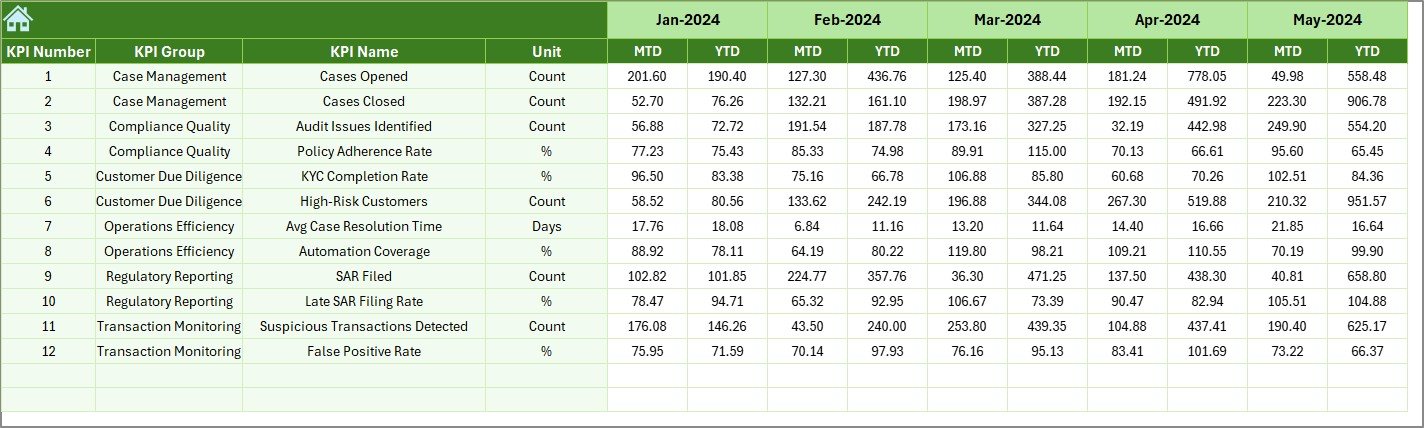
2. What Is the Dashboard Sheet in the AML KPI Dashboard?
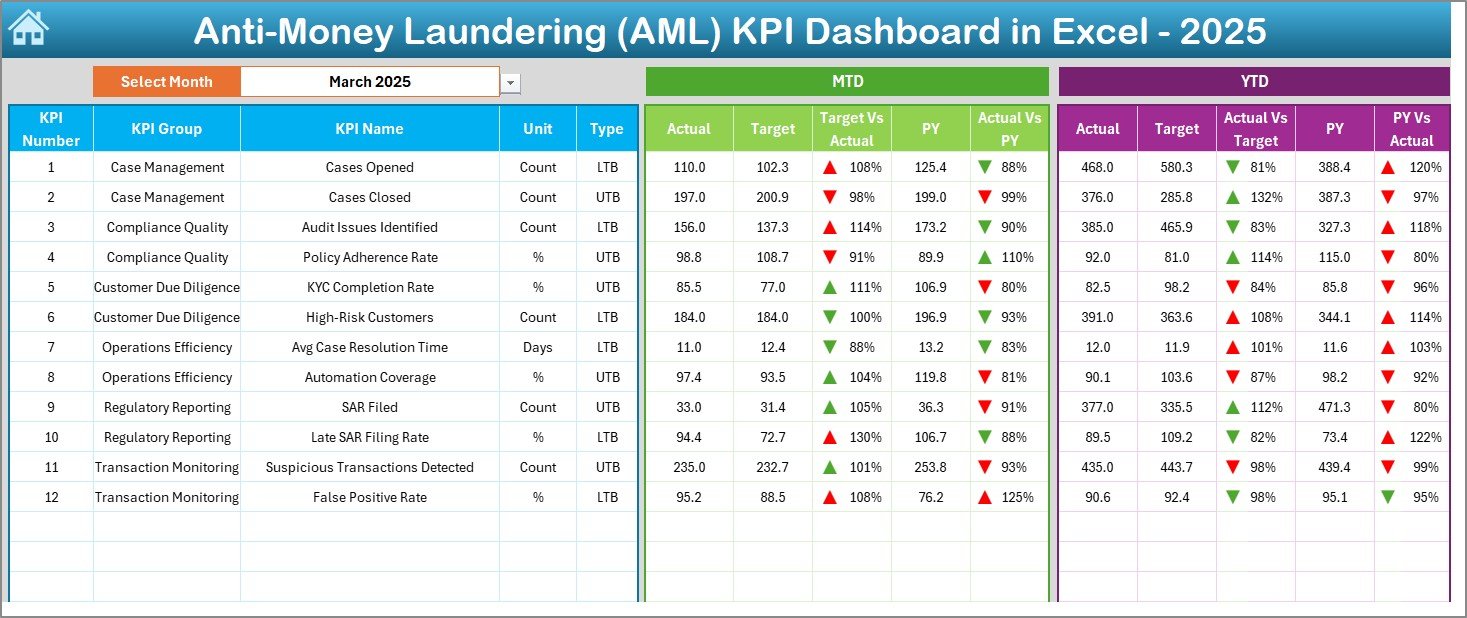
The Dashboard Sheet acts as the heart of the AML KPI Dashboard.
Key Functions of the Dashboard Sheet
-
Displays all KPIs in one view
-
Allows month selection using a drop-down (Cell D3)
-
Updates all numbers dynamically
KPIs Displayed on the Dashboard
-
MTD Actual
-
MTD Target
-
MTD Previous Year
-
Target vs Actual
-
PY vs Actual
-
YTD Actual
-
YTD Target
-
YTD Previous Year
Moreover, the dashboard uses conditional formatting with up and down arrows, which instantly highlights performance.
As a result, users quickly identify overperformance and underperformance.
Click to Purchases Anti-Money Laundering (AML) KPI Dashboard in Excel
3. How Does the KPI Trend Sheet Help in AML Analysis?
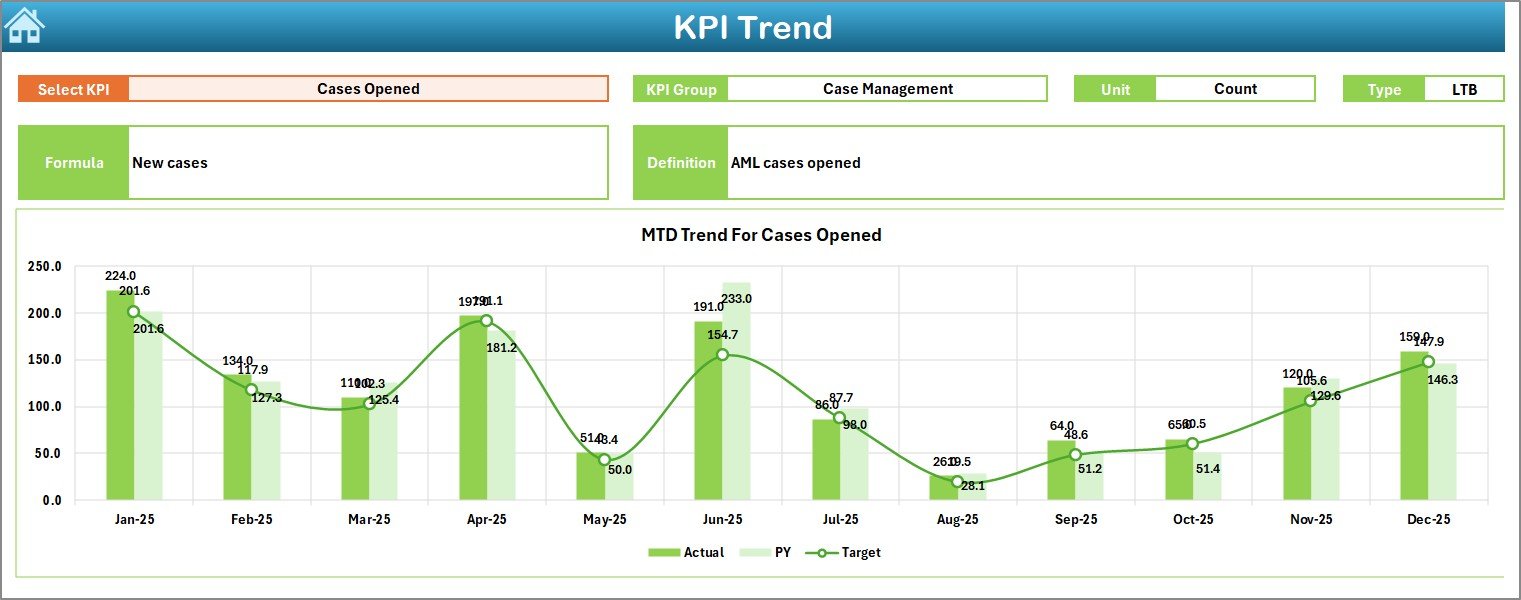
The KPI Trend Sheet focuses on deep KPI-level analysis.
Features of the KPI Trend Sheet
-
KPI selection drop-down (Cell C3)
-
Displays KPI Group
-
Shows KPI Unit
-
Shows KPI Type (Lower the Better or Upper the Better)
-
Displays KPI Formula
-
Shows KPI Definition
Trend Charts Available
-
MTD Trend Chart (Actual, Target, PY)
-
YTD Trend Chart (Actual, Target, PY)
Because of these visuals, compliance teams easily analyze patterns and identify long-term issues.
4. What Is the Actual Numbers Input Sheet?
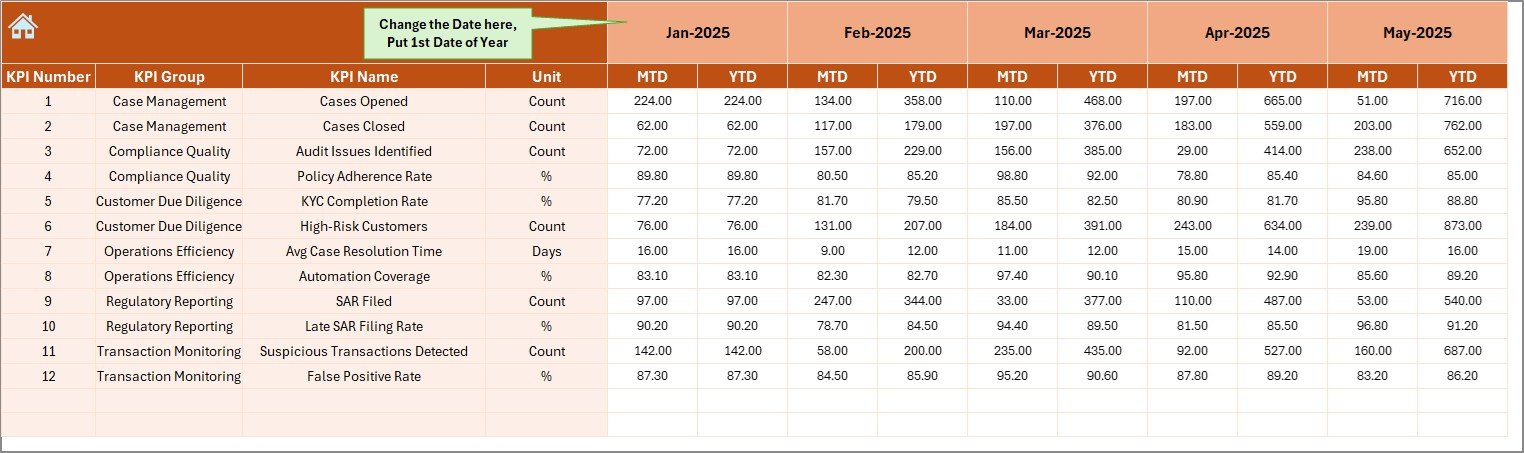
The Actual Numbers Input Sheet captures real performance data.
How This Sheet Works
-
Users enter MTD and YTD actual values
-
Month selection available in Cell E1
-
Automatically aligns data for the selected year
Since this sheet feeds the entire dashboard, accurate data entry ensures reliable results.
5. What Is the Target Sheet in the AML KPI Dashboard?
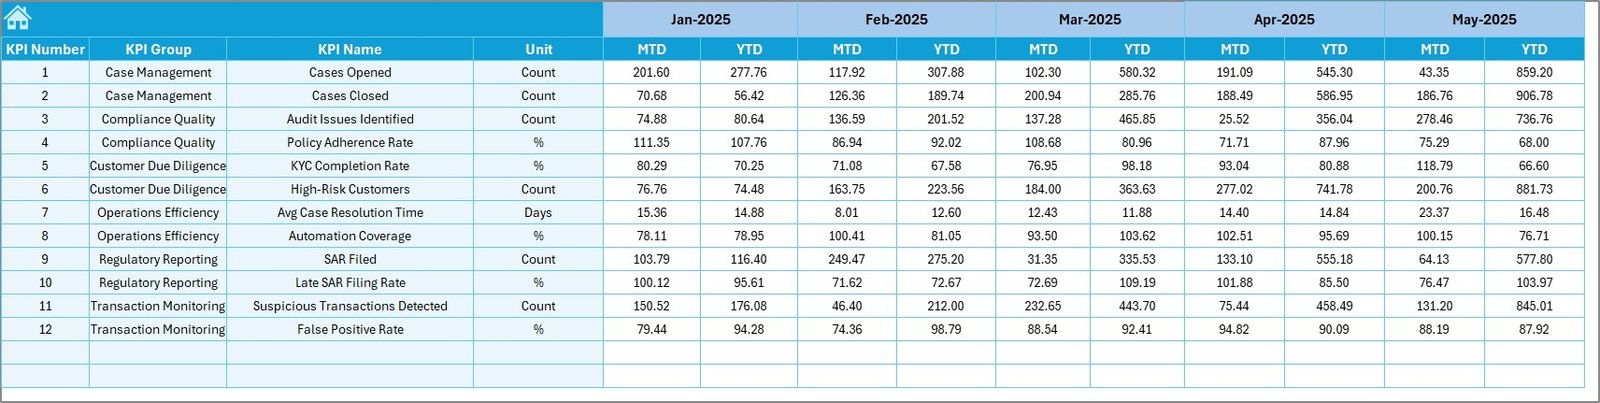
The Target Sheet stores performance benchmarks.
Purpose of the Target Sheet
-
Enter monthly target values
-
Maintain MTD and YTD targets
-
Support performance comparison
As a result, teams always know whether performance meets regulatory expectations.
Click to Purchases Anti-Money Laundering (AML) KPI Dashboard in Excel
6. What Is the Previous Year Numbers Sheet?
The Previous Year Numbers Sheet enables year-over-year comparison.
Why This Sheet Matters
-
Stores last year’s AML data
-
Enables PY vs Actual comparison
-
Helps identify improvement or decline
Because regulators often demand historical analysis, this sheet becomes extremely valuable.
7. What Is the KPI Definition Sheet?
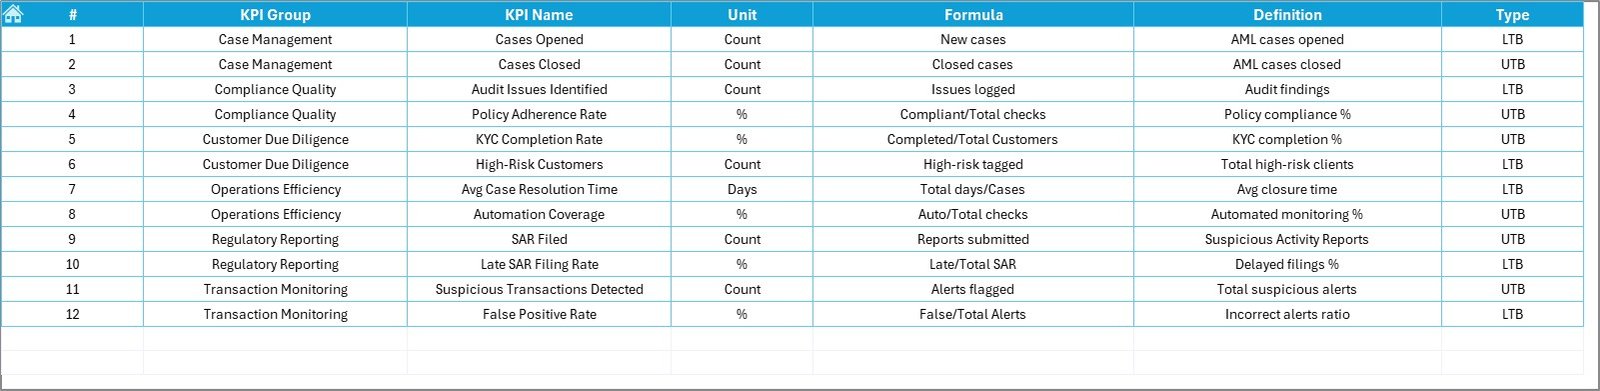
The KPI Definition Sheet acts as a reference table.
Information Stored in This Sheet
-
KPI Name
-
KPI Group
-
Unit of Measure
-
KPI Formula
-
KPI Definition
Since all KPI logic remains documented, the dashboard stays transparent and audit-ready.
Which KPIs Can You Track Using an AML KPI Dashboard in Excel?
Organizations customize KPIs based on regulations and risk profiles. However, common AML KPIs include:
-
Suspicious Transaction Reports (STRs)
-
AML Alerts Generated
-
Alerts Investigated
-
Alerts Closed
-
False Positive Rate
-
Investigation Turnaround Time
-
Compliance Breaches
-
KYC Completion Rate
-
High-Risk Customer Count
-
Transaction Monitoring Coverage
Because Excel remains flexible, teams easily add or remove KPIs.
Click to Purchases Anti-Money Laundering (AML) KPI Dashboard in Excel
Advantages of Anti-Money Laundering (AML) KPI Dashboard in Excel
An AML KPI Dashboard in Excel delivers multiple benefits across departments.
1. Improves Compliance Visibility
The dashboard presents all AML KPIs in one place. Therefore, compliance teams track risks without delays.
2. Saves Time and Effort
Automated calculations reduce manual work. As a result, teams focus on investigation instead of reporting.
3. Enhances Decision-Making
Clear visuals and trends help management take quick and informed decisions.
4. Supports Regulatory Audits
Well-structured data and definitions improve audit readiness.
5. Offers Cost-Effective Solution
Excel eliminates the need for expensive AML software for small and mid-size organizations.
6. Ensures Data Consistency
Centralized data entry reduces errors and mismatches.
How Does an AML KPI Dashboard in Excel Improve Risk Management?
Risk management requires early detection. This dashboard highlights deviations immediately using arrows and trend charts.
As a result:
-
Teams act before compliance failures occur
-
Management sees risks early
-
Regulators receive timely reports
Therefore, organizations strengthen their AML framework.
Best Practices for the Anti-Money Laundering (AML) KPI Dashboard in Excel
To achieve maximum value, follow these best practices.
1. Define Clear KPIs
Always define KPIs clearly in the KPI Definition Sheet. Clear definitions avoid confusion.
2. Maintain Data Accuracy
Enter actual, target, and previous year data carefully. Incorrect data leads to wrong insights.
3. Update the Dashboard Monthly
Update the month selection regularly to keep reports current.
4. Use Standard Units
Keep units consistent across all KPIs to maintain clarity.
5. Review Trends Regularly
Analyze MTD and YTD trends every month to detect patterns early.
6. Limit Manual Changes
Avoid unnecessary formula changes to maintain dashboard integrity.
7. Protect Sensitive Data
Apply password protection to prevent unauthorized access.
Who Should Use an AML KPI Dashboard in Excel?
This dashboard benefits multiple roles, such as:
-
AML Compliance Officers
-
Risk Managers
-
Internal Auditors
-
Compliance Analysts
-
Financial Controllers
-
Senior Management
Because Excel remains widely used, adoption becomes easy across teams.
Click to Purchases Anti-Money Laundering (AML) KPI Dashboard in Excel
Can Small Organizations Use an AML KPI Dashboard in Excel?
Yes, absolutely.
Small and mid-size organizations often lack expensive AML tools. Therefore, an Excel-based AML KPI Dashboard offers a perfect balance between cost, flexibility, and control.
How Does This Dashboard Support Management Reporting?
Management needs summarized insights. The dashboard delivers:
-
Monthly compliance status
-
Target achievement
-
Risk trends
-
Performance gaps
As a result, leadership receives quick and clear updates.
Conclusion
An Anti-Money Laundering (AML) KPI Dashboard in Excel provides a structured, reliable, and user-friendly solution for AML performance tracking. It eliminates manual reporting challenges, improves compliance visibility, and supports data-driven decision-making.
With clearly defined worksheets, dynamic charts, trend analysis, and conditional formatting, this dashboard empowers organizations to strengthen their AML framework efficiently.
Ultimately, organizations that adopt an AML KPI Dashboard in Excel move closer to proactive compliance and effective risk management.
Click to Purchases Anti-Money Laundering (AML) KPI Dashboard in Excel
Frequently Asked Questions (FAQs)
What is the main purpose of an AML KPI Dashboard in Excel?
The main purpose is to track, analyze, and monitor AML performance metrics in one centralized Excel file.
Can I customize KPIs in the AML KPI Dashboard?
Yes, you can easily add, remove, or modify KPIs based on regulatory and organizational needs.
Does this dashboard support monthly and yearly analysis?
Yes, it supports both MTD and YTD analysis along with previous year comparison.
Is Excel secure enough for AML reporting?
Yes, when combined with password protection and access controls, Excel offers adequate security for internal AML reporting.
Who should maintain the AML KPI Dashboard?
AML compliance teams or designated analysts should maintain and update the dashboard regularly.
Can this dashboard be used for audits?
Yes, the structured data, KPI definitions, and historical comparisons make it highly audit-friendly.
Click to Purchases Anti-Money Laundering (AML) KPI Dashboard in Excel
Visit our YouTube channel to learn step-by-step video tutorials