New: NextGenTemplates Academy - video courses on Excel formulas with AI and Pivot Tables & dashboards. Early-bird: 20% off with code EARLYBIRD20 - first 20 orders only. See the courses →
  • Learn Excel (Free Course)
    • 1. Shortcut Keys
    • 2. Fill & Flash Fill
    • 3. Find & Replace
    • 4. Sort & Filter
    • 5. Formulas & Functions
    • 6. Data Validation
    • 7. Conditional Formatting
    • 8. Basic Charts
    • 9. Advanced Charts
    • 10. Pivot Tables
    • 11. Excel Dashboards
    • 12. VBA Course
    • 13. Excel Formulas with AI
  • Templates
  • Tutorials
    • Charts and Visualization
    • VBA
    • Excel Tips and Tricks
    • Excel Dashboards
    • Power Pivot & DAX
  • Power BI
  • Template Store
    • Ready to Use Templates
  • Courses
  • Academy
    • Excel + AI Mastery: 100 Formulas
    • Excel Pivot Tables & Dashboards
  • About Us
  • Contact Us

PK: An Excel Expert

Transforming Data into Decisions

Home>Blogs>Dashboard>Civic Engagement Platforms Dashboard in Excel
Dashboard

Civic Engagement Platforms Dashboard in Excel

26 Mar 2026
457Comments Off on Civic Engagement Platforms Dashboard in Excel

Table of Contents

Toggle
  • Introduction
  • Key Features of Civic Engagement Platforms Dashboard in Excel
  • Dashboard Pages Explanation
    • 1. Overview Page
    • 2. Platform Performance
    • 3. Campaign Type Analysis
    • 4. Geographic Analysis
    • 5. Outcome & Status
    • 6. Data Sheet Tab
    • 7. Support Sheet
  • Advantages of Civic Engagement Platforms Dashboard in Excel
  • Opportunities for Improvement
  • Best Practices
  • FAQs
    • Can I customize the dashboard to add more metrics?
    • Is it compatible with Excel versions other than Microsoft 365?
    • How often should I update the data sheet?
    • Can I share this dashboard with others?
  • Conclusion
    • Watch the step-by-step video tutorial:

Introduction

The Civic Engagement Platforms Dashboard in Excel is a powerful, ready-to-use tool designed to help organizations track and analyze civic engagement activities efficiently. By simply updating your data in the Data sheet and refreshing the dashboard, you can gain valuable insights into visits, users, campaigns, funds raised, and much more.

Click to Purchases Civic Engagement Platforms Dashboard in Excel

Key Features of Civic Engagement Platforms Dashboard in Excel

  • Dynamic and interactive Excel dashboard made for civic engagement analysis.
  • Multiple pages covering different dimensions of civic platform performance.
  • Easy data refresh capability to update the entire dashboard with a single click.
  • Comprehensive use of cards, charts, and slicers for quick filtering and in-depth analysis.
  • Automated pivot tables driving dynamic charts for real-time insights.

Dashboard Pages Explanation

1. Overview Page

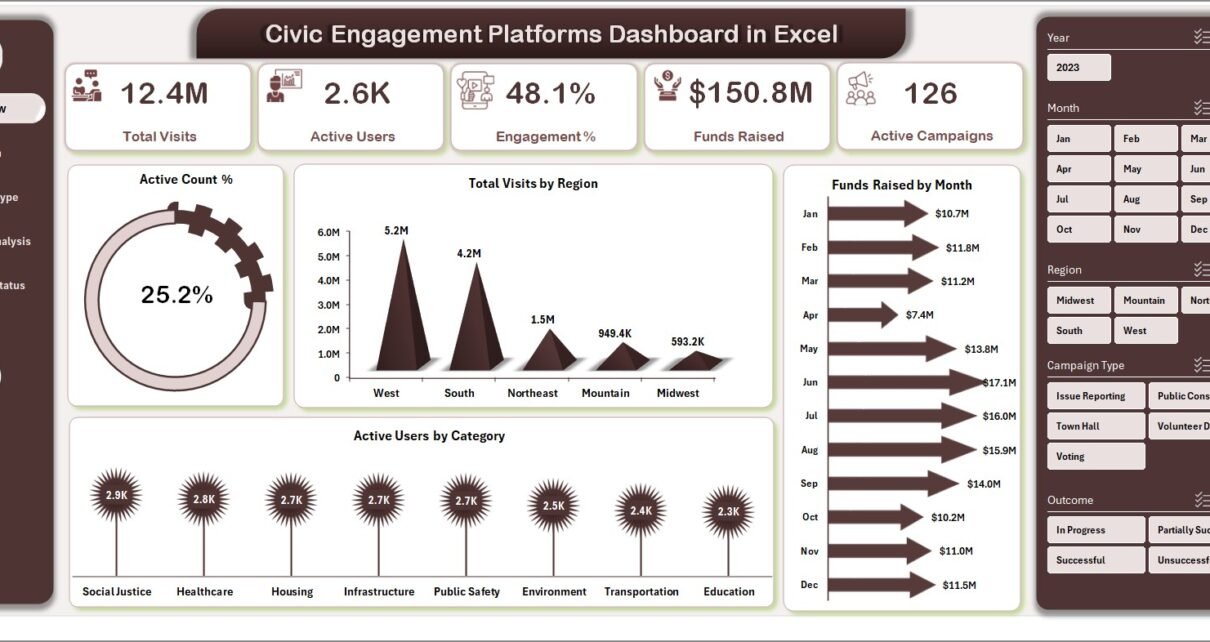
The Overview page offers a snapshot of your civic engagement performance through high-level cards and interactive charts.

  • Cards: Display key metrics such as Total Visits, Active Users, Engagement %, Funds Raised, and Active Campaigns.
  • Charts:
    • Active Count %: Shows the proportion of active users relative to total users, allowing for quick engagement assessment.
    • Total Visits by Region: Visualizes user visit distribution across various geographic areas for strategic planning.
    • Funds Raised by Month: Tracks fundraising progress month-by-month to identify trends and spikes.
    • Active Users by Category: Highlights participation across different user segments or categories.
  • Slicers: Enable quick filtering based on region, campaign type, or date to tailor the analysis.
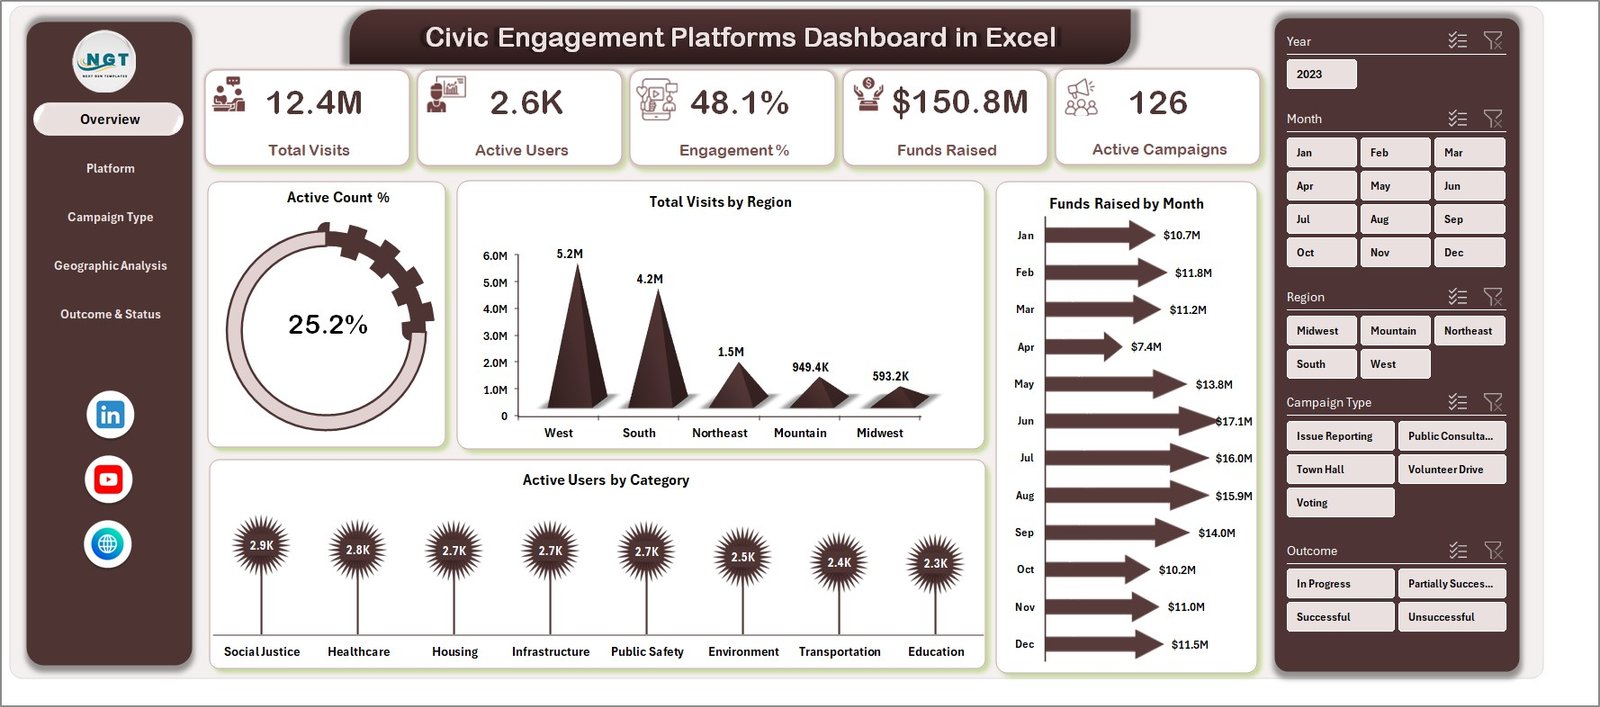
Civic Engagement Platforms Dashboard in Excel

Civic Engagement Platforms Dashboard in Excel

2. Platform Performance

This sheet tab offers detailed performance insights per platform.

  • Total Visits by Platform Name: Analyze the number of visits each platform has received.
  • Volunteers by Platform Name: Track volunteer counts associated with platforms for resource allocation.
  • Active Users by Platform Name: Measure user activity levels per platform.
  • Funds Raised by Platform Name: Monitor fundraising success across platforms.
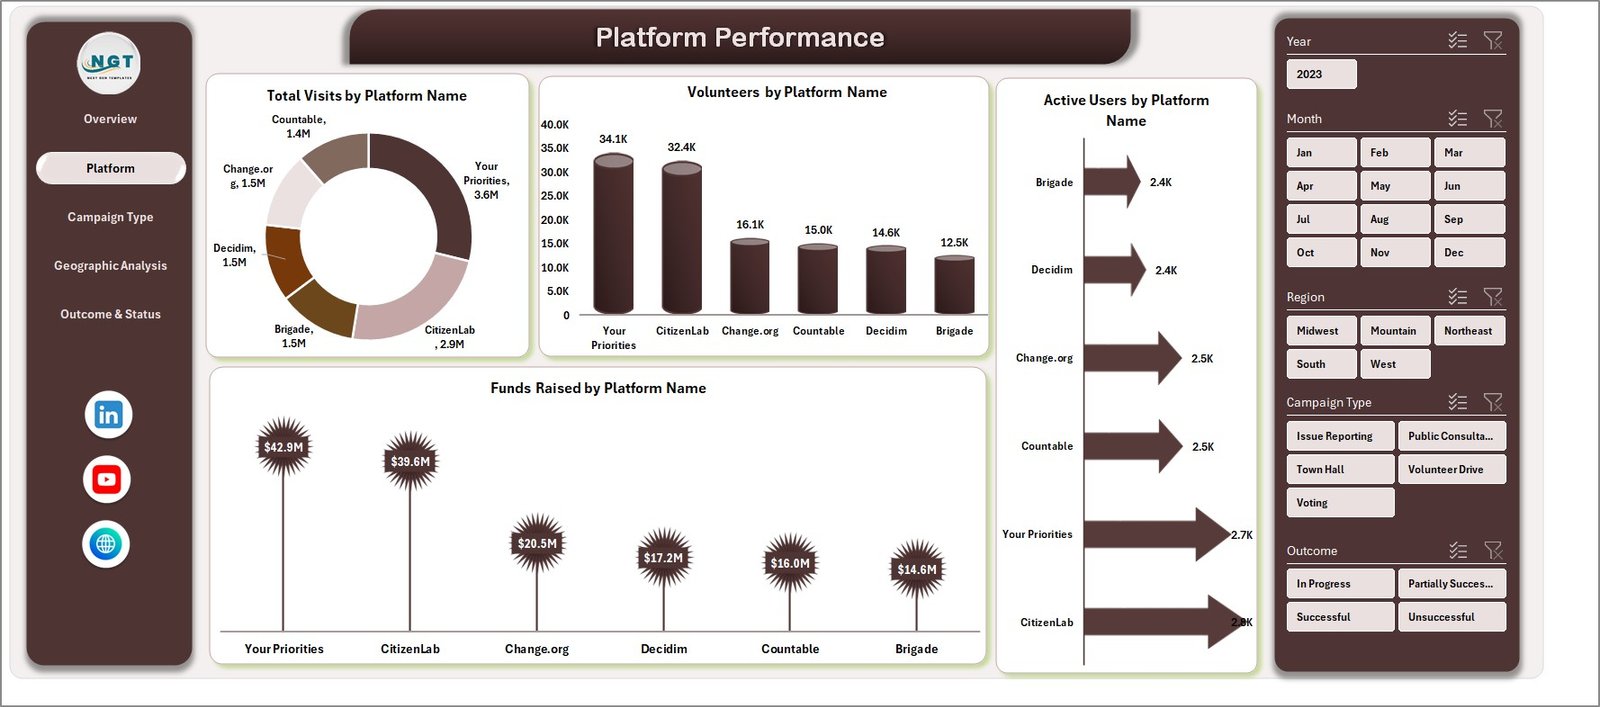
Platform Performance

Platform Performance

3. Campaign Type Analysis

This analysis tab gives deeper insights on campaigns to help evaluate effectiveness and satisfaction.

  • Funds Raised by Campaign: Shows fundraising totals categorized by campaign types.
  • Active Count % by Campaign: Percentage of active users involved in each campaign.
  • Successful Count by Campaign: Number of campaigns marked as successful for assessing outcomes.
  • Avg Satisfaction by Campaign: Measures user satisfaction averages helping improve future campaigns.
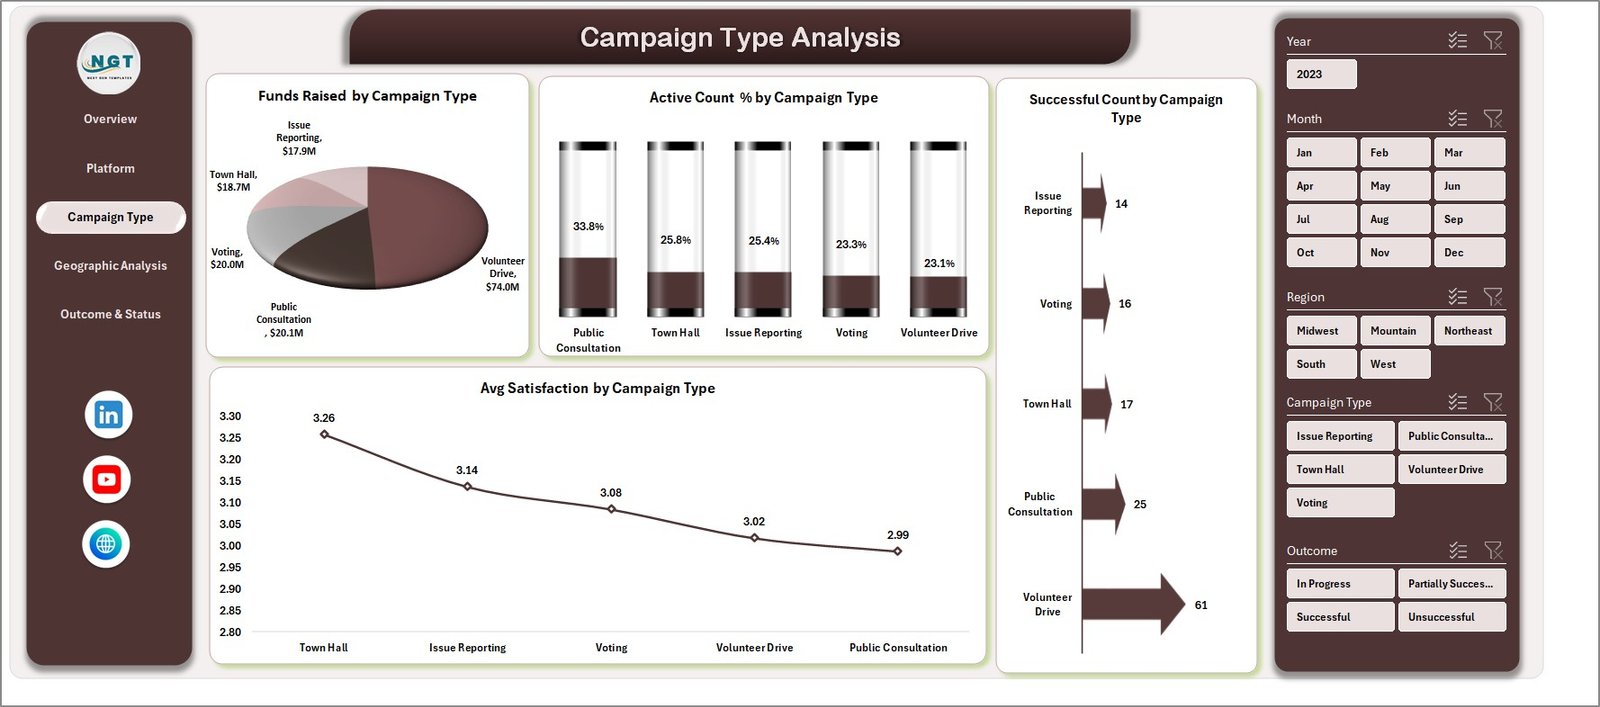
Campaign Type Analysis

Campaign Type Analysis

4. Geographic Analysis

Examine engagement and resource distribution across different regions.

  • Active Campaigns by Region: Number of ongoing campaigns in each geographic area.
  • Engagement % by Region: Engagement levels demonstrating regional participation.
  • Volunteers by Region: Counts of volunteers available by location.
  • Funds Raised by Region: Regional fundraising achievements visualized.
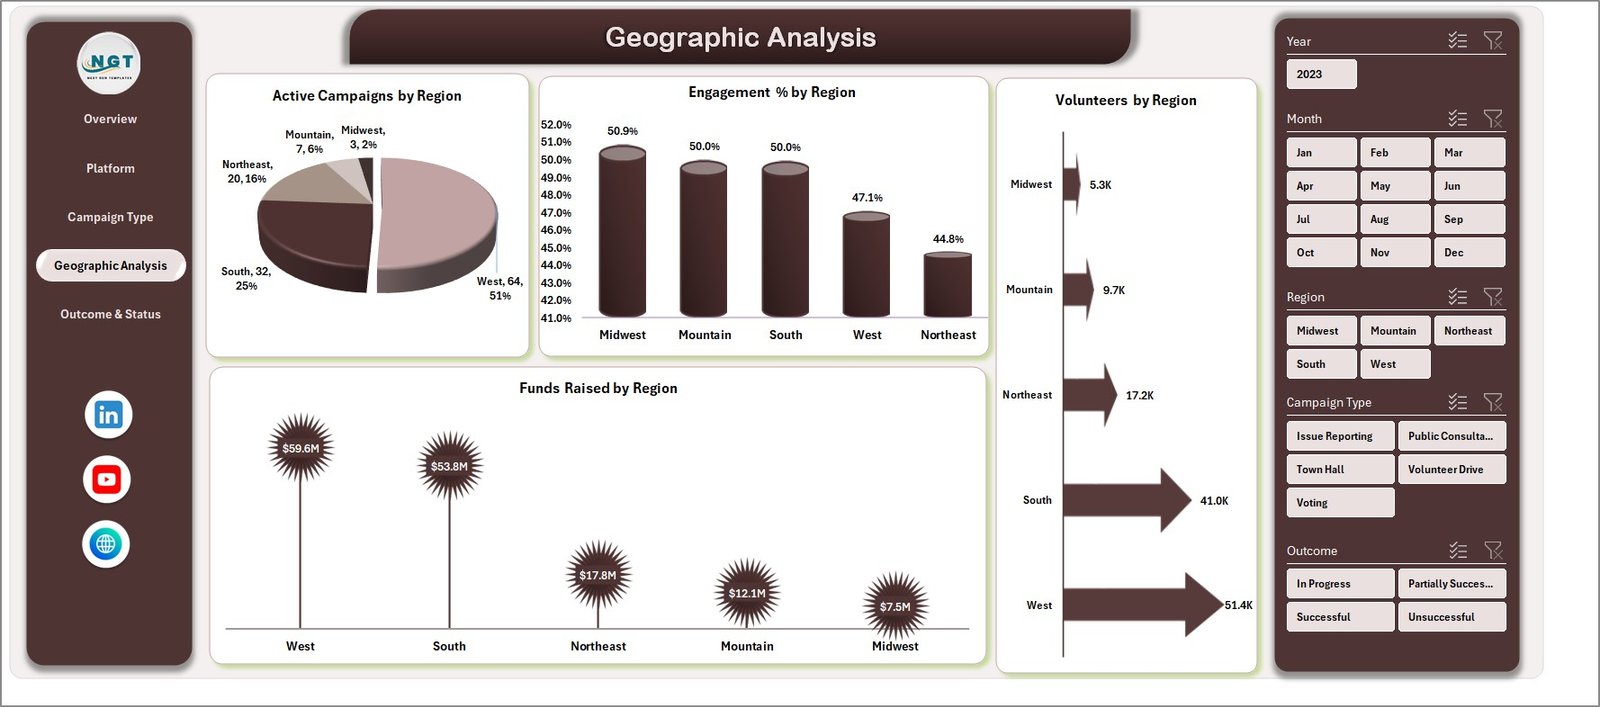
Geographic Analysis

Geographic Analysis

5. Outcome & Status

This page helps track completion statuses and success rates over time.

  • Completed Count by Month: Number of completed campaigns or activities each month.
  • Total Visits by Month: Monthly visits trend to monitor user engagement.
  • Successful Count %: Percentage of successful campaigns relative to total launched campaigns.
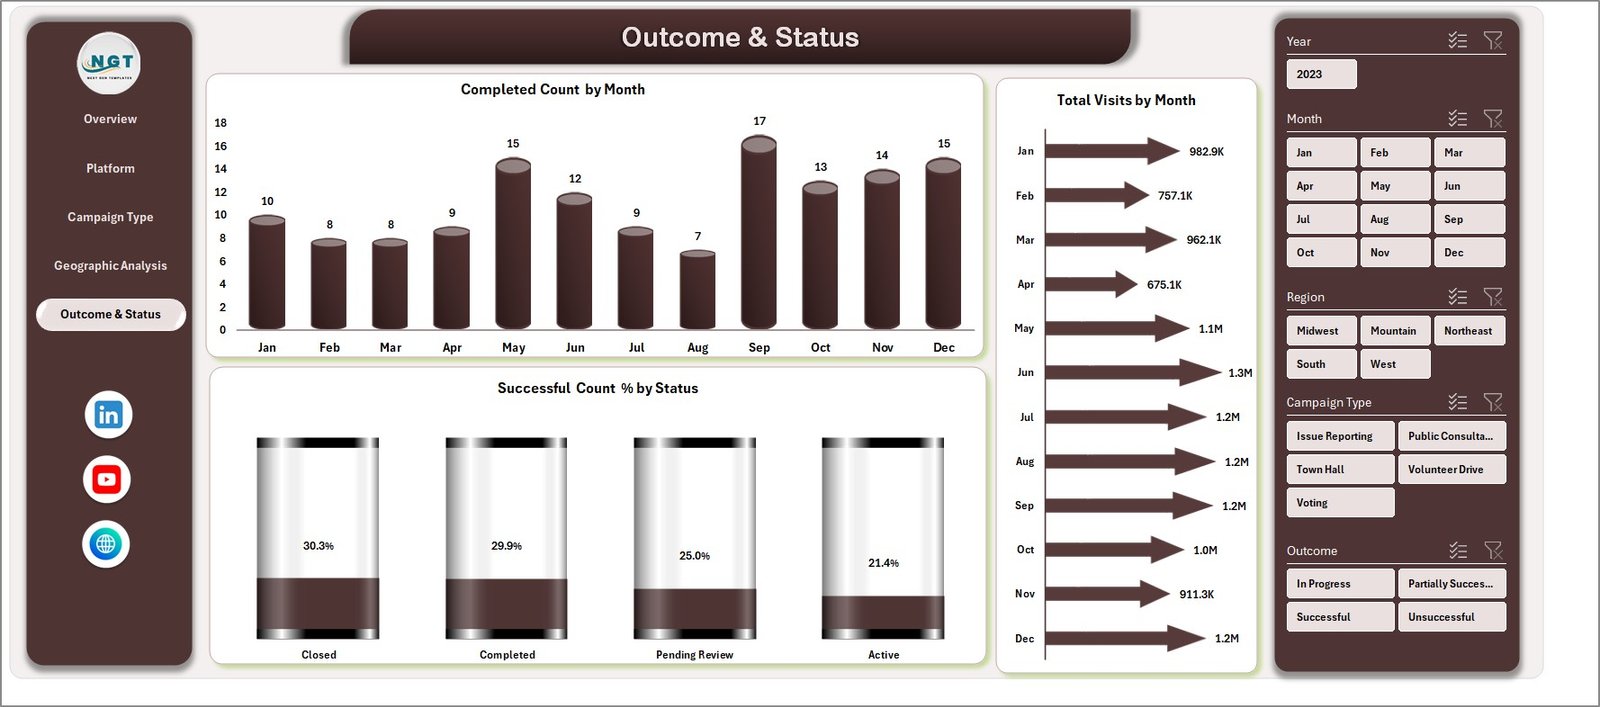
Outcome & Status

Outcome & Status

6. Data Sheet Tab

This is the master data sheet where all raw data is entered in a consistent format. Ensure data accuracy here to maintain dashboard integrity.

Data Sheet tab

Data Sheet tab

7. Support Sheet

This hidden sheet contains pivot tables that power the dashboard’s dynamic charts and metrics. After updating the Data sheet, clicking ‘Refresh All’ under the Data tab instantly updates all dashboard elements.

Support sheet tab

Support sheet tab

Advantages of Civic Engagement Platforms Dashboard in Excel

  • Easy to use: No coding needed-simply update data and refresh.
  • Comprehensive insight: Multi-dimensional analysis across platforms, campaigns, geography, and outcomes.
  • Time-saving: Automated reports eliminate manual chart making and repetitive tasks.
  • Customizable: Add or modify filters, slicers, and charts as per your organizational needs.
  • Wide accessibility: Excel format ensures compatibility across workplaces without specialized software.

Opportunities for Improvement

  • Integrate Power BI for more advanced visualization and interactivity.
  • Add automation scripts (VBA) for auto-refresh on file open.
  • Include predictive analytics to forecast future engagement trends.
  • Expand geographic mapping for detailed district or city-level insights.
  • Enable collaboration via cloud versions like Excel Online.

Best Practices

  1. Maintain data cleanliness and consistency on the Data sheet to avoid errors.
  2. Refresh pivot tables frequently to ensure dashboard reflects latest data.
  3. Use slicers wisely to drill down without overwhelming the visuals.
  4. Back up your Excel file regularly to prevent data loss.
  5. Train team members on how to update the data and refresh the dashboard.

FAQs

Can I customize the dashboard to add more metrics?

Yes, you can add new pivot tables and charts to the Support sheet and link them to your dashboard for more KPIs.

Is it compatible with Excel versions other than Microsoft 365?

The dashboard is compatible with Excel 2016 and above, but some newer features might require Microsoft 365.

How often should I update the data sheet?

Update based on your data collection frequency – weekly or monthly is typical for most civic programs.

Can I share this dashboard with others?

Yes, but ensure they have compatible Excel versions to view and interact with slicers and refresh pivots.

Click to Purchases Civic Engagement Platforms Dashboard in Excel

Conclusion

The Civic Engagement Platforms Dashboard in Excel is an essential tool for organizations aiming to track, analyze, and enhance their civic engagement initiatives effectively. Its user-friendly interface combined with robust analytical capabilities makes it a perfect fit for both beginners and advanced Excel users. By leveraging this dashboard, you can easily monitor key metrics, streamline reporting, and make informed decisions to boost the impact of your campaigns.

Explore further resources and maximize your Excel skills with Microsoft Excel official support.

Visit our YouTube channel to watch the demo: Youtube.com/@NextGenTemplates

Watch the step-by-step video tutorial:

Tagged campaign analysis, Civic Engagement, data analysis, Excel Dashboard, Geographic Analysis, Platform Performance
PK
Meet PK, the founder of PK-AnExcelExpert.com! With over 15 years of experience in Data Visualization, Excel Automation, and dashboard creation. PK is a Microsoft Certified Professional who has a passion for all things in Excel. PK loves to explore new and innovative ways to use Excel and is always eager to share his knowledge with others. With an eye for detail and a commitment to excellence, PK has become a go-to expert in the world of Excel. Whether you're looking to create stunning visualizations or streamline your workflow with automation, PK has the skills and expertise to help you succeed. Join the many satisfied clients who have benefited from PK's services and see how he can take your Excel skills to the next level!
https://www.pk-anexcelexpert.com

Related Articles

Dashboard Power BI

Footwear Manufacturing KPI Dashboard in Power BI

February 24, 2026February 24, 2026 PK
The footwear manufacturing industry operates in a highly competitive and fast-moving environment. Manufacturers must manage production efficiency, quality control, labor
Dashboard Templates

Interior Fit-Out KPI Dashboard in Excel

September 16, 2026September 16, 2026 PK
The Interior Fit-Out KPI Dashboard in Excel tracks 15 fit-out KPIs across 5 KPI groups on 11 worksheets, and ships
Dashboard Power BI

Skill Development Missions KPI Dashboard in Power BI

January 7, 2026January 7, 2026 PK
Skill development missions play a vital role in building a future-ready workforce. Governments, training institutions, and development agencies invest heavily

Post navigation

Cardiology Institutes Dashboard in Excel
Carbon Capture Firms Dashboard in Power BI

Join Our Course

  • Excel Pivot Tables for Data Analysis

Top Categories

  • Blogs (68)
  • Charts and Visualization (158)
  • Dashboard (3,154)
  • Excel Tips and Tricks (203)
  • Power BI (1,549)
  • Power Pivot (123)
  • Power Point Visualization (4)
  • Power Query (3)
  • Predictive Analytics (5)
  • Productivity (2)
  • Templates (2,248)
  • VBA (372)

Latest Articles

Employee Attendance Tracker in Excel 2026: Step by Step (Free Template)

November 9, 2026 PK

Accounts Receivable Aging Dashboard in Power BI: AR Aging and DSO

November 8, 2026 PK

Speedometer Chart in Excel: KPI Gauge Step by Step (Free Template)

November 6, 2026 PK

13-Week Cash Flow Forecast in Excel (Free Template)

November 5, 2026 PK

Gantt Chart in Excel 2026 Step by Step (Free Template)

November 2, 2026 PK

Popular Articles

Port Project Management KPI Dashboard in Power BI

December 25, 2025December 25, 2025 PK

TV Channels KPI Dashboard in Power BI

January 2, 2026January 2, 2026 PK

Social Services KPI Dashboard in Excel

November 12, 2024February 18, 2025 PK

Open Universities Dashboard in Power BI

November 21, 2025November 21, 2025 PK

Cross-Selling KPI Dashboard in Excel

February 15, 2025April 6, 2025 PK

Learn More

  • Free Excel Course
  • VBA Course
  • Excel Dashboards
  • Charts and Visualization
  • VBA Tutorials
  • Excel Tips and Tricks
  • Power BI Tutorials
  • Courses

Subscribe to our Newsletter


Free Excel Course

  • 1. Shortcut Keys
  • 2. Fill and Flash Fill
  • 3. Find and Replace
  • 4. Sort and Filter
  • 5. Formulas and Functions
  • 6. Data Validation
  • 7. Conditional Formatting
  • 8. Basic Charts
  • 9. Advanced Charts
  • 10. Pivot Tables
  • 11. Excel Dashboards
  • 12. VBA Course
  • 13. Excel Formulas with AI

See the full learning path →

Popular Tags

Business Analytics business intelligence checklist template data analysis Data Analytics Data Entry data entry excel Data Entry form Data Entry form in VBA Data visualization Event Management Excel excel-kpi-template Excel calendar Excel Calendar Template excel checklist Excel Dashboard Excel dashboard template Excel KPI Dashboard Excel reporting Excel Template Excel Templates Excel Tips Excel Tutorial healthcare analytics HR Analytics KPI Dashboard KPI dashboard Excel KPI tracking MTD YTD analysis MTD YTD dashboard MTD YTD KPIs performance dashboard Performance Metrics performance tracking Power BI Power BI dashboard Power BI KPI Dashboard Power BI Reporting Power BI reports Power BI Template Power BI Templates Project Management Task Management VBA
  • Learn Excel (Free Course)
    • 1. Shortcut Keys
    • 2. Fill & Flash Fill
    • 3. Find & Replace
    • 4. Sort & Filter
    • 5. Formulas & Functions
    • 6. Data Validation
    • 7. Conditional Formatting
    • 8. Basic Charts
    • 9. Advanced Charts
    • 10. Pivot Tables
    • 11. Excel Dashboards
    • 12. VBA Course
    • 13. Excel Formulas with AI
  • Templates
  • Tutorials
    • Charts and Visualization
    • VBA
    • Excel Tips and Tricks
    • Excel Dashboards
    • Power Pivot & DAX
  • Power BI
  • Template Store
    • Ready to Use Templates
  • Courses
  • Academy
    • Excel + AI Mastery: 100 Formulas
    • Excel Pivot Tables & Dashboards
  • About Us
  • Contact Us
Copyright © 2023 PK-AnExcelExpert.com - Privacy Policy