The Hotel Revenue RevPAR Dashboard in Excel turns hotel booking and revenue records into a 7-sheet Excel reporting system with 5 executive KPI cards, 18 charts, slicers, a data sheet, and a pivot support sheet. For hotel teams, RevPAR, occupancy, room revenue, F&B revenue, operating cost, booking channel mix, and guest satisfaction are too important to sit in separate spreadsheets. This workbook brings those views together so a revenue manager, general manager, owner, or consultant can update the data, refresh all pivots, and review performance in one place.
RevPAR, short for Revenue Per Available Room, is one of the most common hotel revenue-management metrics. Microsoft Excel remains a practical tool for this kind of analysis because teams can use formulas, tables, slicers, and PivotTables without paying for a new cloud platform. Microsoft also documents Excel data validation and table features for structured workbooks here: Microsoft Excel support.
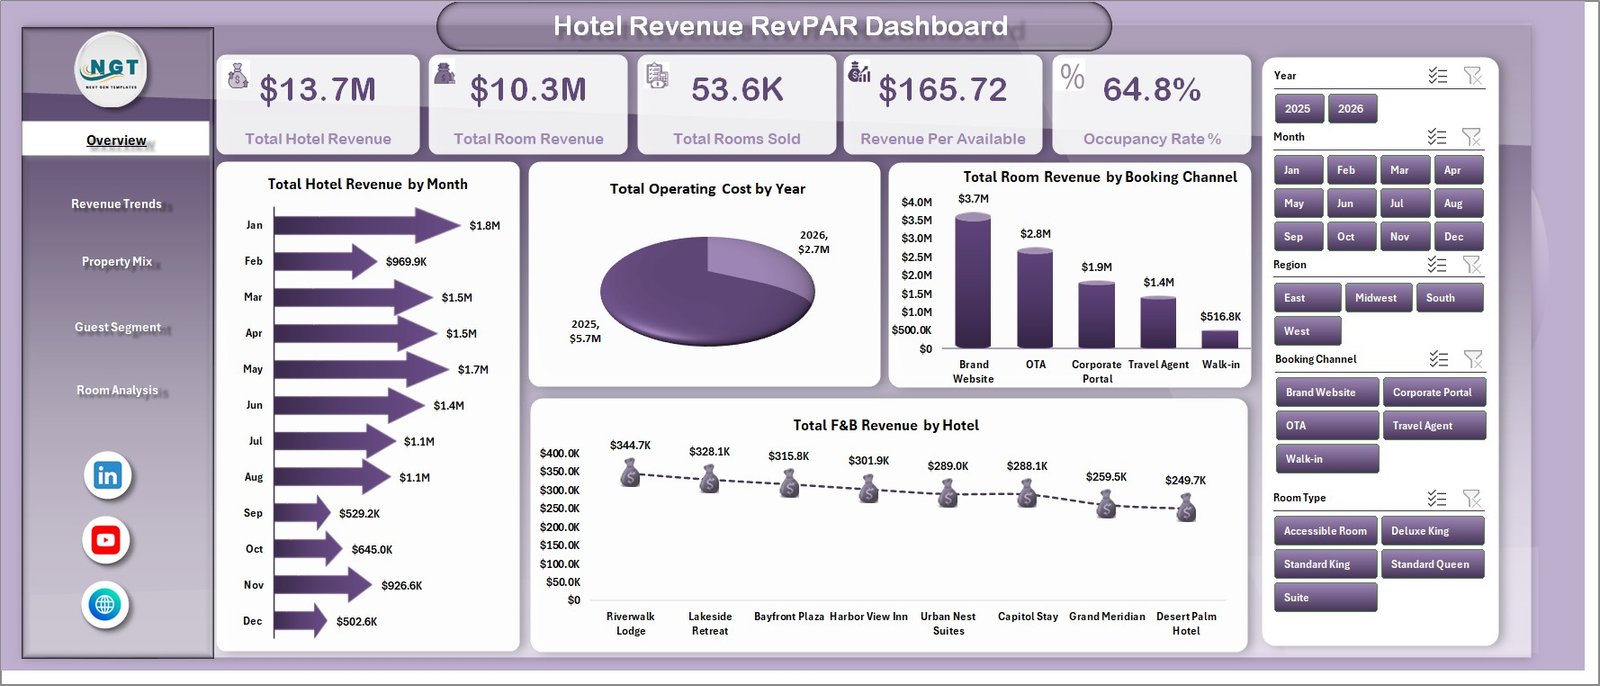
Key Features of Hotel Revenue RevPAR Dashboard in Excel
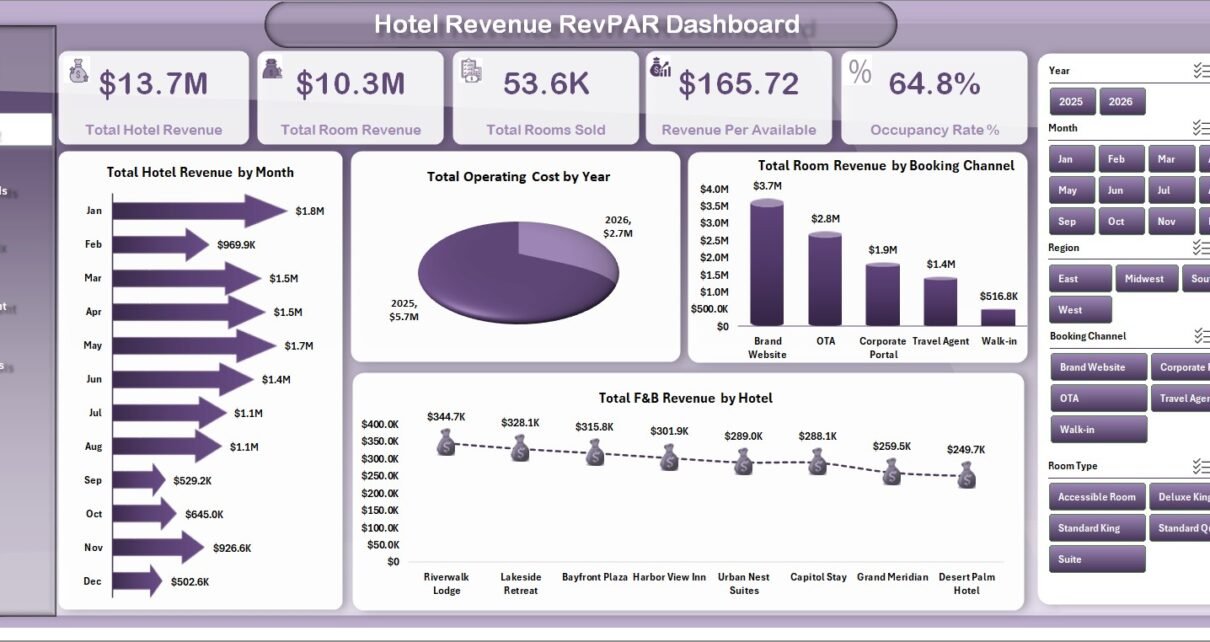
- 5 KPI cards – Total Hotel Revenue, Total Room Revenue, Total Rooms Sold, Revenue Per Available Room, and Occupancy Rate % are visible at the top of the Overview page.
- 18 chart views – The workbook covers revenue, operating cost, booking channel, F&B, gross profit, property mix, guest segment, booking status, room type, and satisfaction analysis.
- Multiple slicers – Filter the dashboard quickly by hotel, location, room, channel, guest, property, or booking attributes depending on the available data fields.
- Data sheet included – Replace the sample hotel records with your own data in the same format.
- Pivot-based support sheet – The Support tab stores the pivot tables used to drive the dashboard visuals and can be hidden from end users.
- Excel refresh workflow – After updating data, go to the Data tab in Excel and click Refresh All.
Dashboard Pages Explanation
1. Overview Page
The Overview page is the executive snapshot of the workbook. It begins with cards for Total Hotel Revenue, Total Room Revenue, Total Rooms Sold, Revenue Per Available Room, and Occupancy Rate %. These cards help a manager see whether the business is growing, filling rooms, and converting available capacity into revenue.
The Total Hotel Revenue by Month chart shows seasonality and month-to-month revenue movement. Total Operating Cost by Year helps management compare cost pressure over longer periods. Total Room Revenue by Booking Channel identifies which channels are driving room sales, while Total F&B Revenue by Hotel shows which properties are strongest in food and beverage revenue.
Hotel Revenue RevPAR Dashboard in Excel
2. Revenue Trends
The Revenue Trends sheet is designed for finance and revenue teams that want to understand where profit and revenue are moving. Total F&B Revenue by Quarter highlights quarterly food and beverage contribution, which is useful for restaurants, banquets, and seasonal hotel events.
Gross Profit Amount by Hotel compares property-level profitability, while Total Hotel Revenue by Revenue Band groups properties or records into revenue ranges. Gross Profit Amount by Month adds a time trend so managers can see whether margin is improving or shrinking across the year.
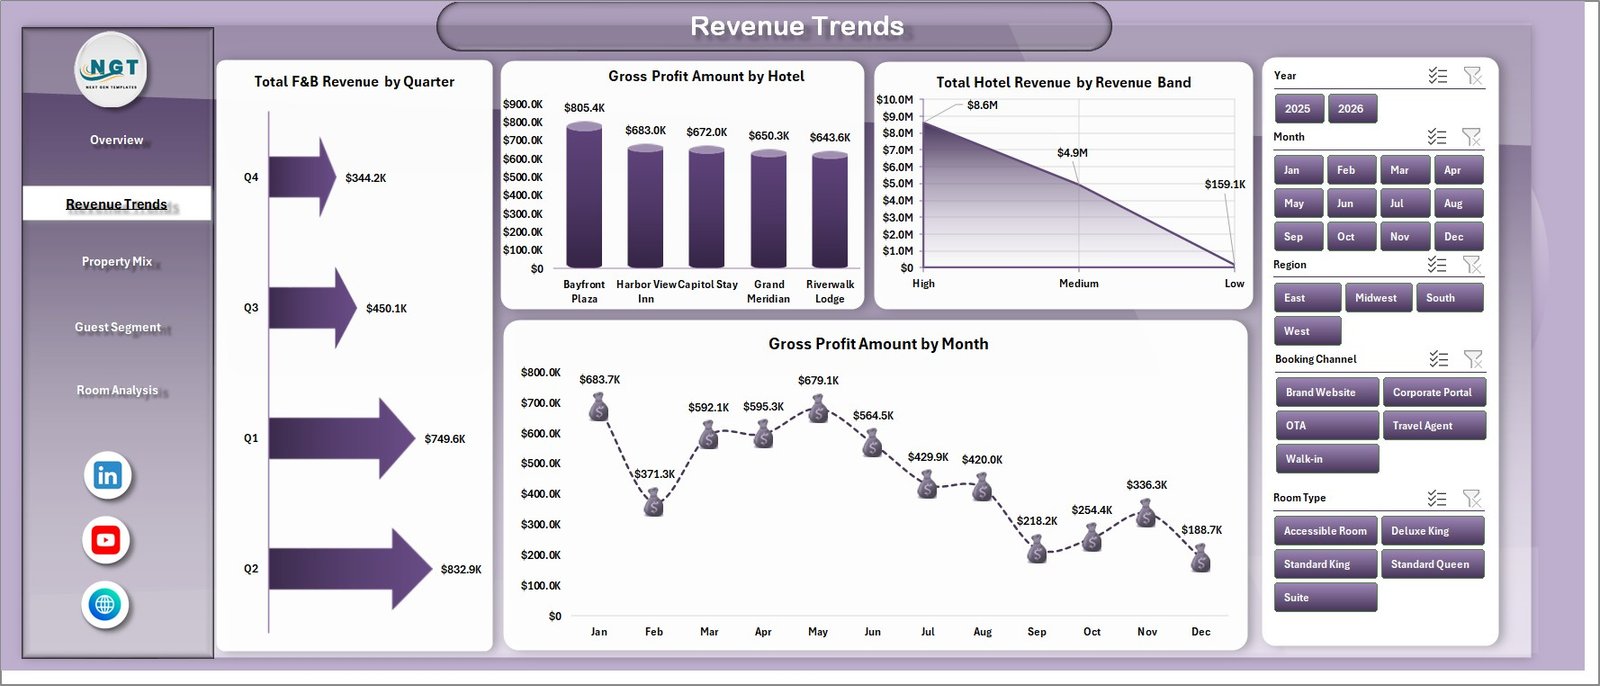
Revenue Trends
3. Property Mix
The Property Mix page compares hotel performance through region, city, property type, and guest segment. Total Operating Cost by Region helps identify where costs are heavier, which can support staffing, energy, maintenance, or procurement reviews.
Total Room Revenue by City shows which locations produce the most room income. Total Hotel Revenue by Property Type is useful for comparing resorts, business hotels, boutique properties, or other property classes. Total Operating Cost by Guest Segment helps teams connect cost behavior to customer mix.
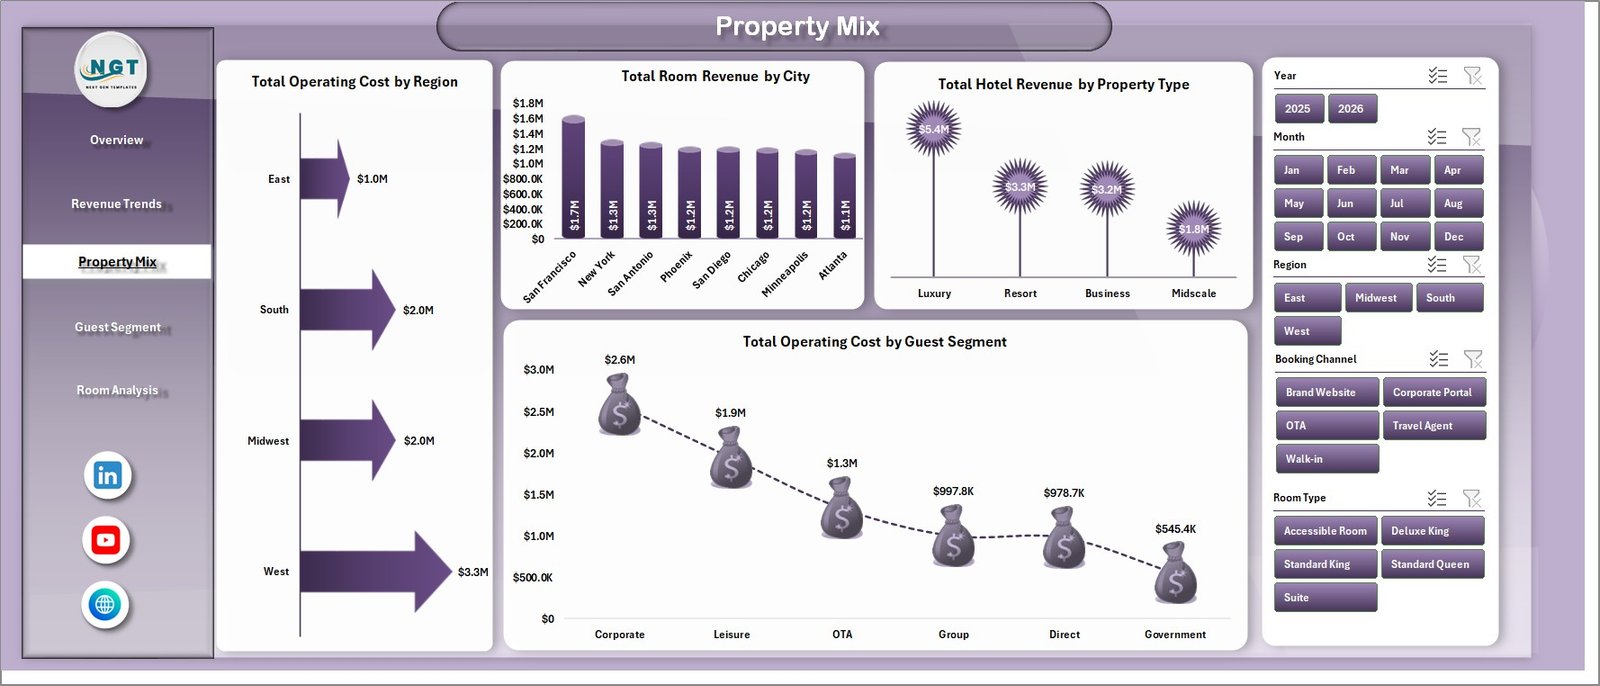
Property Mix
4. Guest Segment
The Guest Segment sheet looks at how channels, rate plans, booking status, and room types affect revenue and occupancy. Occupancy Rate % by Booking Channel helps compare channel quality, not just booking volume.
Total Room Revenue by Rate Plan shows which pricing plans produce the strongest room income. Total Records by Booking Status gives a quick operational view of confirmed, cancelled, completed, or other booking states. Revenue Per Available Room by Room Type is one of the most useful views for revenue management because it connects room category and available-room monetization.
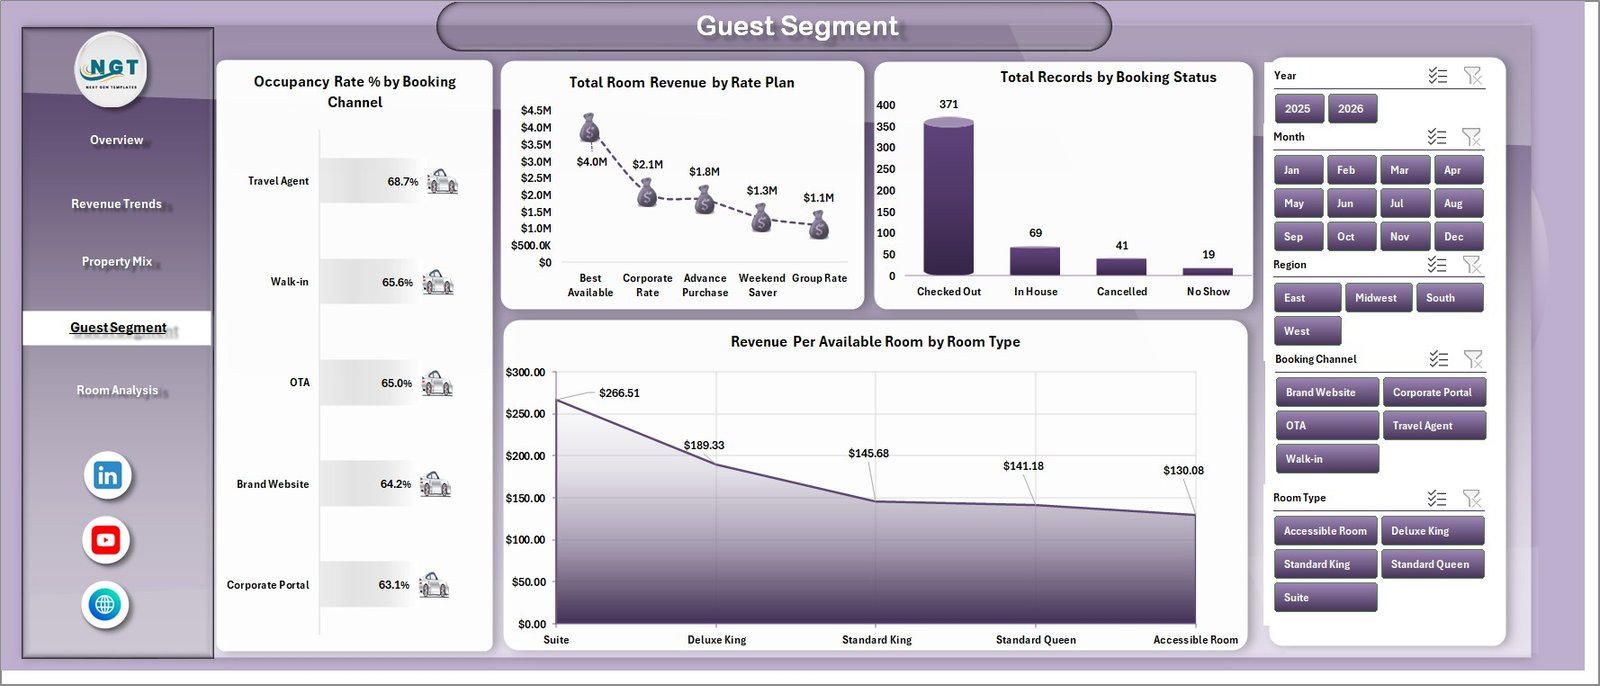
Guest Segment
5. Room Analysis
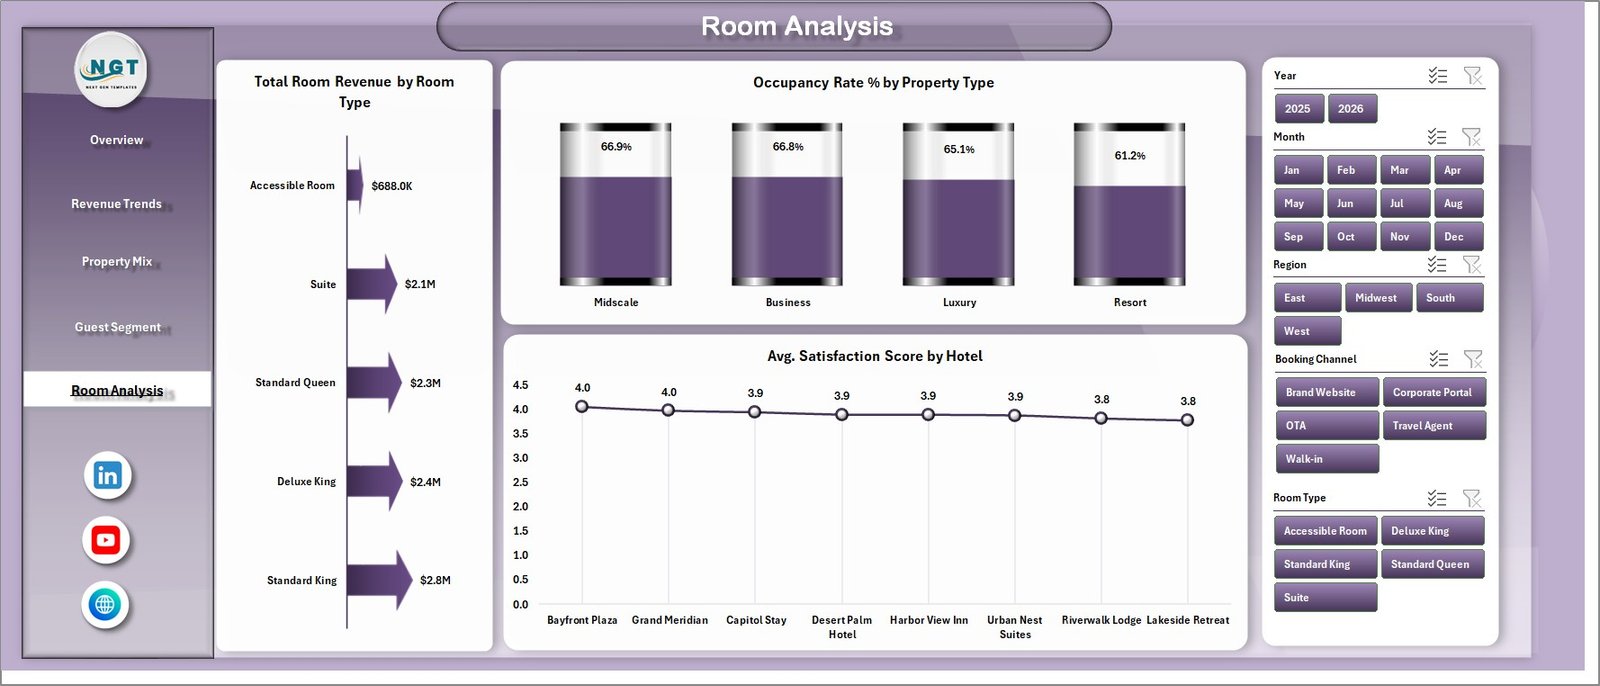
The Room Analysis page focuses on room-level and property-level performance. Total Room Revenue by Room Type helps managers understand whether premium rooms, standard rooms, suites, or other categories are driving revenue.
Occupancy Rate % by Property Type compares utilization across property formats. Avg. Satisfaction Score by Hotel keeps guest experience visible beside financial metrics, which matters because high RevPAR with falling satisfaction may not be sustainable.
Room Analysis
6. Data Sheet Tab
The Data sheet is where users add or replace records in the same format as the sample data. Keep the column structure consistent so the PivotTables, slicers, formulas, and charts continue to work correctly.

Data Sheet tab
7. Support Sheet
The Support sheet contains the pivot tables that create the dynamic dashboard. After updating the Data sheet, go to the Data tab in the Excel Ribbon and click Refresh All. All pivots and charts will refresh. You can keep this sheet hidden after setup.

Support sheet tab
Hotel Revenue RevPAR Dashboard in Excel vs. Google Sheets vs. Paid Hotel BI SaaS – Feature Comparison
| Feature | Hotel Revenue RevPAR Dashboard in Excel | Google Sheets dashboard | Paid hotel BI SaaS |
|---|---|---|---|
| Cost | $17.99 sale price | Free if you build it | Monthly software cost |
| Platform | Microsoft Excel | Browser spreadsheet | Cloud platform |
| Setup time | Paste data and refresh | Build formulas, charts, and filters | Vendor setup and integration |
| RevPAR views | Included by room type | Custom build required | Usually included |
| Real-time collaboration | Limited unless shared through OneDrive | Strong | Strong |
| Mobile access | Limited | Good | Good |
| Customizable fields | Workbook is editable | Editable | Depends on plan |
| Year-1 cost at 5 users | $17.99 one time | $0 plus build time | Can reach hundreds or thousands |
Who Should Use This Template
This template is useful for hotel general managers, revenue managers, owners, hospitality analysts, finance managers, hotel consultants, and multi-property teams that already work in Excel. It is especially helpful when you want a fast way to show room revenue, RevPAR, occupancy, F&B revenue, operating cost, and property mix without building a model from scratch.
It is not a replacement for a property management system. If you need live PMS integration, OTA/channel-manager syncing, automated rate changes, guest messaging, payment processing, or real-time multi-user workflows, you should use a dedicated hospitality platform.
Real-World Use Cases
Ana, revenue manager for a boutique group, uses the dashboard every Monday to compare RevPAR by room type and see whether high-occupancy channels are also producing strong room revenue.
Rahul, finance manager at a resort, checks gross profit by hotel and operating cost by region before monthly leadership meetings.
Melissa, hospitality consultant, loads each client export into the Data sheet to prepare a quick discovery report covering revenue, F&B, occupancy, and satisfaction.
Advantages of Hotel Revenue RevPAR Dashboard in Excel
- Fast reporting – You do not need to design the dashboard from zero.
- Revenue-management focus – RevPAR, occupancy, room revenue, and rate-plan views are built into the story.
- Excel ownership – You can edit formulas, fields, layouts, colors, and charts as needed.
- Low cost – One-time purchase pricing makes it easier for smaller properties to use structured reporting.
- Management-ready visuals – The workbook can support owner meetings, monthly reviews, and consulting presentations.
Opportunities for Improvement
The dashboard is intentionally Excel-based, so it has normal spreadsheet limits. It does not connect live to a PMS, does not write back to booking systems, and does not automatically enforce data quality. Users should keep source data clean, preserve column names, and refresh pivots after every update. For teams with several users editing at once, a Google Sheets or web-app system may be a better operational fit.
Best Practices
- Keep one clean source export from your PMS or booking file.
- Do not change the Data sheet column structure unless you also update the supporting pivots.
- Refresh all PivotTables after every data update.
- Review RevPAR beside occupancy so you do not mistake low-rate high-occupancy volume for healthy performance.
- Use booking channel and rate-plan charts together to identify profitable demand sources.
- Hide the Support sheet after validation to keep the workbook easier for managers to use.
Explore Relevant Templates
- Hotel Revenue RevPAR Dashboard in Excel – the product draft for this workbook.
- Hotel and Hospitality Revenue Dashboard in Excel – related Excel hospitality revenue reporting.
- Hotel and Hospitality Revenue Dashboard in HTML – browser-based hotel revenue dashboard.
- Hotel Chains KPI Dashboard in Excel – KPI tracking for multi-property hotel groups.
- Web App Based Hotel Booking Management System – operational booking workflow in a web app.
Frequently Asked Questions
What is the main purpose of this dashboard?
The main purpose is to analyze hotel revenue, room revenue, RevPAR, occupancy, F&B revenue, operating cost, property mix, guest segments, and room performance in Excel.
Can I use my own hotel data?
Yes. Add your records in the Data sheet using the same format as the sample data, then refresh all pivots and charts.
Does the dashboard calculate RevPAR?
Yes. Revenue Per Available Room is included as a KPI and is also analyzed by room type on the Guest Segment page.
Can I use it for multiple hotels?
Yes. The workbook includes hotel, region, city, and property-type analysis, so it can support multi-property reporting if your data includes those fields.
Do I need advanced Excel skills?
No. Basic Excel skills are enough for normal use. Advanced users can customize pivots, slicers, and charts further.
Is this connected to live booking systems?
No. It is a standalone Excel dashboard. Export data from your PMS or booking system, paste it into the Data sheet, and refresh the workbook.
About the Author
Built by PK – Microsoft Certified Professional with 15+ years of Excel, Google Sheets, and Power BI experience. Founder of NextGenTemplates, reaching 300K+ subscribers across YouTube channels. Every template is hand-built and tested before release.
Conclusion
The Hotel Revenue RevPAR Dashboard in Excel is a practical reporting workbook for hotel teams that need clear revenue, occupancy, RevPAR, property, guest, and room analysis without moving into a new software platform. It is easy to update, built around familiar Excel features, and structured for fast management review.
Visit our YouTube channel to learn step-by-step video tutorials: Youtube.com/@PKAnExcelExpert