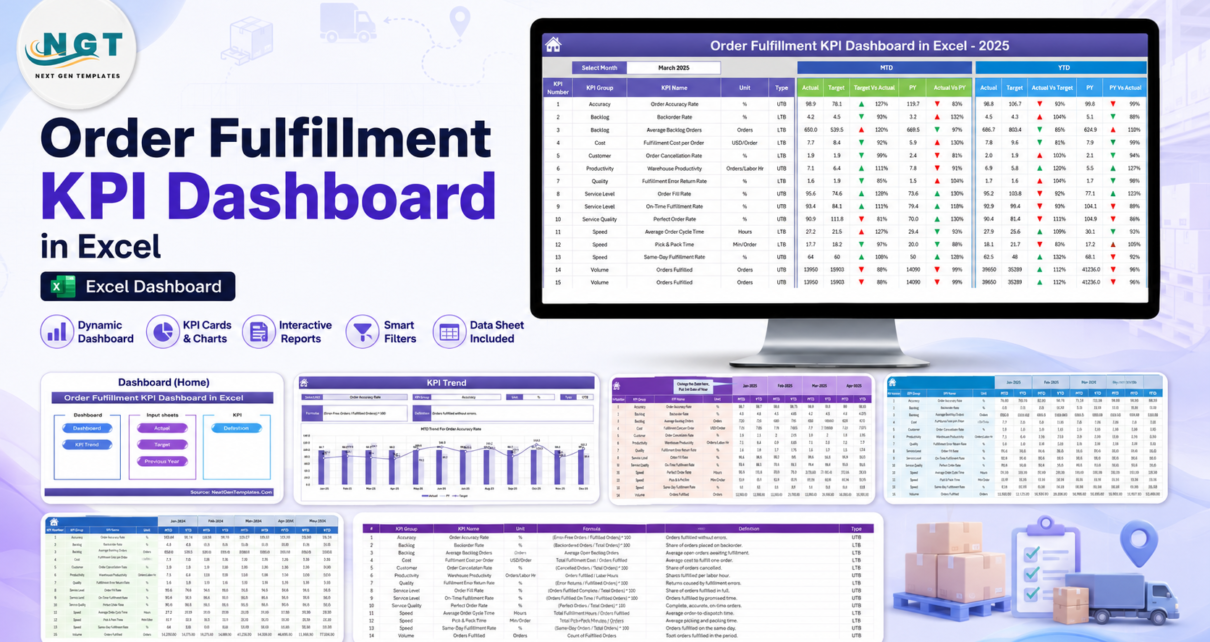
Order fulfillment reporting often breaks down for a simple reason: the data exists, but the monthly KPI view is rebuilt by hand. The Order Fulfillment KPI Dashboard in Excel gives fulfillment, warehouse, e-commerce, and logistics teams a ready workbook for tracking month-to-date and year-to-date performance against targets and previous-year numbers. Instead of maintaining separate files for Actuals, Targets, Previous Year, and KPI definitions, this template keeps the full KPI workflow in one Excel dashboard.
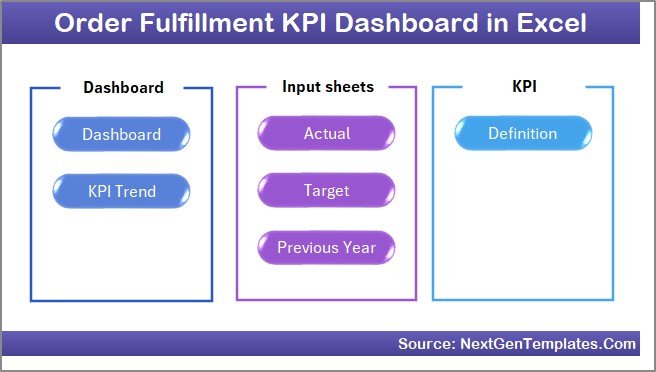
Order Fulfillment KPI Dashboard in Excel
The workbook includes 7 worksheets: Home, Dashboard, KPI Trend, Actual Numbers Input, Target, Previous Year Number, and KPI Definition. It is designed for teams that already track fulfillment numbers in Excel and want a cleaner way to review service levels, backlog, picking accuracy, dispatch speed, target variance, and year-over-year movement.
Key Features of Order Fulfillment KPI Dashboard in Excel
- 7 worksheet tabs for navigation, dashboard reporting, trend review, inputs, targets, previous-year values, and KPI definitions.
- Month selector on the Dashboard sheet, so the dashboard changes for the selected reporting month.
- MTD and YTD views for Actual, Target, and Previous Year data.
- Target vs Actual and PY vs Actual comparisons with conditional formatting arrows.
- KPI Trend page with selected KPI details, formula, definition, and trend charts.
- Editable input model so teams can replace sample numbers with their own monthly KPI values.
- Definition sheet to document KPI name, KPI group, unit, formula, definition, and KPI type.
Dashboard Pages Explanation
1. Home Sheet
The Home sheet works as the workbook index. It contains 6 navigation buttons that let users move directly to the Dashboard, KPI Trend, Actual Numbers Input, Target, Previous Year Number, and KPI Definition sheets. This is useful when the file is shared with managers who do not want to scroll through tabs manually.
Home Sheet
2. Dashboard Sheet
The Dashboard sheet is the main reporting view. In cell D3, users select the reporting month from a dropdown. The dashboard then updates the MTD Actual, Target, Previous Year, Target vs Actual, and PY vs Actual values for all fulfillment KPIs. It also shows YTD Actual, Target, Previous Year, and variance indicators, giving managers both short-term and cumulative performance in one place.
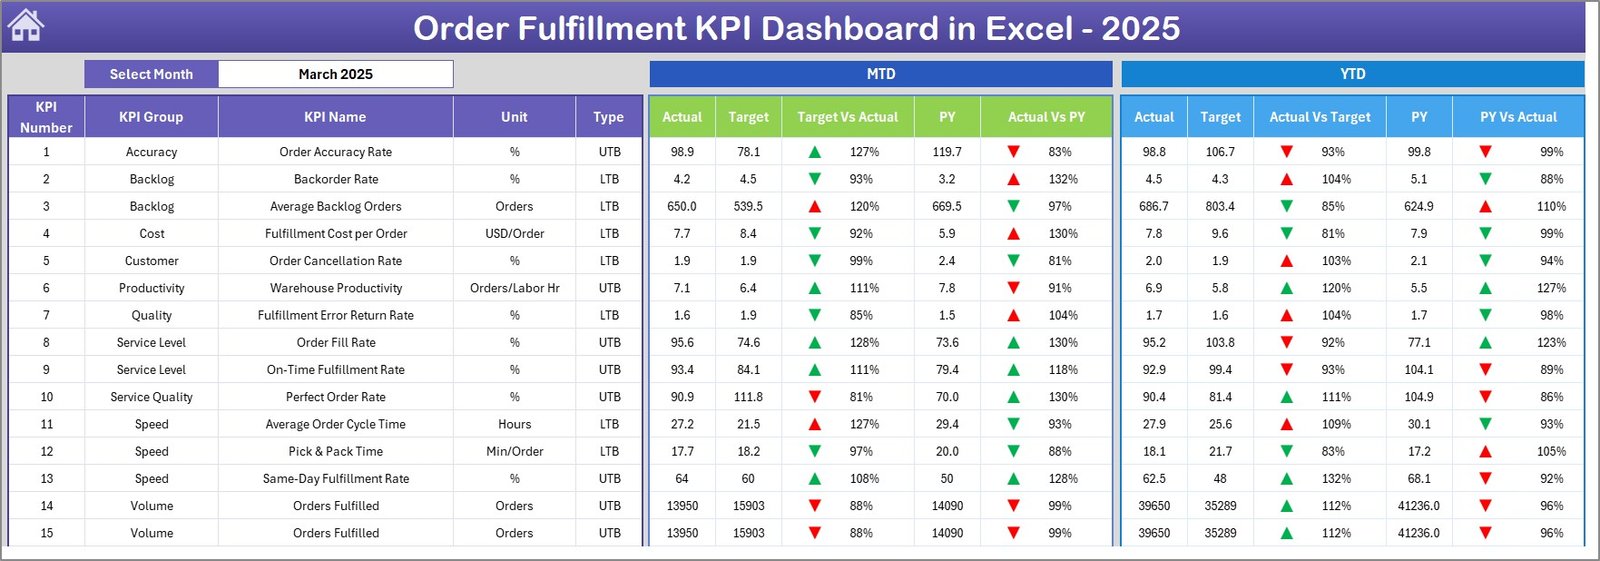
Dashboard Sheet
3. KPI Trend Sheet
The KPI Trend sheet is built for deeper review of one KPI at a time. Select the KPI name from the dropdown in cell C3, and the sheet displays KPI Group, Unit, KPI Type, Formula, and Definition. It also shows MTD and YTD trend charts for Actual, Target, and Previous Year values. This helps users explain whether a KPI is improving, falling behind, or moving differently from last year.
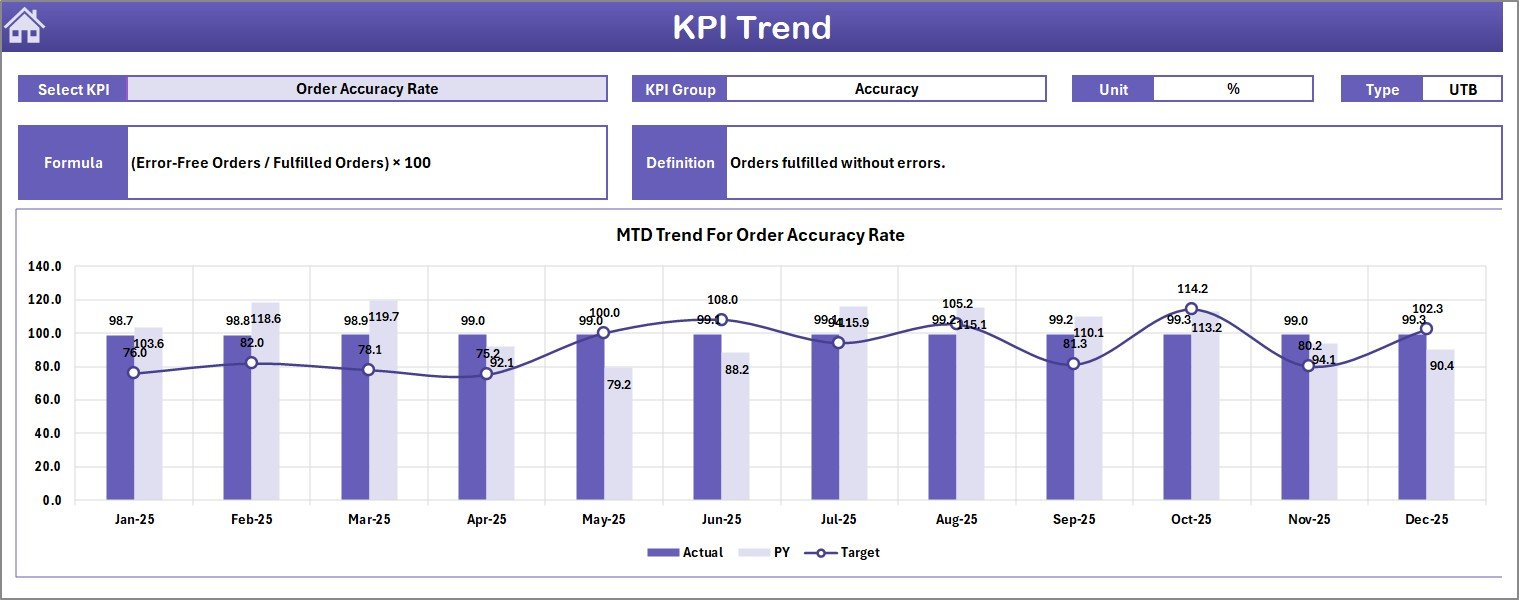
KPI Trend Sheet
4. Actual Numbers Input Sheet
The Actual Numbers Input sheet is where users enter current-year MTD and YTD values. You can change the first month of the year from cell E1, then continue entering monthly actuals in the provided structure. This makes the dashboard practical for financial-year and calendar-year reporting.
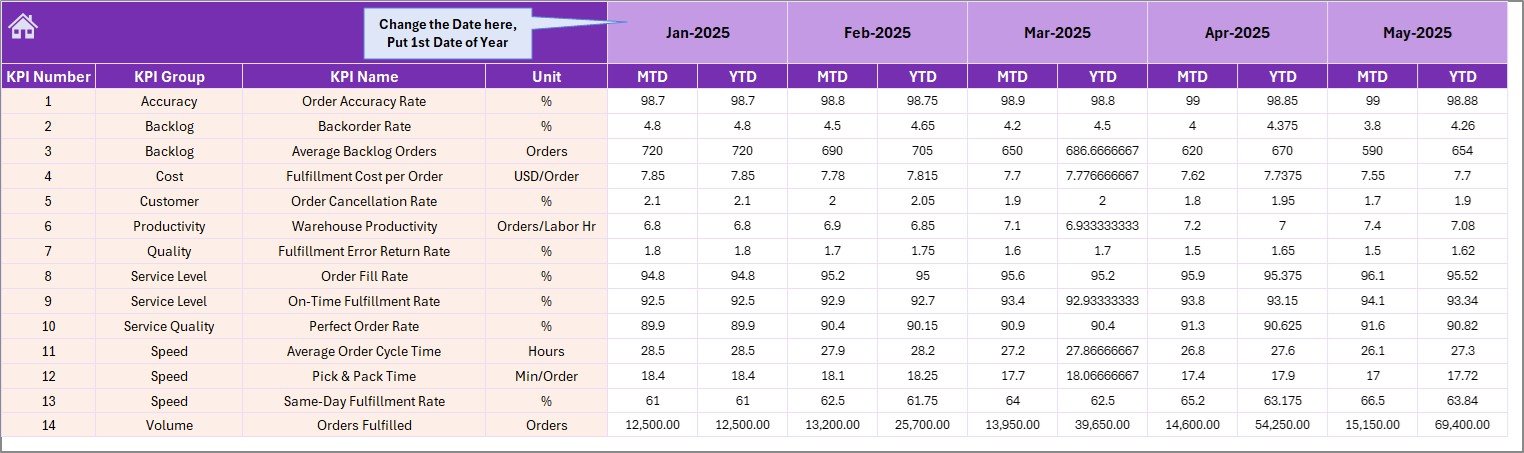
Actual Numbers Input Sheet
5. Target Sheet
The Target sheet stores monthly MTD and YTD targets for each KPI. These targets feed the dashboard’s Target vs Actual comparison columns. For fulfillment teams, this is where planned service levels, processing speed targets, backlog targets, or accuracy thresholds can be entered.
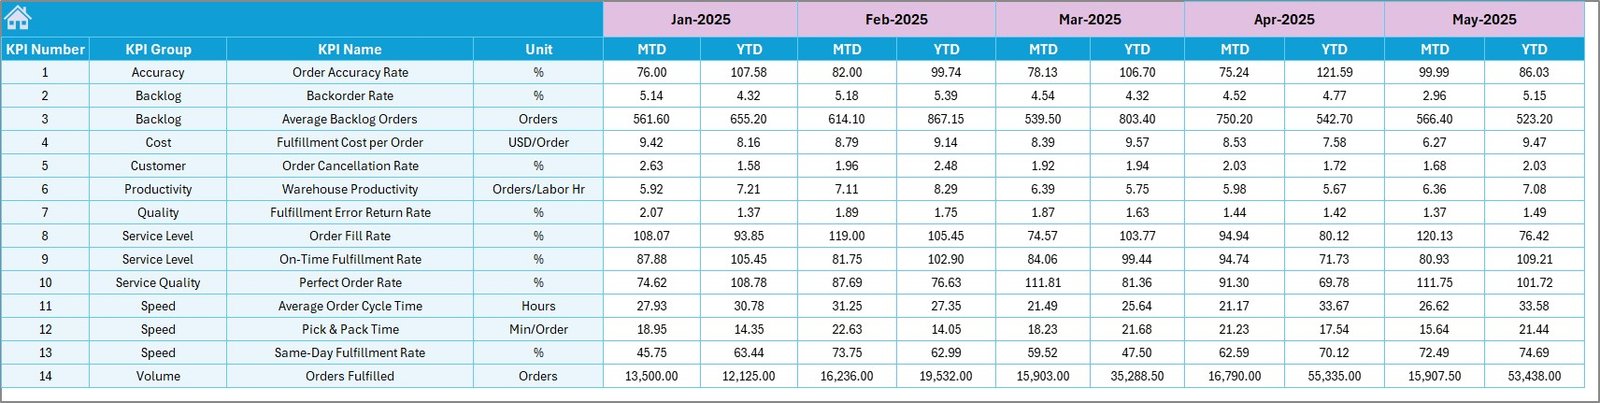
Target Sheet
6. Previous Year Number Sheet
The Previous Year Number sheet stores prior-year MTD and YTD values in the same monthly structure. This allows the dashboard to compare current performance against last year’s baseline, which is useful for seasonal fulfillment environments where order volume changes throughout the year.
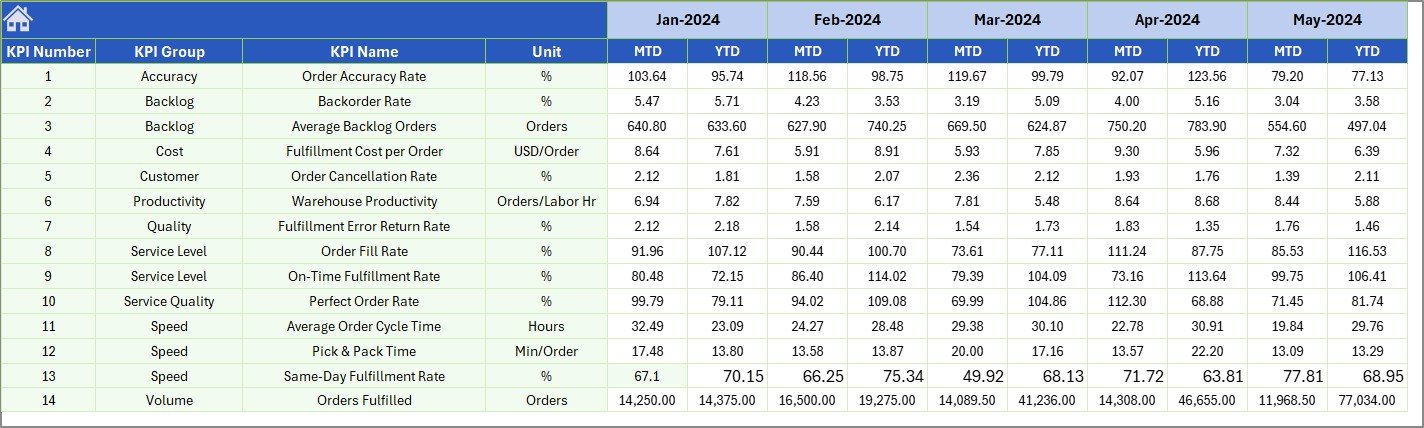
Previous Year Number Sheet
7. KPI Definition Sheet
The KPI Definition sheet is the workbook’s reference library. Add KPI Name, KPI Group, Unit, Formula, and KPI Definition. You can also define whether a KPI is Upper the Better or Lower the Better, so dashboard indicators make sense for both positive and negative metrics.

KPI Definition Sheet
Order Fulfillment KPI Dashboard in Excel vs. Google Sheets vs. Paid CRM/SaaS – Feature Comparison
| Feature | This Excel dashboard | Google Sheets alternative | Paid fulfillment SaaS |
|---|---|---|---|
| Cost | $12.99 one-time sale price | Template cost or manual build | Monthly or annual subscription |
| Platform | Microsoft Excel | Browser spreadsheet | Vendor-hosted app |
| Setup time | Enter KPI values and select month | Similar if prebuilt | Implementation and onboarding |
| Real-time team collaboration | Possible with OneDrive or SharePoint | Native collaboration | Usually included |
| Mobile access | Limited depending on Excel features | Good browser/mobile support | Usually included |
| Customizable fields | Editable KPI definitions and formulas | Editable sheet logic | Limited by vendor settings |
| Share with link | Possible through cloud storage | Built in | Login controlled |
| Year-1 cost at 5 users | One-time template cost before Microsoft licensing | Template plus Workspace if needed | Often hundreds or thousands |
| MTD/YTD KPI tracking | Built in | Depends on setup | Depends on plan |
The important distinction is that this workbook reports on fulfillment KPIs. It does not replace order management, warehouse scanning, carrier booking, live inventory, or shipping label systems. It fits best when your operational systems already generate numbers and you need a repeatable Excel reporting layer.
Who Should Use This Template
This dashboard is useful for fulfillment managers, warehouse supervisors, e-commerce operations teams, supply chain analysts, logistics coordinators, customer service leads, and small business owners who monitor monthly order processing performance. It is especially helpful when the team already keeps fulfillment numbers in Excel but needs a structured dashboard for meetings.
It is not the right tool if you need barcode scanning, real-time stock allocation, pick path optimization, automated carrier integrations, payment processing, or customer-facing order tracking. Keep those workflows in your WMS, ERP, shipping, or order management system.
Real-World Use Cases
Monthly fulfillment review
A fulfillment manager updates actual values after month close, selects the month on the Dashboard sheet, and reviews MTD and YTD performance against target and last year.
Warehouse KPI trend meeting
A warehouse lead opens the KPI Trend sheet, selects one KPI, and shows whether the trend is improving over time or drifting away from target.
Operations standardization
A supply chain reporting lead uses the KPI Definition sheet to keep KPI names, formulas, units, and definitions consistent across multiple warehouses or teams.
Advantages of Order Fulfillment KPI Dashboard in Excel
- Fast setup: Start from a ready workbook instead of building input sheets, comparison formulas, and charts manually.
- Clear variance review: Target vs Actual and PY vs Actual indicators make monthly performance easier to scan.
- MTD and YTD together: Managers can review the current month and cumulative year in one view.
- Editable definitions: KPI logic can be documented directly inside the workbook.
- Excel-native: No new reporting platform or subscription is required.
Opportunities for Improvement
Advanced users can extend the file with additional KPI groups, warehouse-level columns, product categories, customer segments, carrier details, SLA bands, return reasons, and root-cause notes. Teams with larger datasets can also connect cleaned exports from ERP, WMS, marketplace, or shipping systems before summarizing the KPI values into the input tabs.
Best Practices
- Keep KPI names consistent across Actual, Target, Previous Year, and Definition sheets.
- Confirm whether each KPI is Upper the Better or Lower the Better before using variance arrows.
- Update targets before entering actual performance numbers for a new month.
- Check one dashboard KPI manually after every input update.
- Use the KPI Definition sheet as the single source of truth for formulas and business meaning.
- Store a dated backup before changing formulas or sheet structures.
For users who are new to Excel slicers and dashboard filtering, Microsoft has a useful guide on using slicers to filter data in Excel.
Explore Relevant Templates
You can get the Order Fulfillment KPI Dashboard in Excel from NextGenTemplates. Related options include the Transportation KPI Dashboard in Excel, Logistics and Transportation Hub, and the full Excel KPI Dashboard templates category.
Frequently Asked Questions
What is the Order Fulfillment KPI Dashboard in Excel?
It is an Excel KPI dashboard template for tracking order fulfillment performance with MTD, YTD, target, and previous-year comparisons.
How many worksheets are included?
The workbook includes 7 worksheets: Home, Dashboard, KPI Trend, Actual Numbers Input, Target, Previous Year Number, and KPI Definition.
Can I edit the KPI names and formulas?
Yes. Use the KPI Definition sheet to edit KPI names, groups, units, formulas, definitions, and KPI type.
Does the dashboard compare against targets?
Yes. The dashboard shows Target vs Actual comparisons for both MTD and YTD values.
Does it include previous-year comparison?
Yes. You can enter previous-year numbers and compare current performance against last year’s values.
Is this a full warehouse management system?
No. It is a reporting workbook. It does not replace warehouse scanning, inventory transactions, carrier integrations, or order management software.
About the Author
Built by PK – Microsoft Certified Professional with 15+ years of Excel, Google Sheets, and Power BI experience. Founder of NextGenTemplates, reaching 300K+ subscribers across YouTube channels. Every template is hand-built and tested before release.
Conclusion
The Order Fulfillment KPI Dashboard in Excel is a practical reporting template for teams that want clearer monthly and year-to-date fulfillment KPI tracking. With editable actuals, targets, previous-year values, KPI definitions, and trend charts, it helps operations teams move from scattered spreadsheets to a repeatable dashboard workflow.
Visit our YouTube channel for Excel and dashboard tutorials: Youtube.com/@PKAnExcelExpert.
Click here to purchase Order Fulfillment KPI Dashboard in Excel