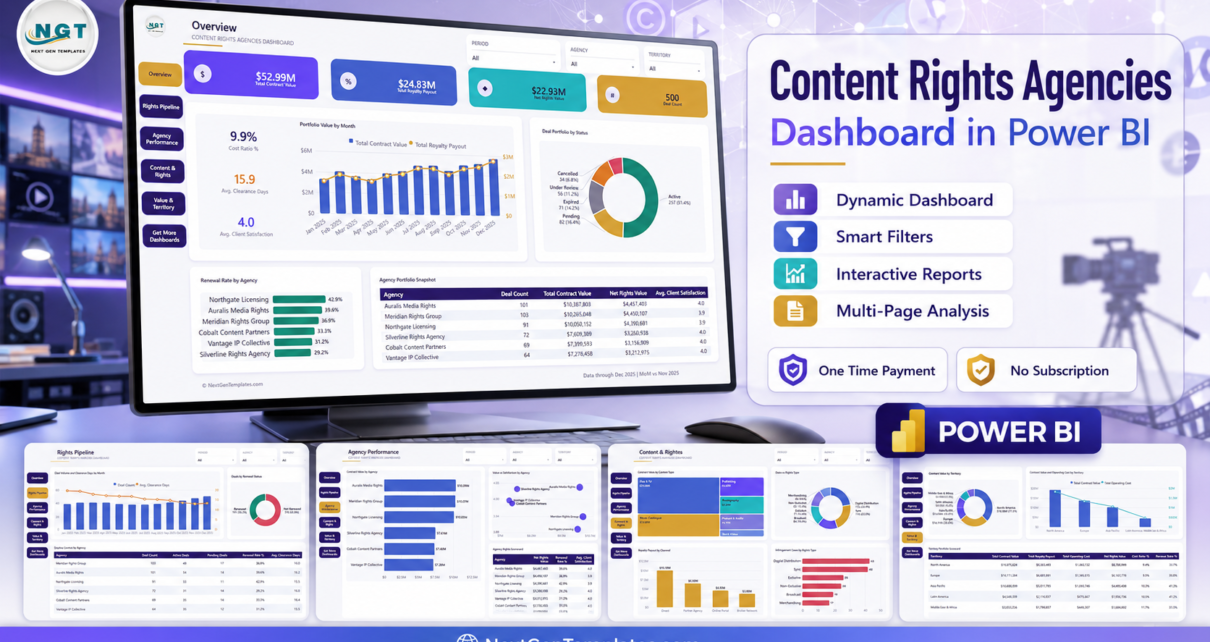
A content rights agency lives on two numbers that never sit in the same place: what the contracts are worth, and what the royalties cost. The Content Rights Agencies Dashboard in Power BI puts them on one screen. The sample report carries 500 licensing deals from January to December 2025 worth $52.99M in total contract value, against $24.83M of royalty payout and a $22.93M net rights value — a cost ratio of 9.9%, an average clearance time of 15.9 days and an average client satisfaction score of 4.0. Content Rights Agencies Dashboard in Power BI
This walkthrough covers what is on each of the six pages, what the model underneath is doing, where the report helps and where it honestly does not.
Key Features of the Content Rights Agencies Dashboard in Power BI
- Six visible pages reached from a left navigation rail that never moves: Overview, Rights Pipeline, Agency Performance, Content & Rights, Value & Territory and Get More Dashboards.
- Three synced slicers in the header — PERIOD (year-month, driven by a Date table in the model), AGENCY and TERRITORY. Set one on any page and the rest follow, because each slicer belongs to a named sync group.
- Nine named measures: Total Contract Value, Total Royalty Payout, Total Operating Cost, Net Rights Value, Deal Count, Renewal Rate %, Avg. Clearance Days, Avg. Client Satisfaction and Total Infringement Cases — plus a Cost Ratio % shown as a side statistic on the Overview page.
- A hidden Deal Details drillthrough page bound to eight fields: Agency, Content Type, Rights Type, Territory, Licensee Type, Channel, Status and Renewal Status.
- Two hidden tooltip pages, Category Detail and Trend Detail, each a 280×360 canvas that appears on hover in place of Power BI’s default tooltip.
- A custom report theme stored as JSON inside the file, with NGT branding and a © NextGenTemplates.com footer already on every page.
- An import-mode model with a Date table, so you repoint
Data.xlsxand refresh rather than rebuilding relationships. Content Rights Agencies Dashboard in Power BI
Dashboard Pages Explanation
Page 1 — Overview
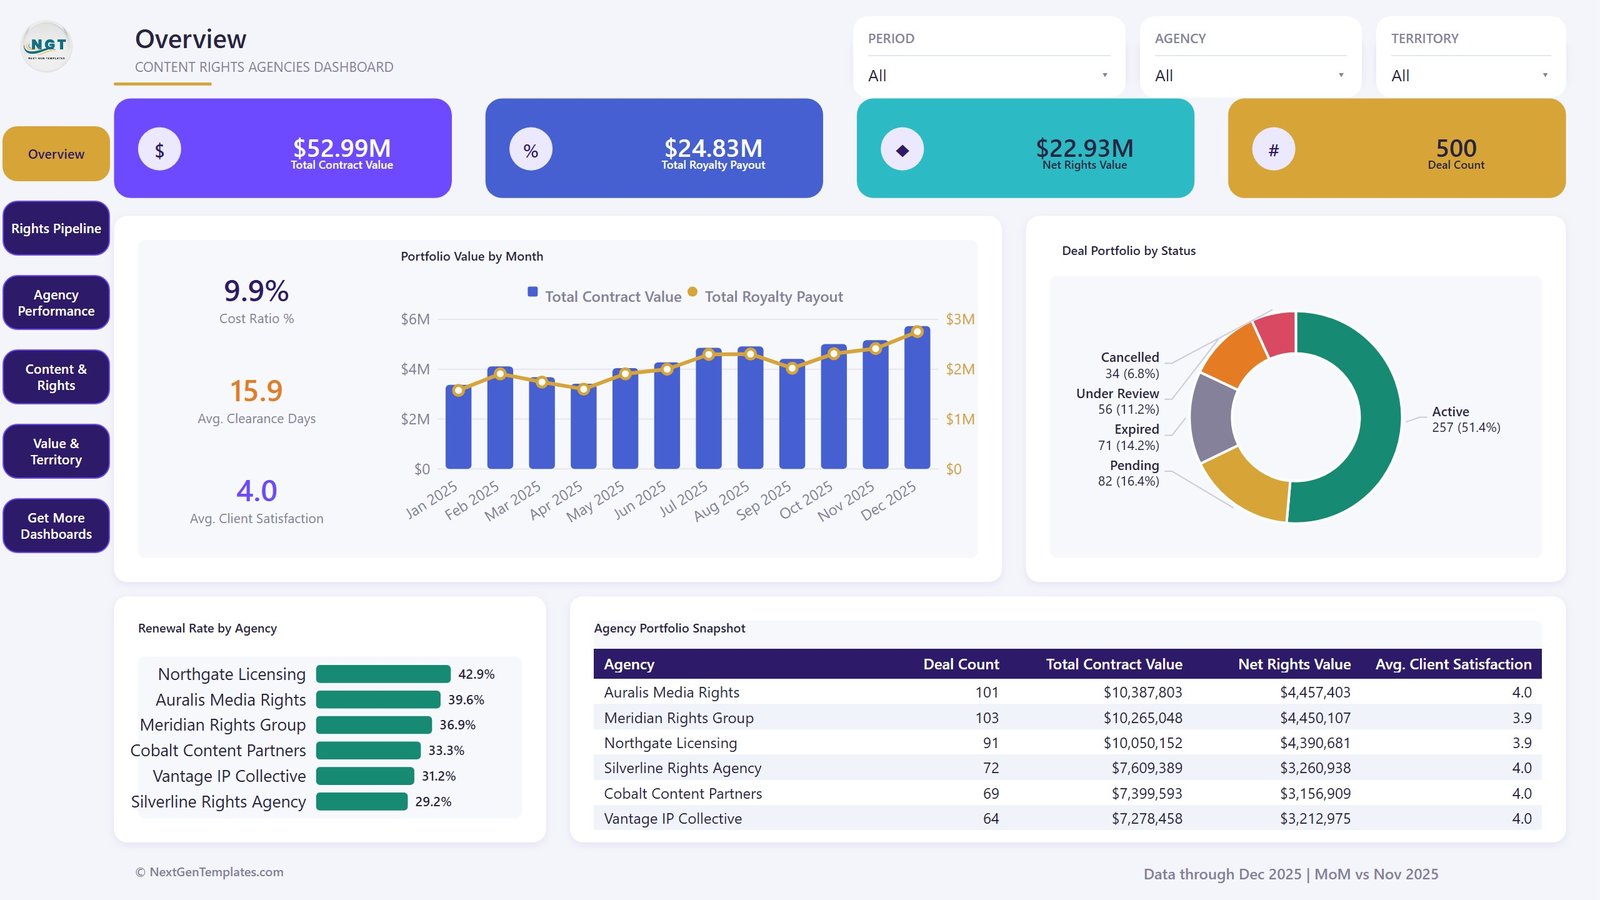
Four KPI cards run across the top: Total Contract Value $52.99M, Total Royalty Payout $24.83M, Net Rights Value $22.93M and Deal Count 500. Below them sit three side statistics (Cost Ratio % 9.9%, Avg. Clearance Days 15.9, Avg. Client Satisfaction 4.0) beside Portfolio Value by Month, a combo chart that puts contract value columns on the left axis and a royalty payout line on the right. Deal Portfolio by Status is a donut — Active 257 (51.4%), Pending 82 (16.4%), Expired 71 (14.2%), Under Review 56 (11.2%), Cancelled 34 (6.8%). The bottom row pairs Renewal Rate by Agency, where Northgate Licensing leads at 42.9% and Silverline Rights Agency trails at 29.2%, with an Agency Portfolio Snapshot table. The page footer reads Data through Dec 2025 | MoM vs Nov 2025. Content Rights Agencies Dashboard in Power BI
Page 2 — Rights Pipeline
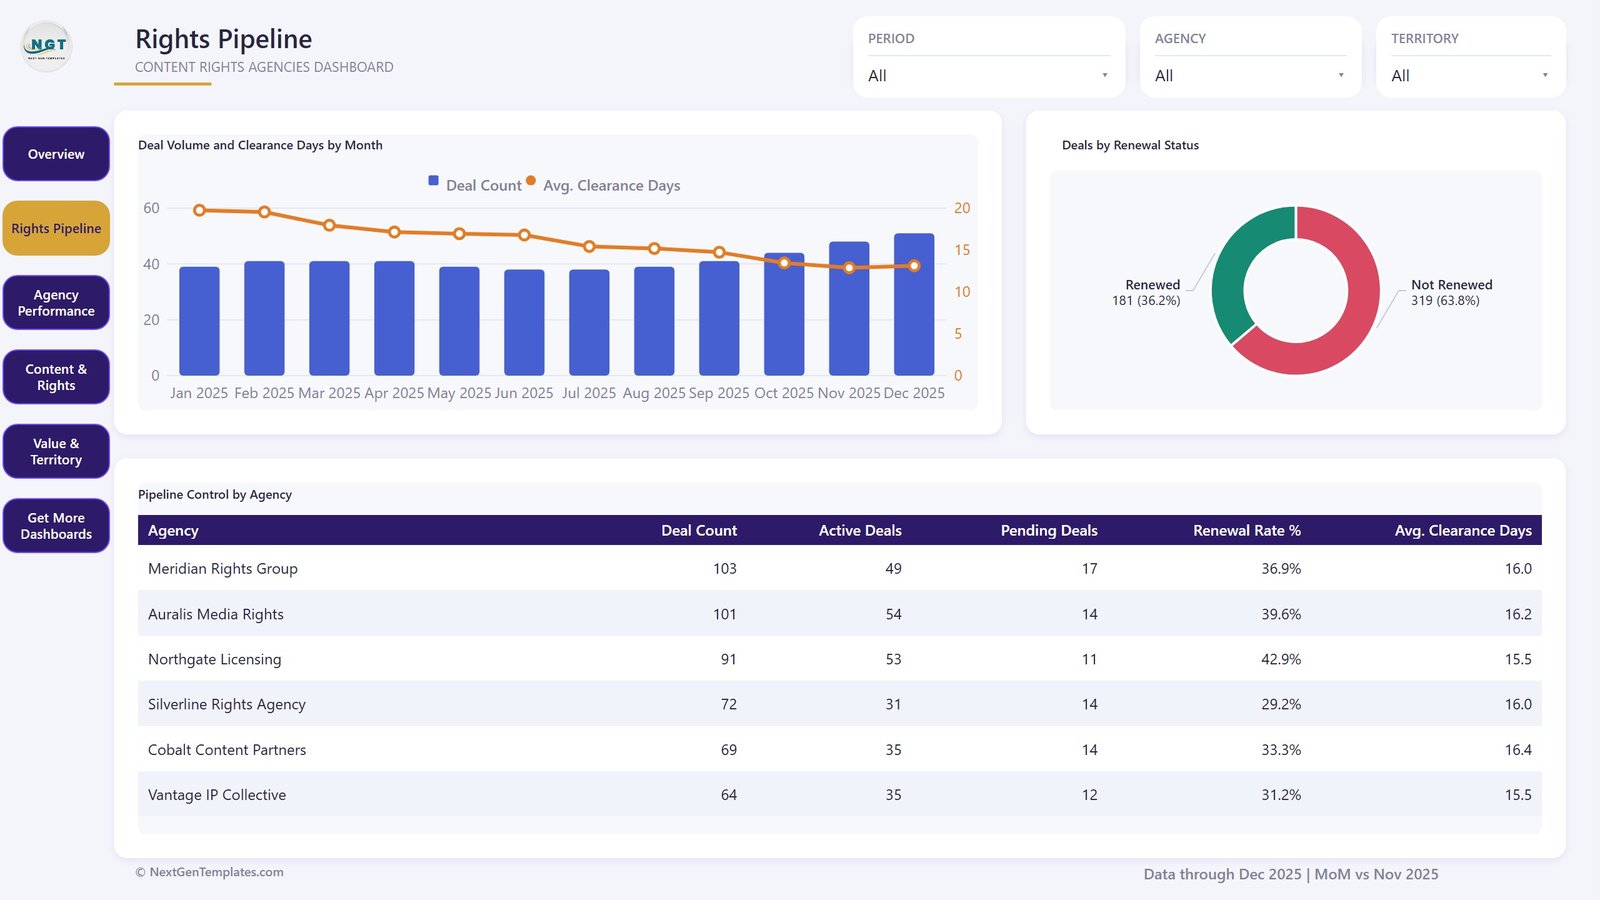
Deal Volume and Clearance Days by Month is the chart to read first: deal count holds near 40 a month while average clearance days fall from about 19 in January to about 13 in December. Next to it, Deals by Renewal Status splits the book 181 renewed (36.2%) against 319 not renewed (63.8%). The Pipeline Control by Agency table then breaks the same picture down per agency with deal count, active deals, pending deals, renewal rate % and average clearance days — Meridian Rights Group at 103 deals and 49 active, Auralis Media Rights at 101 and 54, and so on down to Vantage IP Collective at 64. Content Rights Agencies Dashboard in Power BI
Page 3 — Agency Performance
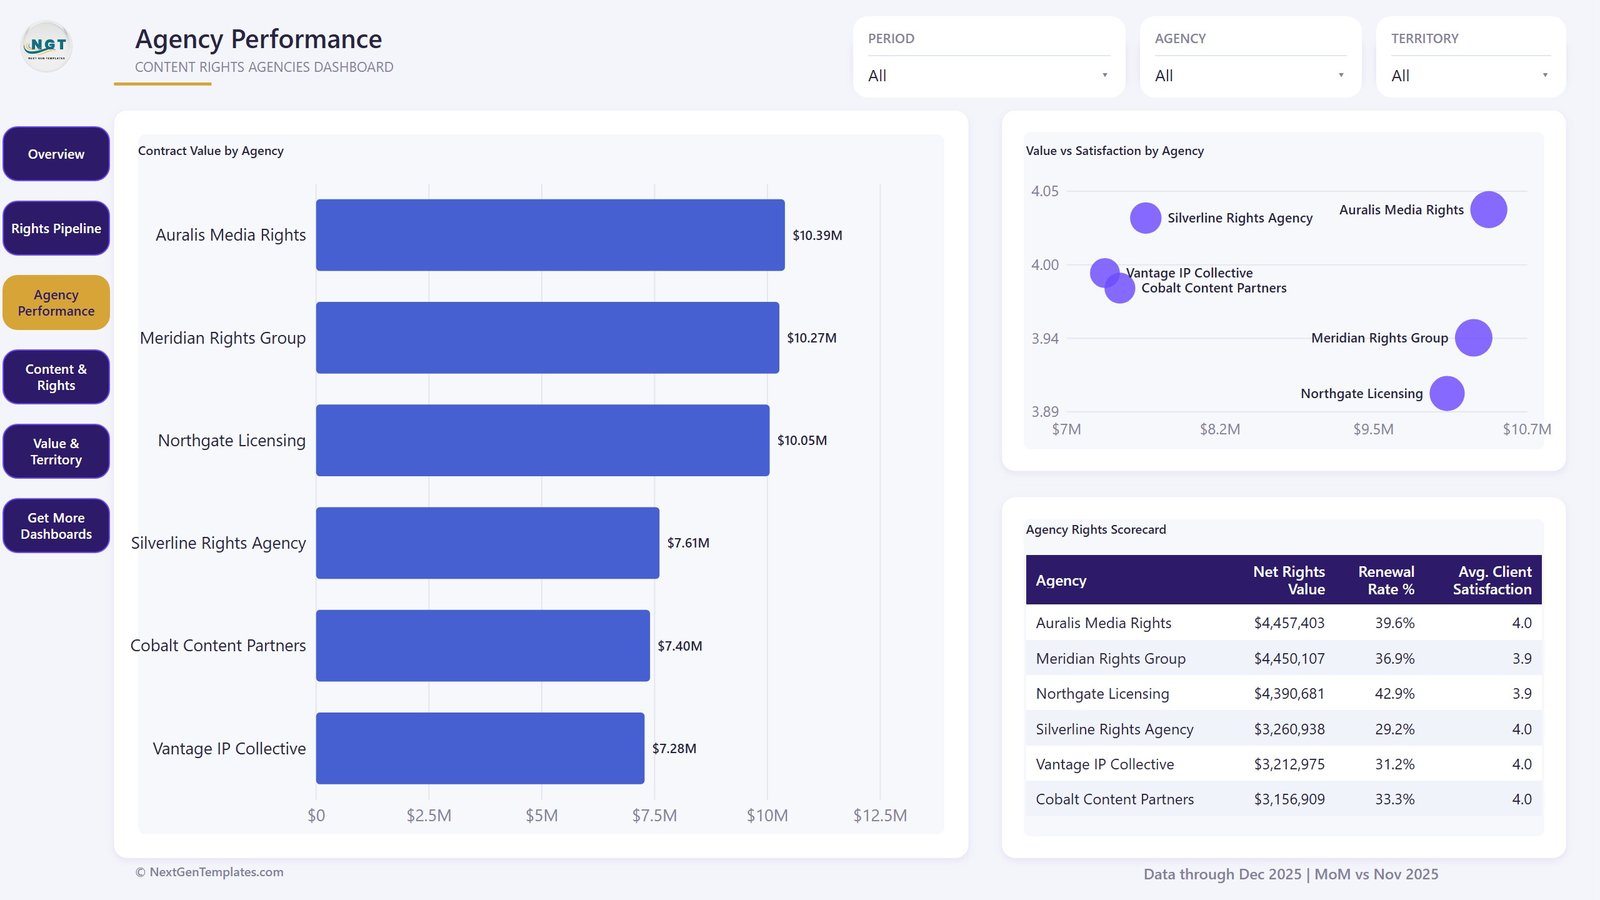
A horizontal Contract Value by Agency bar chart ranks the six agencies from Auralis Media Rights at $10.39M down to Vantage IP Collective at $7.28M. The Value vs Satisfaction by Agency scatter is the more interesting visual: it plots contract value against average client satisfaction, so the agency that bills most and the agency clients like most stop being the same assumption. Northgate Licensing sits high on value and lowest on satisfaction; Silverline Rights Agency does the reverse. The Agency Rights Scorecard table closes the page with net rights value, renewal rate % and satisfaction side by side.
Page 4 — Content & Rights
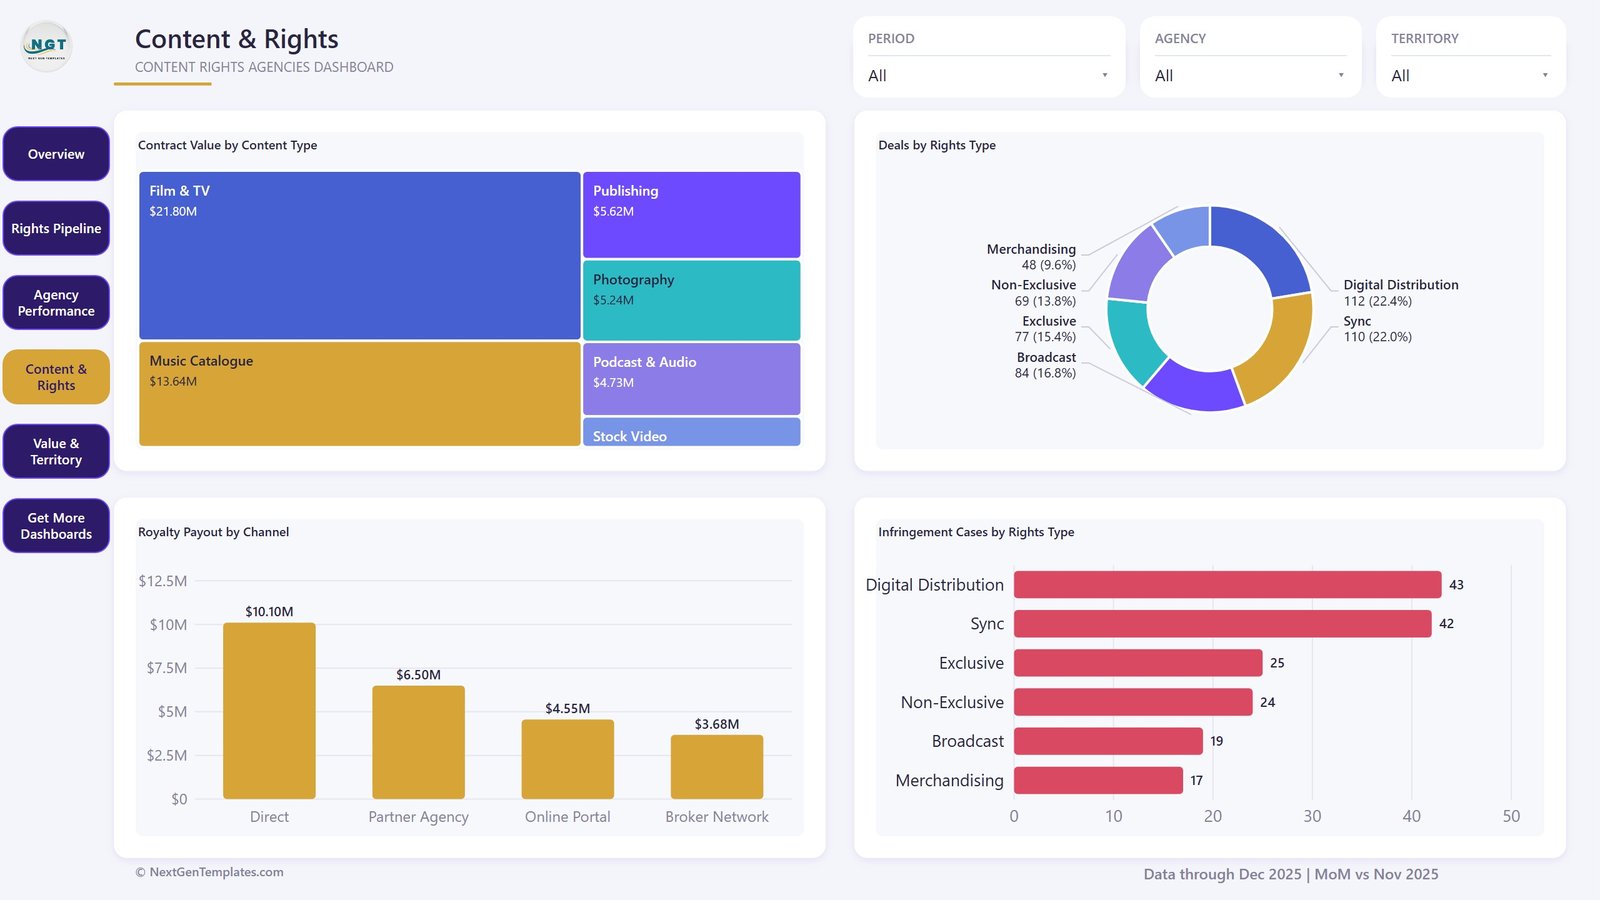
A treemap shows Contract Value by Content Type: Film & TV $21.80M, Music Catalogue $13.64M, Publishing $5.62M, Photography $5.24M, Podcast & Audio $4.73M and Stock Video. Deals by Rights Type is a donut — Digital Distribution 112 (22.4%), Sync 110 (22.0%), Broadcast 84 (16.8%), Exclusive 77 (15.4%), Non-Exclusive 69 (13.8%), Merchandising 48 (9.6%). Royalty Payout by Channel puts Direct at $10.10M, well ahead of Partner Agency $6.50M, Online Portal $4.55M and Broker Network $3.68M. Finally Infringement Cases by Rights Type counts the cases logged in your own register: Digital Distribution 43, Sync 42, Exclusive 25, Non-Exclusive 24, Broadcast 19, Merchandising 17.
Page 5 — Value & Territory
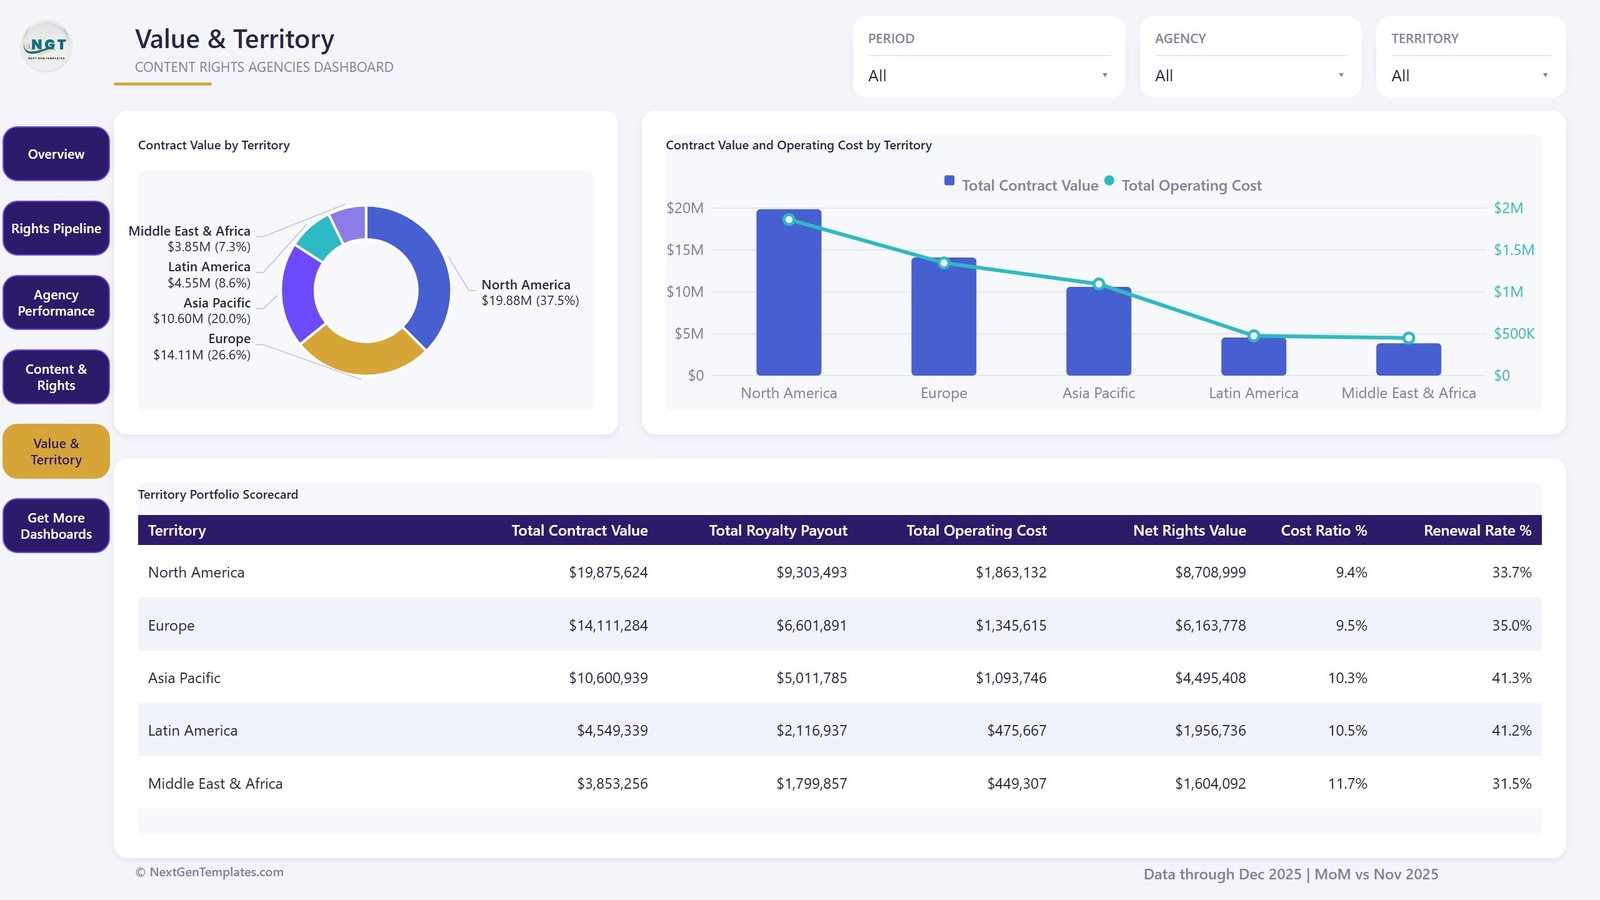
Contract Value by Territory splits the portfolio North America $19.88M (37.5%), Europe $14.11M (26.6%), Asia Pacific $10.60M (20.0%), Latin America $4.55M (8.6%) and Middle East & Africa $3.85M (7.3%). Beside it, Contract Value and Operating Cost by Territory overlays the servicing cost line on the value columns. The Territory Portfolio Scorecard is where the argument gets made: Middle East & Africa is the smallest book and carries the highest cost ratio at 11.7%, while North America runs at 9.4% — and Asia Pacific and Latin America both post renewal rates above 41% against North America’s 33.7%.
Page 6 — Get More Dashboards
An in-report index of other NextGenTemplates Power BI reports and services, with contact details. It ships visible, so remove or hide it before you circulate the file internally.
The hidden pages
Right-click almost any visual element and Drill through → Deal Details opens the hidden page filtered to what you clicked. Microsoft’s own drillthrough documentation on Microsoft Learn explains how the bound fields work if you want to add your own. The two tooltip pages behave the same way on hover.
Content Rights Agencies Dashboard in Power BI vs. Tableau vs. Paid Rights-Management SaaS — Feature Comparison
| This Power BI dashboard | Tableau / Qlik build | Paid rights-management SaaS | |
|---|---|---|---|
| Cost | One payment for the file | Licence plus build time | Per-seat subscription |
| Platform | Power BI Desktop (free) | Tableau Desktop / Qlik Sense | Vendor web app |
| Setup time | Repoint the workbook and refresh | Weeks of modelling | Onboarding and migration |
| Real-time team collaboration | Via Power BI Service | Via Tableau Server | Built in |
| Mobile access | Power BI mobile app | Vendor mobile app | Built in |
| Customizable fields | Full — model, DAX and theme | Full | Vendor schema only |
| Share with link | Yes, once published | Yes, on Server | Yes |
| Year-1 cost at 5 users | The one-off template price | Five Creator seats plus build | Typically four figures and up |
| Deal-level drillthrough | Yes — eight bound fields | Build it yourself | Vendor-dependent |
| Contract storage / e-signature | No | No | Usually included |
Who Should Use This Template
Content rights and licensing agencies keeping a deal register in Excel. Music, film, publishing and photography rights departments that report monthly. Syndication teams tracking renewals across territories. Rights operations leads who need evidence for a headcount or a servicing-cost argument. In short: anyone whose register has outgrown a pivot table but who is not ready to sign a rights-platform contract.
It is a poor fit if you have fewer than about 30 live deals, if you need contract storage or automatic royalty statements, or if you expect the numbers to refresh without anyone opening Power BI Desktop or publishing to the Service.
Real-World Use Cases
Monthly board pack. Filter PERIOD to the closing month, capture the Overview page, and open the meeting on renewal rate by agency rather than on a spreadsheet.
Territory review. Filter TERRITORY to one market and read cost ratio % against renewal rate % in the Territory Portfolio Scorecard before committing to another year of servicing.
Agency quarterly. Filter AGENCY to a single sub-agent and hand them the Agency Performance page — their contract value, their satisfaction score and their position on the scatter, all sourced from the same register.
Advantages of the Content Rights Agencies Dashboard in Power BI
- Every visual is bound to a named measure, so the definitions are in one place and stay consistent across pages.
- The synced slicers remove the classic reporting bug where two pages quietly show two different months.
- Drillthrough means an odd number is one right-click from the deals behind it, which shortens most “can you check that?” conversations.
- The theme is a JSON file, so re-branding for a client or a parent company takes minutes.
- Cost ratio and net rights value are modelled, not typed — they update with the filters.
Opportunities for Improvement
- There are no target or budget columns in the sample data, so nothing on the report shows variance against a plan. Add a target column and a matching measure if you want that.
- The Get More Dashboards page is visible by default and should be hidden before internal circulation.
- Infringement Cases is a count you supply. The report does not detect anything — it visualises what your team has already logged.
- License Duration exists in the data (6 to 48 months) but is not charted on any page; it is available if you want to add an expiry-runway visual.
- Nothing here alerts you that a contract is about to lapse. That is a job for a scheduled refresh plus a data alert in the Power BI Service.
Best Practices
- Keep the 18 column headings in
Data.xlsxexactly as they are — Deal ID, Date, Agency, Rights Manager, Content Type, Rights Type, Territory, Licensee Type, Channel, License Duration, Contract Value, Royalty Payout, Operating Cost, Clearance Days, Client Satisfaction, Infringement Cases, Status, Renewal Status. - Keep Status values inside the five the theme colours expect (Active, Pending, Under Review, Expired, Cancelled) so the donut stays readable.
- Load a full twelve months before you judge a trend; the monthly charts are built for a year of data.
- Clear the slicers before you screenshot a page, or state the filter in the caption.
- Save a copy before you edit measures, so you always have the shipped version to compare against.
Explore Relevant Templates
- Content Rights Agencies Dashboard in Power BI — the template covered in this post.
- Content Rights Agencies Dashboard in Excel — the same subject as a workbook.
- Content Licensing Dashboard in Power BI — licensing from the licensor’s side.
- Podcast Monetization Startups Dashboard in Power BI — audio revenue and sponsorship.
- Publishing Dashboard in Google Sheets — titles, print runs and margins.
Frequently Asked Questions
Do I need a paid Power BI licence to open this?
No. Power BI Desktop is free from Microsoft and opens the .pbix. A paid licence only matters if you want to publish to the Power BI Service and share it there.
Is the licensing data in the file real?
No. All 500 deals, the six agency names, the ten rights managers and every figure are demonstration data built for this template, so the visuals render before you connect your own register.
How do I connect my own register?
Replace the rows in Data.xlsx, keeping the 18 headings. In Power BI Desktop use Transform data → Data source settings to point at your copy, then refresh.
Can it handle more than 500 deals?
Yes. 500 is only the size of the sample; the import model handles much larger registers without any change to the visuals.
Does it track copyright registrations or detect infringement?
No. It is a reporting layer over a register you maintain. It does not register works, monitor the web, or offer legal or valuation advice.
Can I change the colours and add our logo?
Yes. The palette is a theme JSON inside the report and the logo is an image on the page backgrounds — both editable in Power BI Desktop.
How is this different from a KPI scorecard?
This is the analytical line: charts, tables and drillthrough over the whole portfolio. A KPI scorecard is a month-picker view with traffic lights against targets. Different tool for a different meeting.
About the Author
Built by PK – Microsoft Certified Professional with 15+ years of Excel, Google Sheets, and Power BI experience. Founder of NextGenTemplates, reaching 300K+ subscribers across YouTube channels. Every template is hand-built and tested before release.
Conclusion
The Content Rights Agencies Dashboard in Power BI does one job properly: it takes a deal-level licensing register and turns it into a portfolio you can argue about. Six pages, nine measures, three synced slicers and a drillthrough that reaches the individual deal — on a $52.99M sample book you can explore before you load a single row of your own.
Get the Content Rights Agencies Dashboard in Power BI →
For Power BI and Excel walkthroughs, subscribe on YouTube: youtube.com/@PKAnExcelExpert.