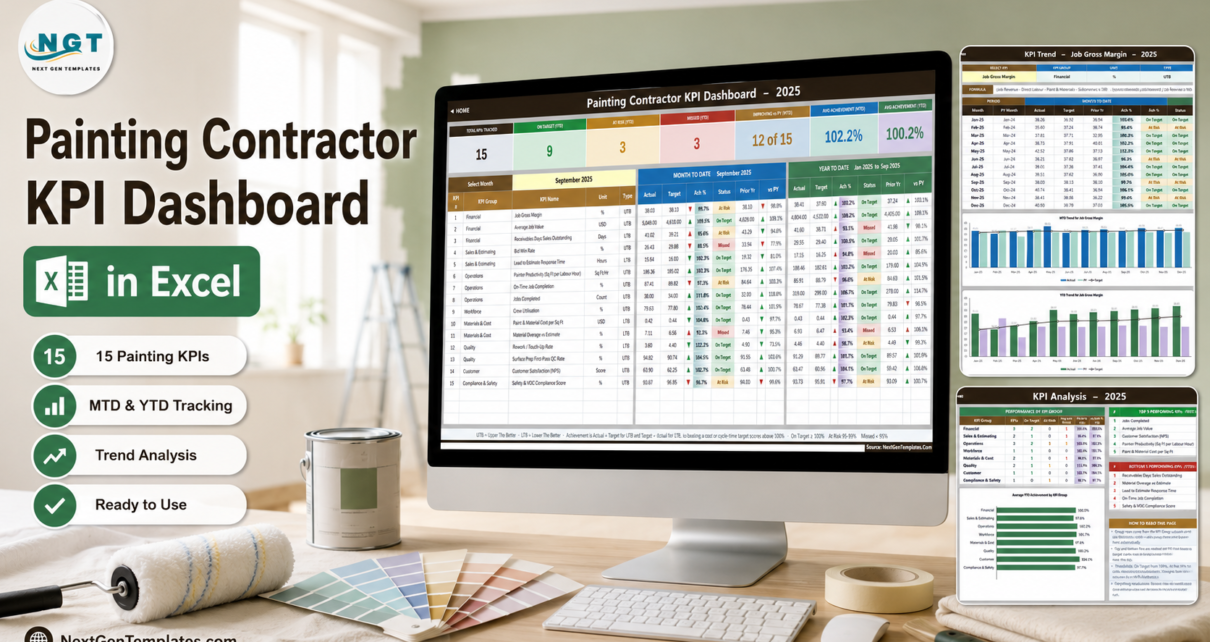
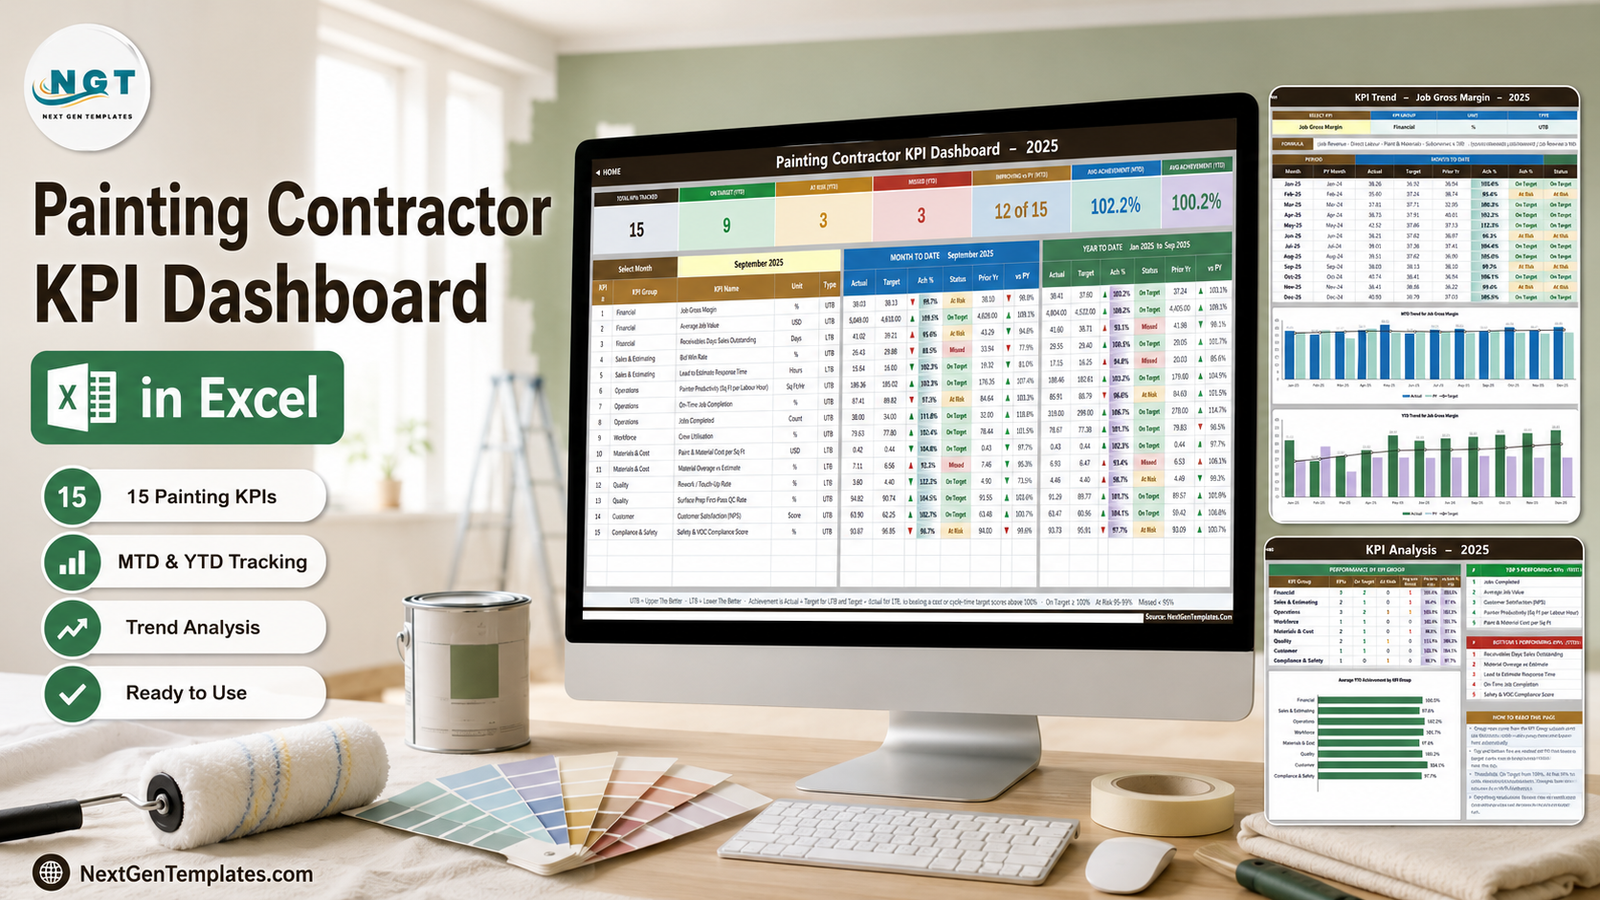
Most painting contractors know their revenue and almost nothing else. The bid went out, the crew went out, the invoice went out, and somewhere in the middle the margin either survived or it did not. The Painting Contractor KPI Dashboard in Excel is built for the meeting where you find out which. It tracks 15 painting KPIs across eight groups, drives the entire file from one month dropdown, and puts month-to-date and year-to-date results side by side with last year’s number on every single row. Painting Contractor KPI Dashboard in Excel
It is a plain .xlsx. No macros, no Power Query, no data model, no add-ins. It opens in Excel 2013 and later and in Excel for the web, it ships with a full twelve-month 2025 sample so it works the moment you open it, and nothing in it is locked or hidden. Every number is an ordinary worksheet formula built on VLOOKUP, MATCH, INDEX and COUNTIF, which means you can click into any cell and see exactly where the figure came from.
Key Features of the Painting Contractor KPI Dashboard
One dropdown drives the whole workbook
Cell D6 on the KPI Dashboard sheet is a list of the twelve months of your reporting year. Change it and the seven summary cards, all fifteen KPI rows and the entire KPI Analysis page recalculate. There is no refresh button, no query to run and no connection to repair, because there is no query in the file at all. Painting Contractor KPI Dashboard in Excel
Direction-aware scoring, which most KPI templates get wrong
Every KPI is flagged UTB (upper the better) or LTB (lower the better) in column G of KPI Definition. Achievement is Actual divided by Target for a UTB KPI and Target divided by Actual for an LTB one. That single rule is why cutting Receivables Days Sales Outstanding from 43 to 41 shows as a score above 100% instead of looking like a shortfall, and it is why the arrows are coloured by whether the movement was good for that KPI rather than by whether the number went up. Painting Contractor KPI Dashboard in Excel
Traffic lights you can move
On Target from 100%, At Risk from 95% to 99%, Missed below 95%. Those thresholds are not hard-coded in a hidden sheet; they sit in the formulas in columns L and U on KPI Dashboard, and both the row statuses and the summary card counts follow whatever you set them to.
A KPI list you edit by typing
KPI Definition is the master list, and the three input sheets, the scorecard, the trend page and the analysis page all read from it. Rename a KPI there and it changes everywhere. Clear a row and the dashboard row goes blank and the cards recount themselves. The sheets are wired for 22 KPI rows, so adding your own KPI needs no formula work at all.
Dashboard Pages Explanation
Home
A navigation page in three columns — Dashboard Pages, Input Sheets and Reference & Help — with a summary panel underneath explaining what the workbook does and what it deliberately avoids.
KPI Dashboard
The scorecard. Across the top sit seven summary cards: Total KPIs Tracked, On Target (YTD), At Risk (YTD), Missed (YTD), Improving vs PY (MTD), Avg Achievement (MTD) and Avg Achievement (YTD). In the shipped September 2025 sample they read 15, 9, 3, 3, 12 of 15, 102.2% and 100.2%.
Below them, one row per KPI carries the KPI number, group, name, unit and type, then a Month To Date block and a Year To Date block, each with actual, target, achievement percentage, status, prior year and a year-on-year percentage. Job Gross Margin, for example, is At Risk for the month at 99.7% but On Target for the year at 102.2% — the kind of split that a single-period scorecard hides completely. Painting Contractor KPI Dashboard in Excel
KPI Trend
One KPI at a time, chosen from a dropdown in cell B4. The page shows that KPI’s group, unit, type, owner, priority and reporting frequency, then its formula and its plain-English definition, then a twelve-month table with MTD, YTD and vs-prior-year columns, and finally two combo charts — MTD Trend and YTD Trend — each drawing actual and prior-year columns against a target line. It is the page you open when a KPI turns red and you need to know whether it is a trend or a bad month.
KPI Analysis
The roll-up. Performance by KPI Group counts the KPIs in each group and how many are On Target, At Risk or Missed, alongside average achievement for the month and the year. An Average YTD Achievement by KPI Group bar chart sits underneath it, and to the right are Top 5 and Bottom 5 Performing KPIs for the year to date. A How To Read This Page panel explains the ranking and the thresholds in four lines.
The three input sheets and KPI Definition
KPI Input – Actual, KPI Input – Target and KPI Input – PY are the only sheets you normally type in. Each holds an MTD and a YTD column for every month of the year, and all three take their KPI rows from KPI Definition. KPI Definition itself carries the number, group, name, unit, formula, definition, type, owner, priority and frequency for all 15 KPIs.
The 15 Painting KPIs
The sample list is a working painting contractor’s list, not a generic one:
- Financial — Job Gross Margin, Average Job Value, Receivables Days Sales Outstanding
- Sales & Estimating — Bid Win Rate, Lead to Estimate Response Time
- Operations — Painter Productivity (Sq Ft per Labour Hour), On-Time Job Completion, Jobs Completed
- Workforce — Crew Utilisation
- Materials & Cost — Paint & Material Cost per Sq Ft, Material Overage vs Estimate
- Quality — Rework / Touch-Up Rate, Surface Prep First-Pass QC Rate
- Customer — Customer Satisfaction (NPS)
- Compliance & Safety — Safety & VOC Compliance Score
Each carries an owner — Controller, Sales Manager, Estimating Manager, Field Superintendent, Operations Manager, Purchasing Manager, Quality Manager, Customer Care Lead or Safety Officer — so nothing red arrives at the monthly meeting without a name attached to it.
Excel vs. Google Sheets vs. Paid Field-Service Software — Feature Comparison
| This template (Excel) | Google Sheets KPI scorecard | Jobber / ServiceTitan-class SaaS | |
|---|---|---|---|
| Cost | One payment, no renewal | One payment, no renewal | Roughly $50 to $300 per user per month |
| Platform | Excel 2013+, Excel for the web | Browser, any device | Web plus mobile app |
| Setup time | Minutes — type over the sample | Minutes — copy the sheet | Weeks, usually with onboarding |
| Real-time team collaboration | Via OneDrive or SharePoint | Yes, natively | Yes |
| Mobile access | Excel mobile app | Yes | Yes, built for the field |
| Customisable KPIs | Type a new row, no formula edits | Type a new row | Only what the vendor exposes |
| Share with a link | Via OneDrive | Yes | Yes |
| Year-1 cost at 5 users | The purchase price | The purchase price | $3,000 to $18,000 |
| Job scheduling and dispatch | No — this is reporting | No | Yes |
| Direction-aware scoring (UTB/LTB) | Yes, set per KPI | Yes, set per KPI | Rarely exposed |
Who Should Use This Template
Owners of residential and light-commercial painting businesses running roughly two to twenty crews, who already have the numbers somewhere and need them on one page once a month. Estimating managers who own Bid Win Rate and Lead to Estimate Response Time and want twelve months of evidence before asking for another estimator. Field superintendents who live on Painter Productivity and Crew Utilisation. Bookkeepers and fractional controllers preparing a monthly pack for a contractor client.
It is not for anyone who wants live job data. The workbook does not connect to Jobber, ServiceTitan, QuickBooks or a takeoff tool, and it does not schedule, estimate or invoice. Use field-service software for the day-to-day and this for the month-end review.
Real-World Use Cases
The margin post-mortem. September shows Job Gross Margin at 99.7% of target and Material Overage vs Estimate missed at 92.3%. Read together, the story is not that the crews were slow — Painter Productivity beat target at 102.3% — but that the take-offs were light. That conversation belongs to purchasing and estimating, and the scorecard points straight at it.
The rework argument. Rework / Touch-Up Rate is On Target for the month at 122.2% and At Risk for the year at 98.7%. KPI Trend shows whether the good month is a turnaround or a blip before anyone claims credit for it.
The board pack. KPI Analysis prints as a single page: eight groups, their status counts, an achievement bar chart, and the five best and five worst KPIs of the year. For most small contractors that page is the whole monthly management report.
Advantages of the Painting Contractor KPI Dashboard
- No installation, no macro warning and no add-in dependency — it opens and works, including in Excel for the web.
- MTD and YTD are shown together, so a strong month never disguises a weak year.
- Achievement is direction-aware, so cost and cycle-time KPIs are scored honestly.
- Thresholds, KPI names, owners and the reporting year are all editable in named places, not buried.
- The sample data is a complete, plausible painting year, which makes the file useful as a teaching tool before you replace a single number.
Opportunities for Improvement
Two things are worth knowing before you buy. First, both the MTD and the YTD columns are typed on the three input sheets — the workbook does not derive year-to-date from your monthly figures. That is a deliberate design choice that keeps your own YTD definition intact, but it does mean twice the data entry, and it is on you to keep the two consistent. Second, the Frequency column on KPI Definition is documentation, not a switch: four KPIs are labelled Weekly, but every input grid is monthly for all 15.
Two cosmetic notes: the Home page summary still says the workbook drives 14 KPIs when the file ships 15 — everything that calculates uses 15 — and the Read Me’s note on cumulative versus average YTD still quotes examples from another industry. Neither affects a single formula, and both are text edits you can make in seconds.
Best Practices
- Set the reporting year once, in cell E3 on KPI Input – Actual, before you type anything else.
- Prune the KPI list before you populate it. Fifteen KPIs is already more than most painting businesses review monthly; nine or ten that somebody actually owns beats fifteen that nobody does.
- Set UTB or LTB deliberately for every KPI you add. It is the one setting that changes what “good” means.
- Fill prior-year data if you have it. Half the value of the scorecard is the vs-PY column, and it is empty until you type it.
- Read KPI Trend before reacting to any single red status.
- Keep a copy of the untouched file. It is your reference for how the formulas were wired. If you want a refresher on how the underlying lookups behave, Microsoft’s own VLOOKUP documentation is the clearest short reference there is.
Explore Relevant Templates
- Painting Contractor KPI Dashboard in Excel — the template covered in this post.
- Painting Contractor KPI Scorecard in Excel — same trade, a separate scorecard build with its own KPI list.
- Painting Contractor KPI Scorecard in Google Sheets — the browser-based equivalent.
- Plumbing Business KPI Dashboard in Excel — the same dashboard build for a plumbing business.
- Construction Project Cost Dashboard in Excel — project-level cost analysis rather than monthly KPIs.
- Every KPI Dashboard template in the catalogue.
Frequently Asked Questions
Does the Painting Contractor KPI Dashboard need macros?
No. It is a plain .xlsx with no macros, no Power Query, no data model and no add-ins. It opens in Excel 2013 and later, and in Excel for the web.
How many KPIs can I track?
Fifteen are filled in and the sheets are wired for 22 rows, so seven more need nothing but typing. The Read Me explains how to extend past 22 by filling down the last data row on each sheet and widening the summary ranges.
Can I use my own KPI names and groups?
Yes. Change them on KPI Definition and every other sheet follows, including the group roll-up on KPI Analysis, which builds its rows from the distinct KPI Group values it finds.
Why does a lower number sometimes score above 100%?
Because that KPI is marked LTB. Achievement for an LTB KPI is Target divided by Actual, so beating a cost, days or cycle-time target scores above 100%, the same way beating a revenue target does.
Does it import data from my accounting or job-management system?
No. You type or paste the monthly figures on the three input sheets. That is what keeps the file portable and free of broken connections.
What is in the download?
A zip containing Painting Contractor KPI Dashboard.xlsx and the Excel KPI Dashboard User Manual PDF.
Is this the same thing as the Painting Contractor KPI Scorecard?
No. They are two different builds. This one is the month-picker dashboard with the KPI Trend and KPI Analysis pages described above; the scorecard is a separate template with its own KPI list. Plenty of contractors own both.
About the Author
Built by PK – Microsoft Certified Professional with 15+ years of Excel, Google Sheets, and Power BI experience. Founder of NextGenTemplates, reaching 300K+ subscribers across YouTube channels. Every template is hand-built and tested before release.
Conclusion
A painting business does not fail because nobody looked at revenue. It fails because nobody looked at overage, rework and days-to-collect until the year was over. The Painting Contractor KPI Dashboard in Excel puts all fifteen of those numbers on one page, scores them in the right direction, colours them against thresholds you control, and lets you walk the twelve-month history of any one of them without leaving the file.
Get the Painting Contractor KPI Dashboard in Excel — instant download, sample data included, lifetime access to the file you buy.
For step-by-step Excel dashboard tutorials, subscribe to youtube.com/@PKAnExcelExpert.