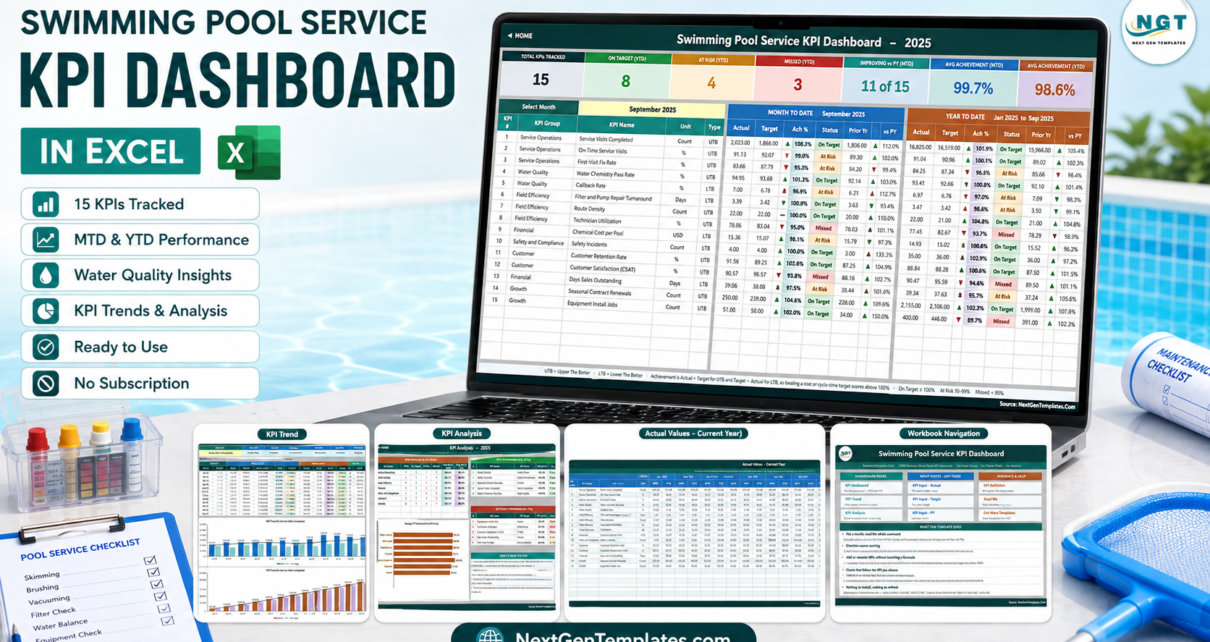
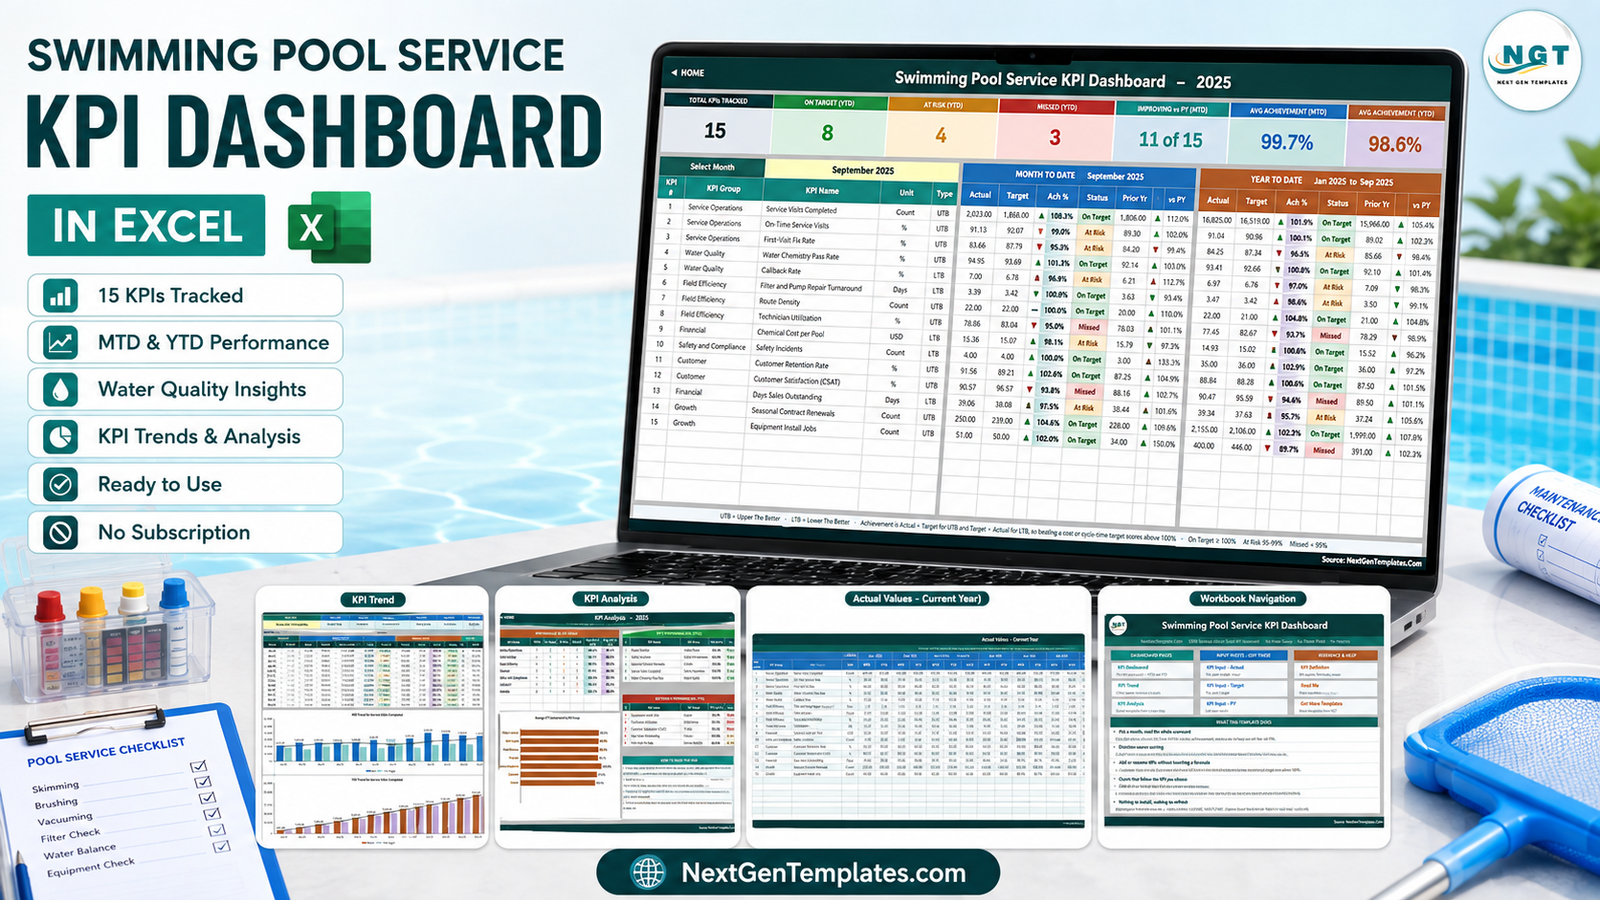
A pool service company measures itself on things that pull against each other. Push route density and callbacks creep up. Tighten chemical spend and the chemistry pass rate slips. Chase seasonal renewals and technician utilization sags because the crew is quoting instead of cleaning. The Swimming Pool Service KPI Dashboard in Excel puts 15 of those KPIs across 7 groups on one page – route stops, water chemistry, callbacks, repair turnaround, utilization, chemical cost, safety, retention, CSAT, receivables and growth – each with month-to-date and year-to-date actual, target, achievement, status and prior-year movement.
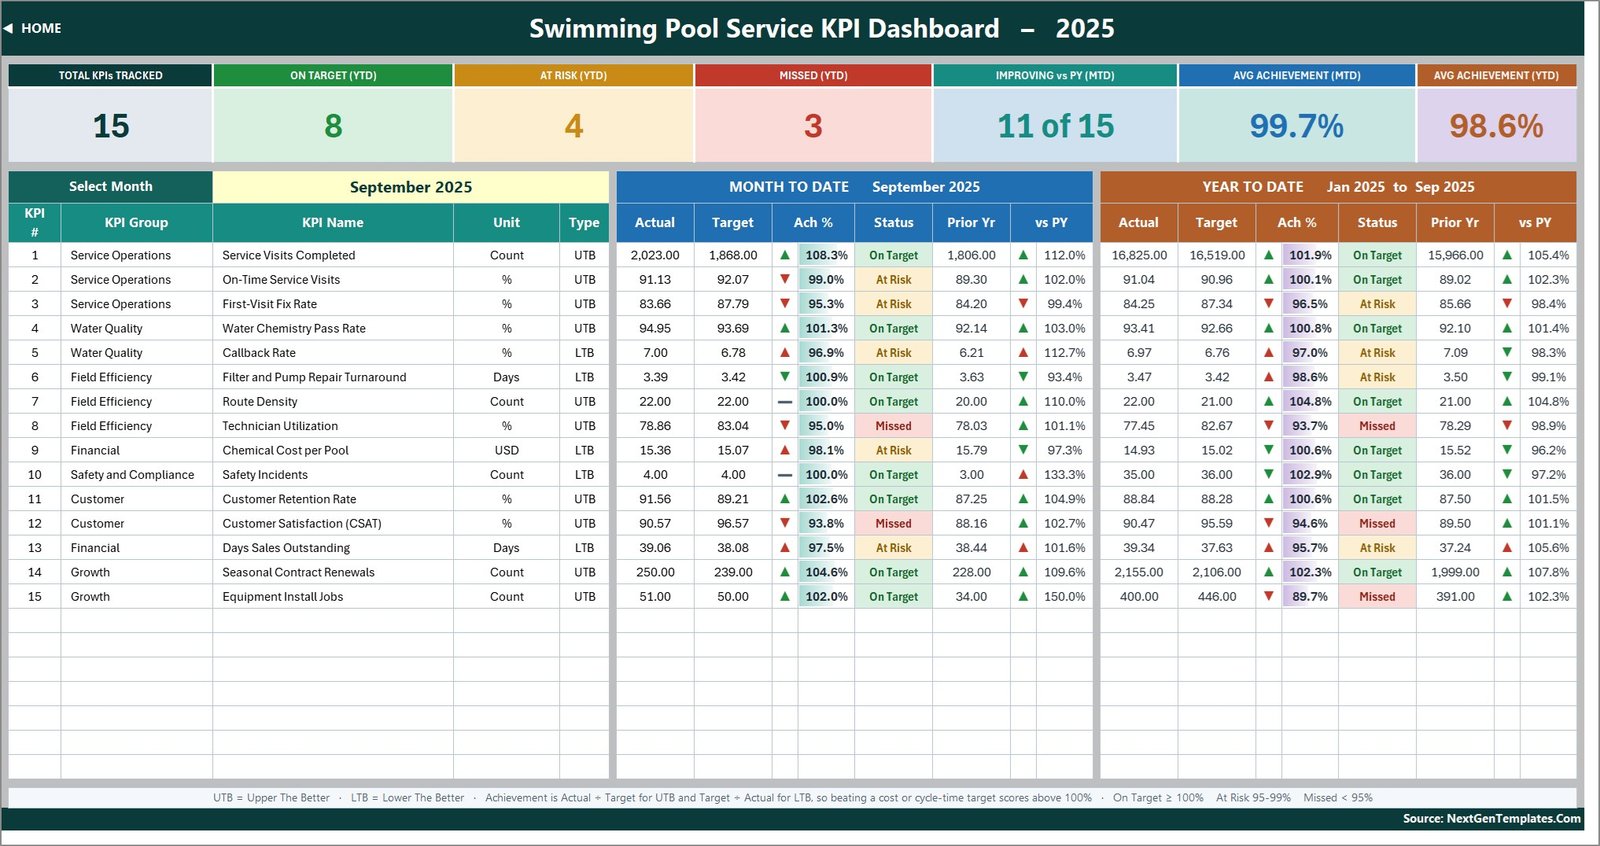
It is 1,284 worksheet formulas across 11 sheets. No macros, no Power Query, no data model, no add-ins, no refresh step. In the shipped September 2025 sample it reads 15 KPIs tracked, 8 On Target, 4 At Risk, 3 Missed, 11 of 15 improving against last year, 99.7% average achievement month to date and 98.6% year to date – and every one of those seven cards is a formula over the fifteen rows below it, so they move the moment you change the month.
Key Features of the Swimming Pool Service KPI Dashboard in Excel
- One month dropdown drives the workbook. Cell D6 on KPI Dashboard is a list of the twelve months of the reporting year. It resolves by position in that list rather than by matching a month name, so a formatting difference can never blank the scorecard.
- Direction-aware achievement. Ten KPIs are flagged UTB (upper the better) and five LTB (lower the better) on KPI Definition. Achievement is Actual/Target for UTB and Target/Actual for LTB, so cutting Callback Rate, Chemical Cost per Pool, Repair Turnaround, Safety Incidents or Days Sales Outstanding below target scores above 100%.
- Status bands you can retune. On Target from 100%, At Risk 95% to 99%, Missed below 95%. The thresholds live inside the formulas in columns L and U on KPI Dashboard.
- Prior year on every row, MTD and YTD. The arrow shows the raw direction of travel; its colour reflects whether that direction is good for that particular KPI.
- 22 KPI slots. KPI Definition is wired to row 25. Add a row and the three input sheets, the scorecard, the trend dropdown and the group roll-up pick it up with no formula edits.
- Re-bases to your year. Cell E3 on KPI Input – Actual is the first month; change it and the target sheet, prior-year sheet, month list and all sheet titles follow.
- Opens anywhere. Plain VLOOKUP, MATCH, INDEX, COUNTIF and SUMPRODUCT in an .xlsx – Excel 2013 and later, Microsoft 365, and Excel for the web.
Dashboard Pages Explanation
Home
An index page in three columns – dashboard pages, input sheets, and reference and help – each a hyperlink to the sheet it names, with a five-point summary of what the workbook does underneath.
KPI Dashboard
The scorecard. Seven summary cards run along the top: Total KPIs Tracked, On Target (YTD), At Risk (YTD), Missed (YTD), Improving vs PY (MTD), Avg Achievement (MTD) and Avg Achievement (YTD). Below them, one row per KPI carries KPI number, group, name, unit and type on the left, then a Month To Date block and a Year To Date block, each with actual, target, achievement percentage, status and prior year with a year-on-year percentage.
KPI Trend
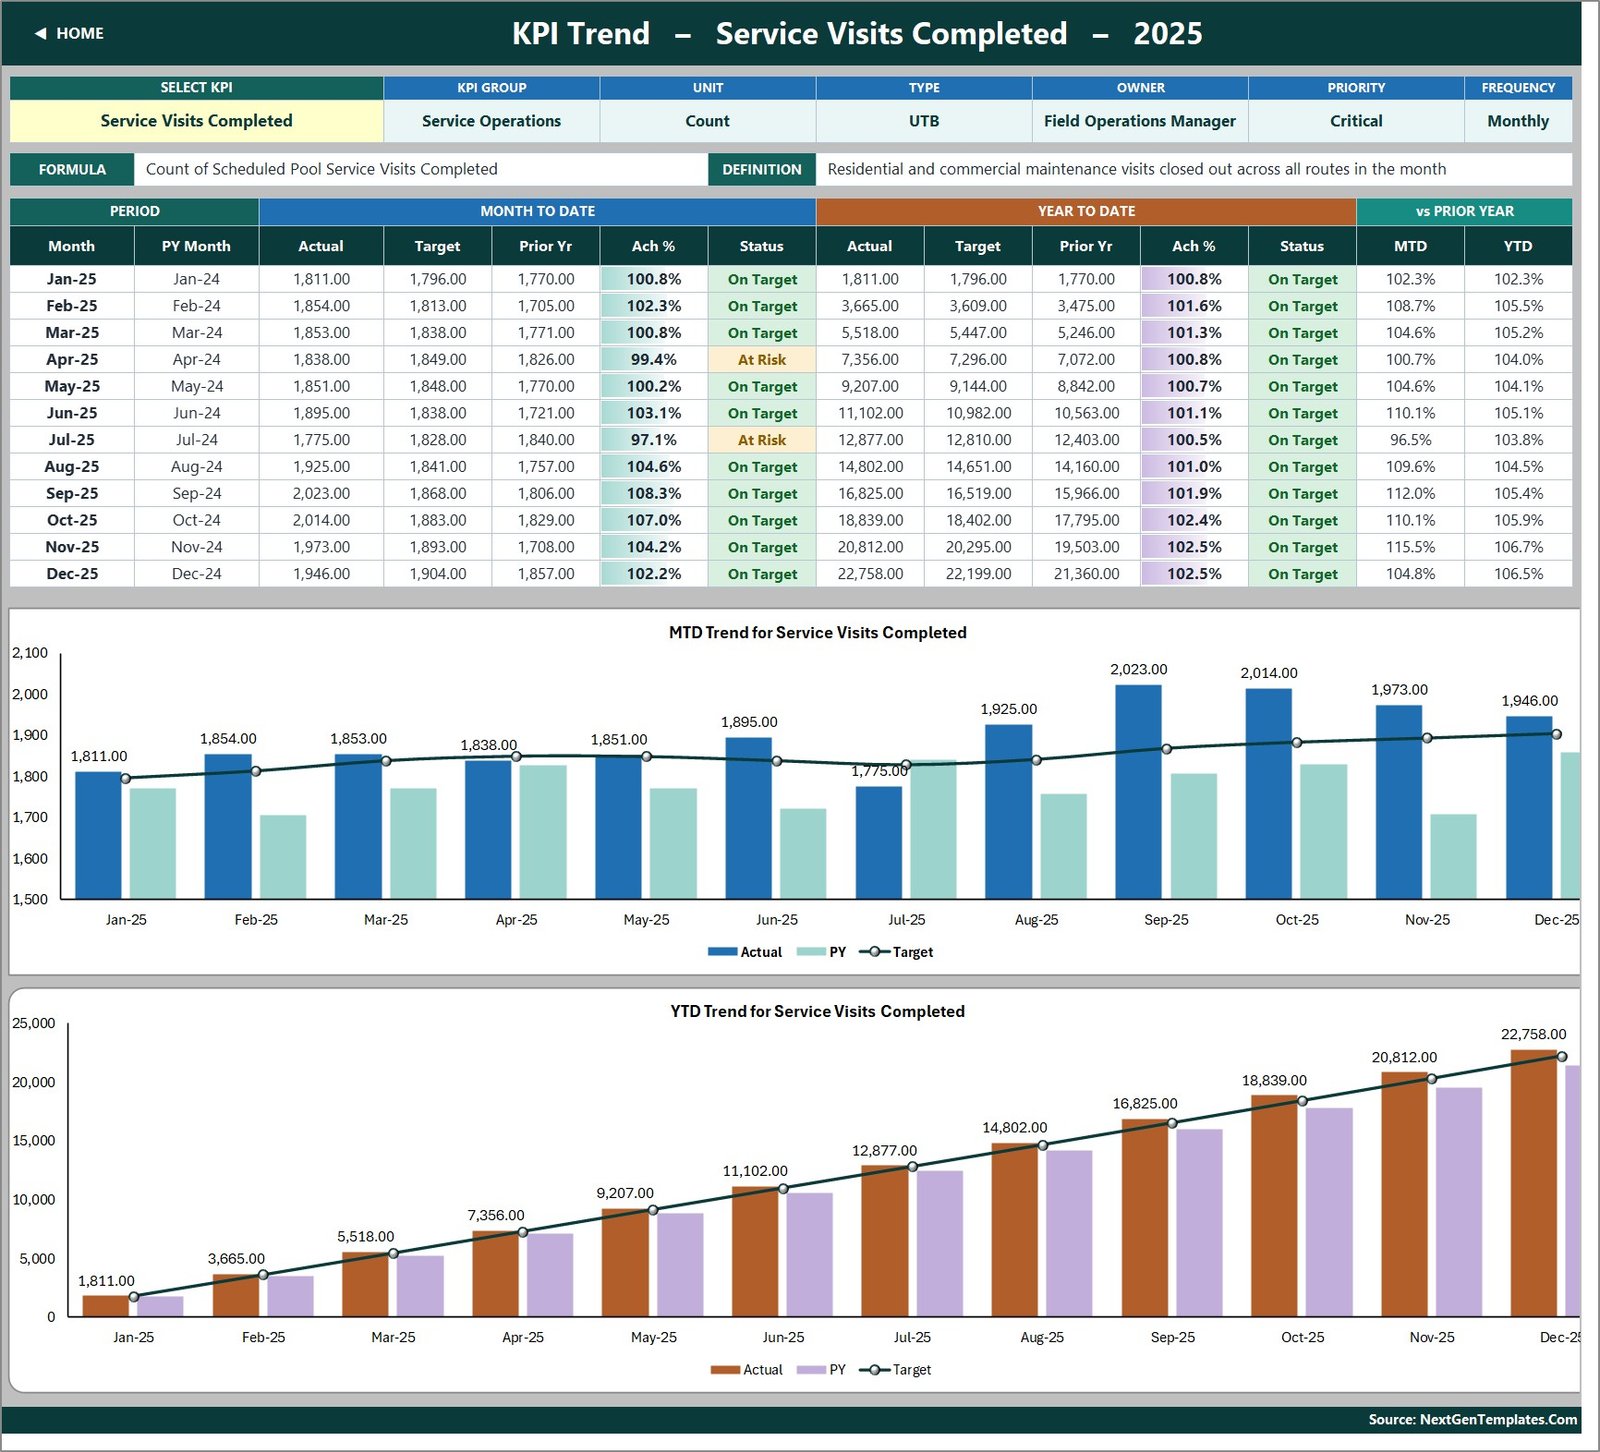
Pick a KPI from the dropdown in B4 and the whole page follows it. An attribute strip shows group, unit, type, owner, priority and frequency; the formula and definition sit beneath it; a twelve-month table gives MTD and YTD actual, target and prior year with status on each row; and two combo charts redraw – MTD Trend and YTD Trend, each plotting actual and prior-year columns against a target line.Swimming Pool Service KPI Dashboard in Excel
KPI Analysis
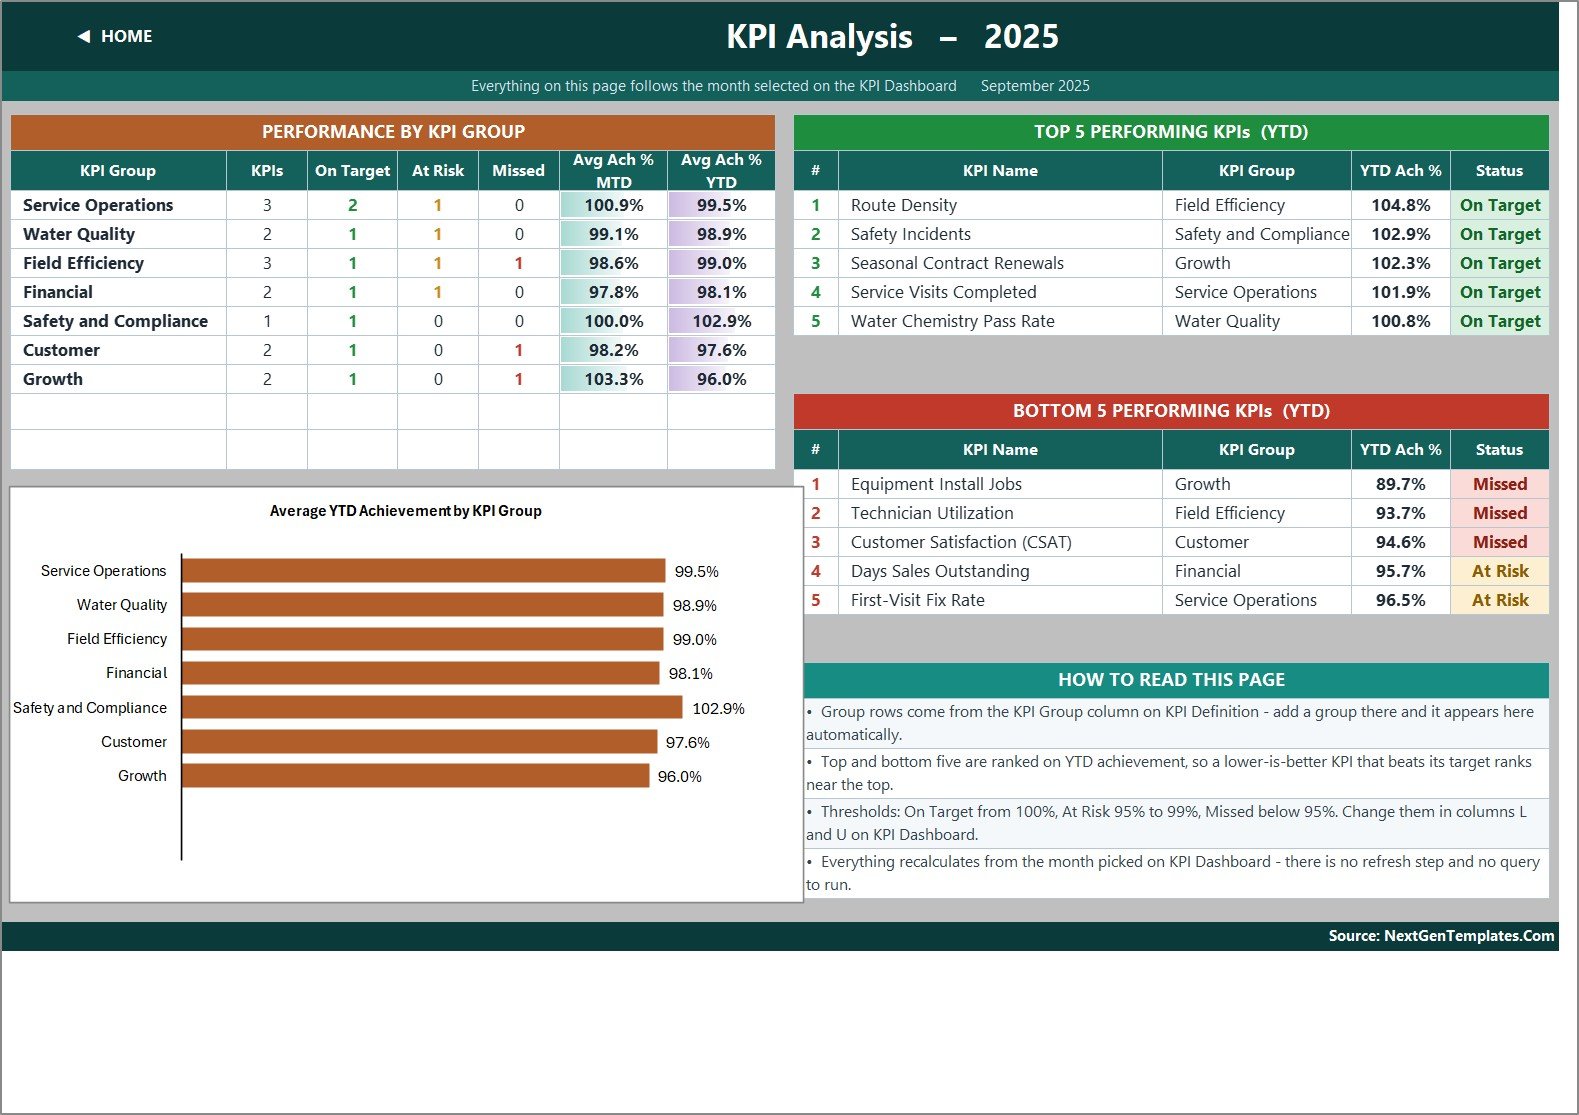
Everything here follows the month chosen on KPI Dashboard. Performance by KPI Group counts how many KPIs in each group are On Target, At Risk and Missed and averages their MTD and YTD achievement; a bar chart plots Average YTD Achievement by KPI Group; and two ranked tables list the Top 5 and Bottom 5 KPIs on year-to-date achievement. Because the ranking uses achievement rather than raw value, a lower-is-better KPI that beats its target ranks near the top – which is exactly what you want when Safety Incidents and Route Density sit in the same list.Swimming Pool Service KPI Dashboard in Excel
KPI Input – Actual, Target and PY
The three sheets you type into. Each holds an MTD and a YTD column for every month of the year, and each takes its KPI rows from KPI Definition so the three can never fall out of step. The prior-year sheet’s headers are the actual sheet’s headers shifted back twelve months.Swimming Pool Service KPI Dashboard in Excel
KPI Definition
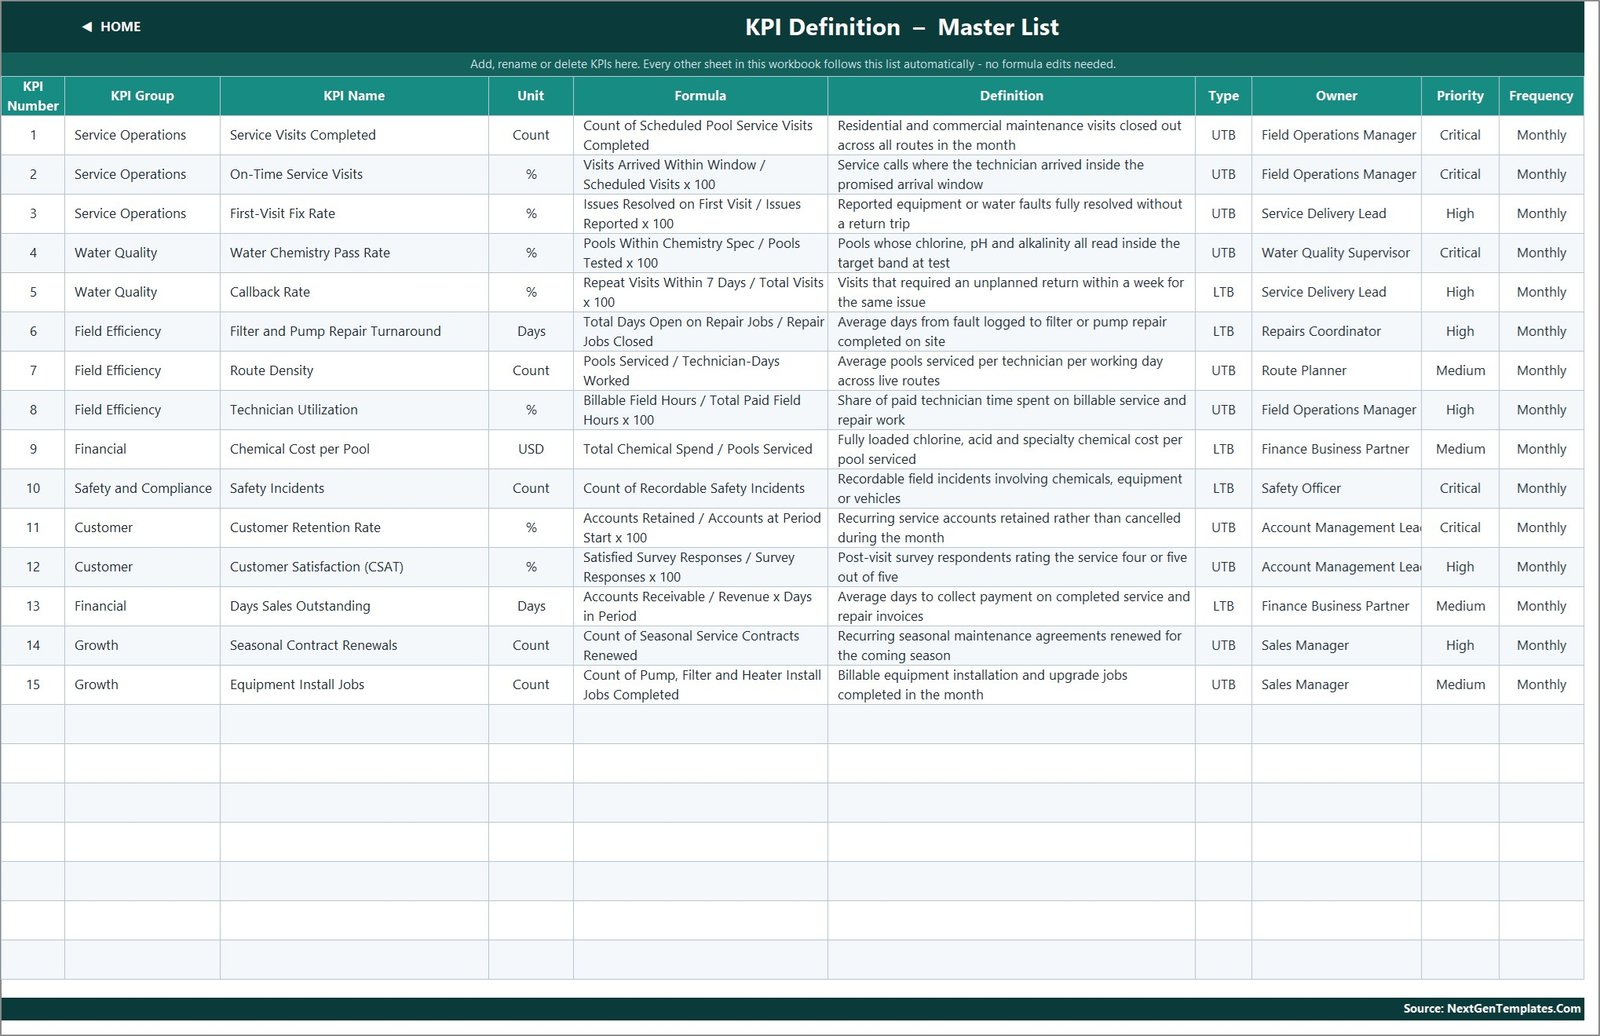
The master list, and the sheet that makes the rest of the workbook dynamic: KPI number, group, name, unit, formula, definition, type, owner, priority and frequency. Rename a KPI here and every other sheet renames with it.Swimming Pool Service KPI Dashboard in Excel
Read Me and Get More Templates
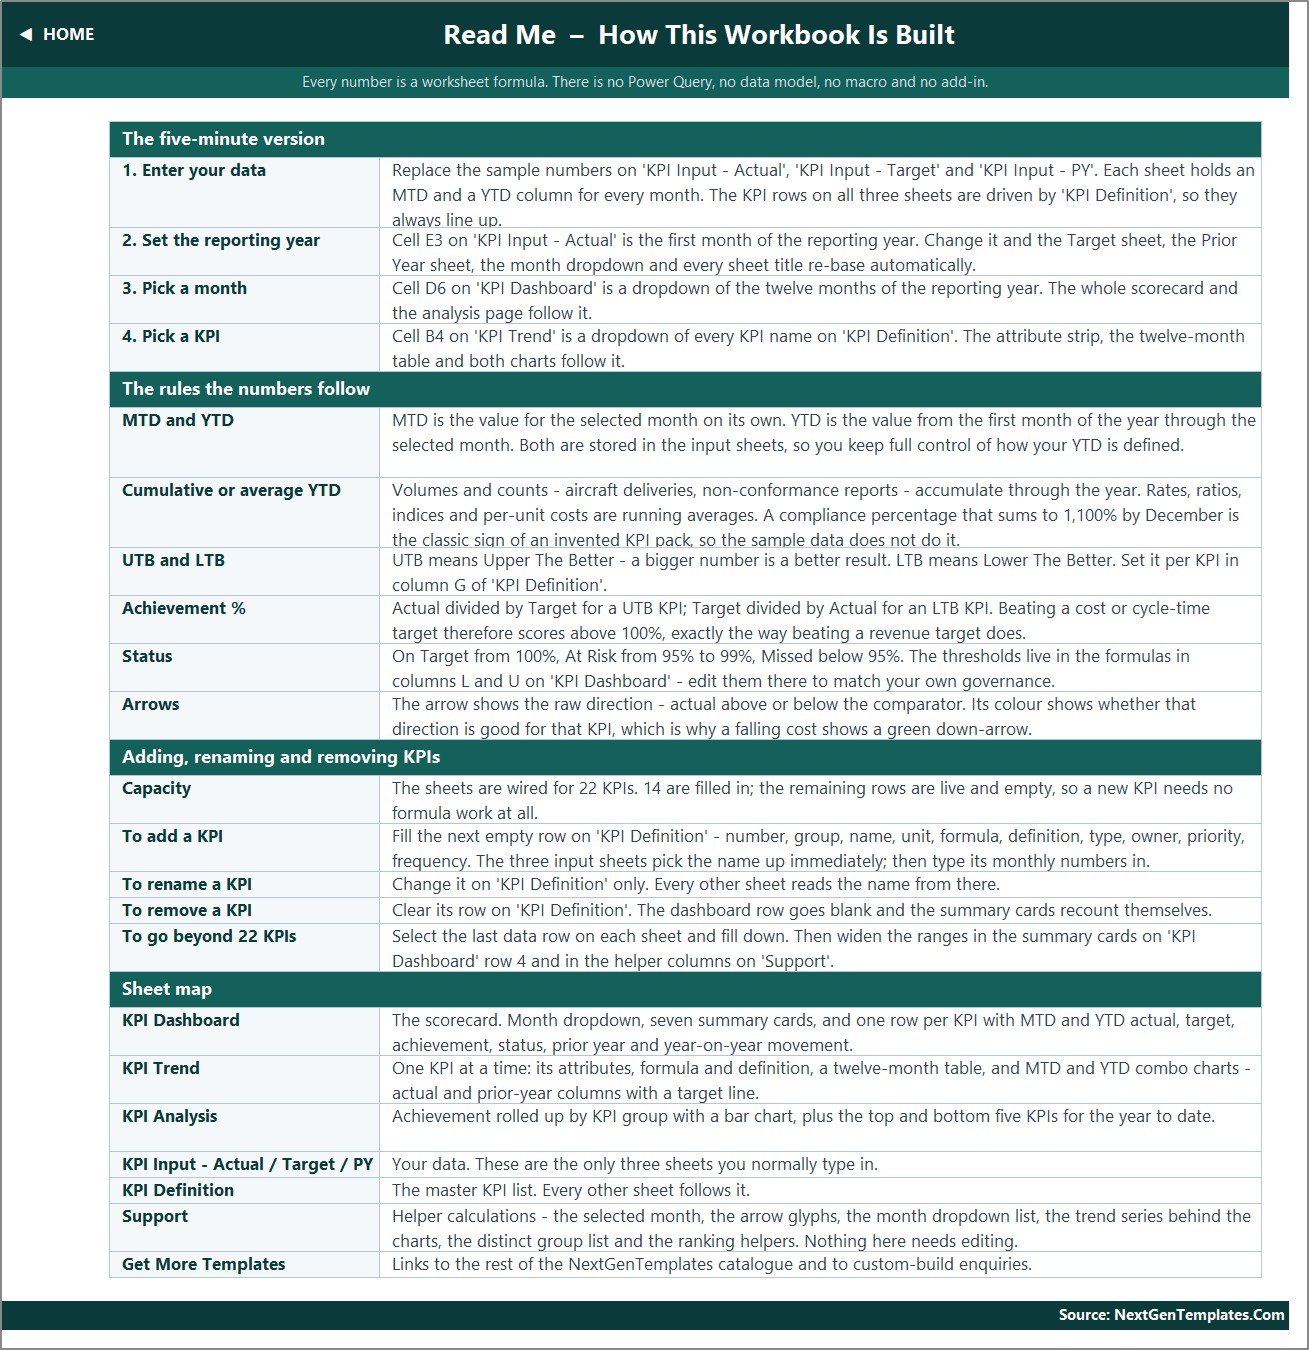
Read Me is a genuine build document – a four-step quick start, the rules the numbers follow, how to add, rename and remove KPIs, and a sheet-by-sheet map. Get More Templates links out to the wider catalogue. A hidden Support sheet carries the helper calculations: the selected month, the arrow glyphs, the month list, the chart series, the distinct group list and the ranking helpers.Swimming Pool Service KPI Dashboard in Excel
Excel vs. Google Sheets vs. Paid Pool-Service SaaS – Feature Comparison
| This Excel KPI Dashboard | Google Sheets KPI scorecard | Pool/field-service SaaS | |
|---|---|---|---|
| Cost | One-time purchase | One-time purchase | Subscription, usually per technician per month |
| Platform | Excel 2013+, Microsoft 365, Excel for the web | Browser, Google account | Vendor web app plus technician mobile app |
| Setup time | Minutes – replace three sheets of numbers | Minutes – make a copy | Days to weeks of onboarding |
| Real-time team collaboration | Via OneDrive or SharePoint co-authoring | Native, multi-user | Native, role-based |
| Mobile access | Excel mobile app | Sheets mobile app | Purpose-built field app |
| Customizable fields | Every cell and formula open | Every cell open | Only what the vendor exposes |
| Share with a link | Through OneDrive/SharePoint | Yes, native | Yes, inside the platform |
| Year-1 cost at 5 users | The purchase price, once | The purchase price, once | Recurring per-seat fees for 12 months |
| Direction-aware scoring (UTB/LTB) | Yes, set per KPI | Yes | Varies by product |
| Scheduling, dispatch, invoicing | No – reporting only | No | Yes, that is their purpose |
Who Should Use This Template
Owner-operators and service managers at residential or commercial pool companies running roughly 2 to 40 technicians, who already collect their numbers somewhere – a field-service app, an accounting package, a route sheet – and want one page that answers whether the month was good. It also suits multi-territory franchises that need every branch reporting an identical scorecard, and aquatics contractors preparing a monthly pack for a facilities client.Swimming Pool Service KPI Dashboard in Excel
It is the wrong tool if you want the workbook to build routes, dispatch technicians, hold customer or pool records, track chemical inventory or raise invoices. It does none of those and connects to no field-service platform. It also does not derive KPIs from raw job tickets – you supply the monthly result per KPI and the workbook does the scoring, the comparison and the ranking.Swimming Pool Service KPI Dashboard in Excel
Real-World Use Cases
Monthly management review. Marisol runs a twelve-route residential company. On the first Monday she picks last month on KPI Dashboard and reads the seven cards. Callback Rate and Water Chemistry Pass Rate sit beside Route Density and Technician Utilization, so the productivity push she made last quarter shows its cost in quality on the same screen.
Supplier and equipment reviews. Devin manages service for a commercial aquatics contractor. Before a quarterly supplier meeting he switches KPI Trend to Filter and Pump Repair Turnaround – twelve months of actual against target and prior year on one chart is the whole agenda item.
Multi-territory comparison. Priya oversees nine franchise territories. Each keeps its own copy with identical KPI Definition rows, so the Top 5 and Bottom 5 lists on KPI Analysis are directly comparable between territories without any normalisation work.
Advantages of the Swimming Pool Service KPI Dashboard in Excel
- Nothing to install or enable. An .xlsx of worksheet formulas opens on a locked-down corporate laptop, on Excel for the web, and on a tablet in a truck.
- The scoring is honest about direction. Five of the fifteen KPIs are lower-is-better. A dashboard that treats them all as higher-is-better inverts safety and cost – this one does not.
- Internally consistent. The group roll-up on KPI Analysis is computed by COUNTIFS over the scorecard’s own status column, so the group counts always reconcile to the summary cards.
- Auditable. Every number traces back through a visible formula to a cell you typed. Nothing is hidden in a query, a measure or a macro.
- Extensible without expertise. Adding a sixteenth KPI is typing a row, not editing a formula.
Opportunities for Improvement
Three things are worth knowing before you buy, and they are worth stating plainly.
YTD is typed, not derived. Each input sheet carries an MTD and a YTD column per month and both are typed values – the workbook does not sum or average MTD into YTD for you. Read Me presents this as a deliberate choice, and it is a defensible one: counts should accumulate while rates and per-unit costs should be running averages, and only you know which is which for your KPIs. But it does mean you maintain two columns per month, and an edit to MTD alone will leave YTD stale.
The Home page KPI count is stale. The Home sheet says the dropdown drives “every one of the 14 KPIs”. The workbook ships 15, and KPI Definition, the input sheets and the scorecard all agree on 15. It is a label, not a calculation – nothing computes off it – but it should say 15.
Two leftovers from the template. The Read Me row that explains cumulative versus average YTD still illustrates the point with aerospace examples (“aircraft deliveries, non-conformance reports”) rather than pool-service ones, and on the Get More Templates sheet the “Need a custom dashboard?” panel has more text than its box height allows, so the closing line is clipped. Both are cosmetic and both are editable text.
Best Practices
- Fix the KPI list before you type any numbers. KPI Definition drives the three input sheets; settling names, units and UTB/LTB there first saves re-keying later.
- Get the direction flag right. It is the single most consequential cell in the workbook. A lower-is-better KPI marked UTB will report a worsening safety or cost result as a success.
- Set the reporting year first. Change cell E3 on KPI Input – Actual before entering data, so the month headers you type against are the right ones.
- Decide your YTD rule per KPI and write it in the definition. Cumulative for counts like Service Visits Completed and Seasonal Contract Renewals; running average for rates like CSAT and Technician Utilization.
- Tune the thresholds to your governance. If your business calls 98% a miss, edit the bands in columns L and U rather than arguing with the colours.
- Keep prior year populated. The Improving vs PY card and the whole year-on-year block are dead without it, and seasonality makes prior year more informative than target for a pool business.
- Store it on OneDrive or SharePoint if more than one person updates it, so co-authoring handles the versioning. Microsoft’s own guidance on co-authoring Excel workbooks covers the setup.
Explore Relevant Templates
- Swimming Pool Service KPI Dashboard in Excel – the template described in this post
- Swimming Pool Service KPI Dashboard in Power BI – a separately built 12-KPI, 4-page edition on the same topic
- Swimming Pool Service KPI Scorecard in Google Sheets – the smaller 10-KPI scorecard family
- Plumbing Business KPI Dashboard in Excel
- Insulation Contractor KPI Dashboard in Excel
- Landscaping Dashboard in Excel – the pivot-and-slicer analytical style, for comparison
More on this blog: WealthTech KPI Dashboard in Excel, Exam Boards KPI Dashboard in Excel and IVF Centers KPI Dashboard in Excel.
Frequently Asked Questions
Which of the three similarly named templates is this?
This is the KPI Dashboard: 15 KPIs, 11 sheets, month picker, KPI Trend page, KPI Analysis page. The KPI Scorecard is a separate, smaller build with 10 KPIs in 5 groups. The analytical dashboards are pivot-and-slicer workbooks that aggregate raw transaction rows. They share a naming convention, not a file.Swimming Pool Service KPI Dashboard in Excel
Is the Power BI edition a port of this workbook?
No – the two were built independently and their KPI lists barely overlap. The Power BI edition tracks 12 KPIs in 9 groups across 4 report pages, and only Chemical Cost per Pool and Days Sales Outstanding appear in both. Power BI adds revenue and margin KPIs (Revenue per Pool per Month, Service Gross Margin %, Repair & Install Revenue Mix %); this Excel edition instead carries CSAT, Customer Retention Rate, On-Time Service Visits, First-Visit Fix Rate, Water Chemistry Pass Rate, Seasonal Contract Renewals and Equipment Install Jobs. Choose on the KPI list, not the logo.Swimming Pool Service KPI Dashboard in Excel
Do I need macros or a Power BI licence?
Neither. It is a formula-only .xlsx – nothing to enable, install or refresh.Swimming Pool Service KPI Dashboard in Excel
How many KPIs can I add?
Up to 22 with no formula work. Read Me explains how to extend past that by filling down the last data row on each sheet and widening the summary-card ranges.Swimming Pool Service KPI Dashboard in Excel
Can I change the traffic-light thresholds?
Yes. They sit in the status formulas in columns L and U on KPI Dashboard; edit them there and the cards, colours and analysis page all follow.
Does it manage schedules, chemicals or invoices?
No. It is a reporting layer that sits on top of whatever you already use for scheduling, dispatch, inventory and billing.Swimming Pool Service KPI Dashboard in Excel
Can I rebrand it for a client report?
Yes – nothing is locked or password protected. Colours, headers, logos, KPI names and thresholds are all editable.Swimming Pool Service KPI Dashboard in Excel
About the Author
Built by PK – Microsoft Certified Professional with 15+ years of Excel, Google Sheets, and Power BI experience. Founder of NextGenTemplates, reaching 300K+ subscribers across YouTube channels. Every template is hand-built and tested before release.Swimming Pool Service KPI Dashboard in Excel
Conclusion
The value of a KPI scorecard is not the arithmetic – it is that fifteen numbers which usually live in five places end up on one page, scored the same way, next to last year. The Swimming Pool Service KPI Dashboard in Excel does that in an .xlsx that opens anywhere, scores lower-is-better KPIs correctly, and hides nothing behind a macro or a query. Set the year, fill three sheets, pick a month.Swimming Pool Service KPI Dashboard in Excel
Get it here: Swimming Pool Service KPI Dashboard in Excel. For more Excel dashboard walkthroughs, visit youtube.com/@PKAnExcelExpert.|