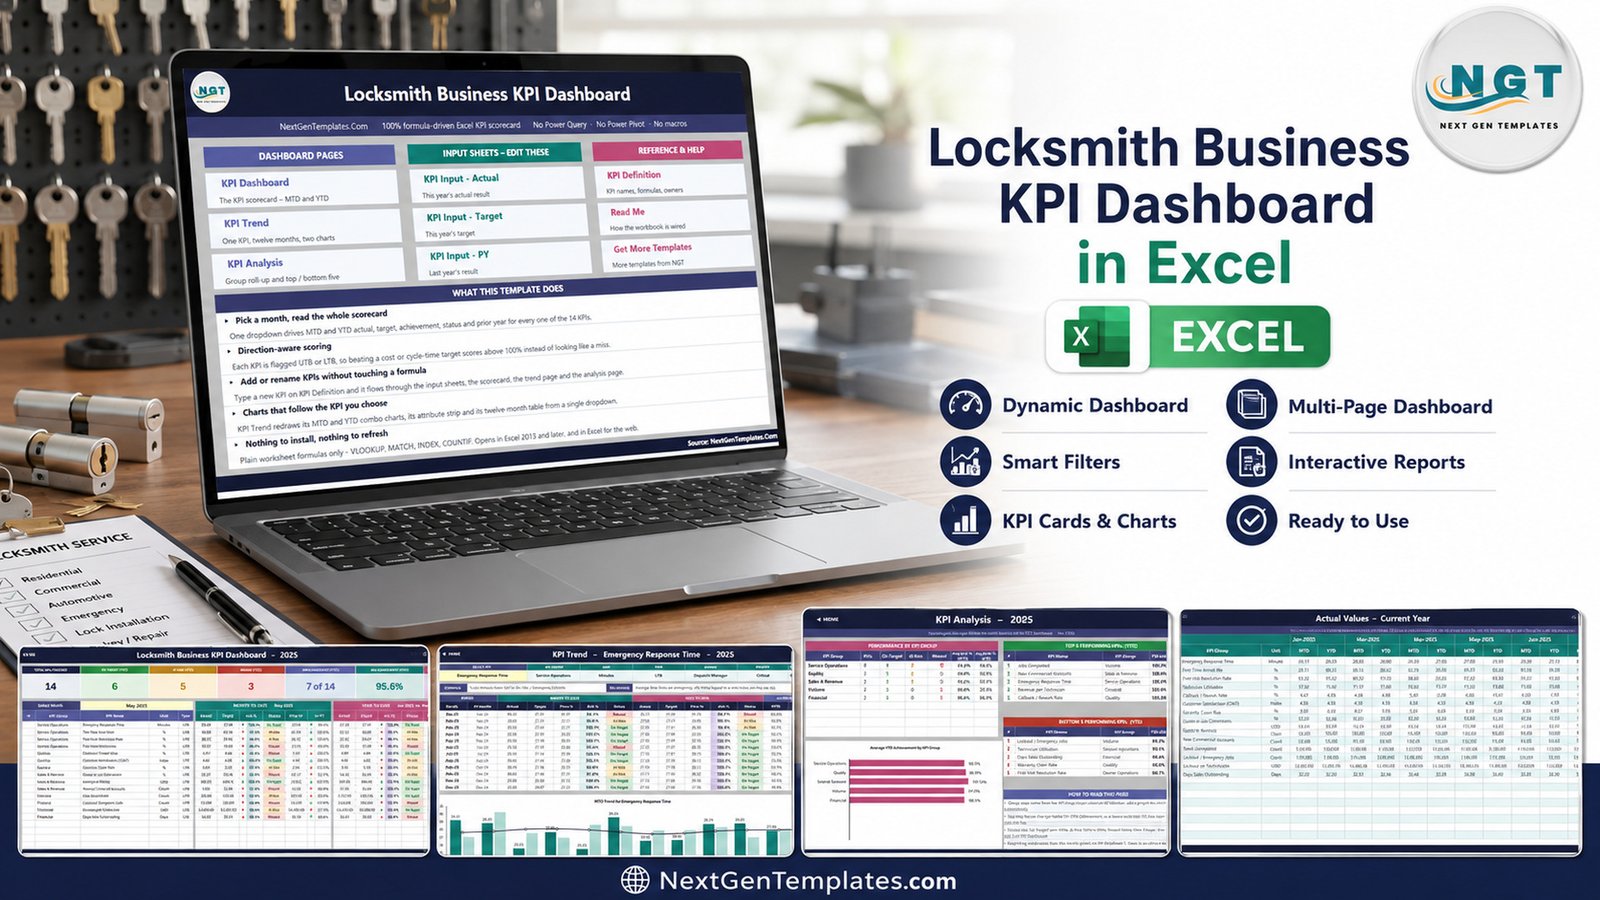
A locksmith business lives or dies on two numbers that almost nobody tracks properly: how long it takes to get a van to an emergency call, and how often the work has to be done twice. Everything else – conversion, average job value, receivables – follows from those. The Locksmith Business KPI Dashboard in Excel puts fourteen of those measures on a single monthly scorecard, driven by one dropdown, with no macros, no Power Query and no add-ins anywhere in the file.
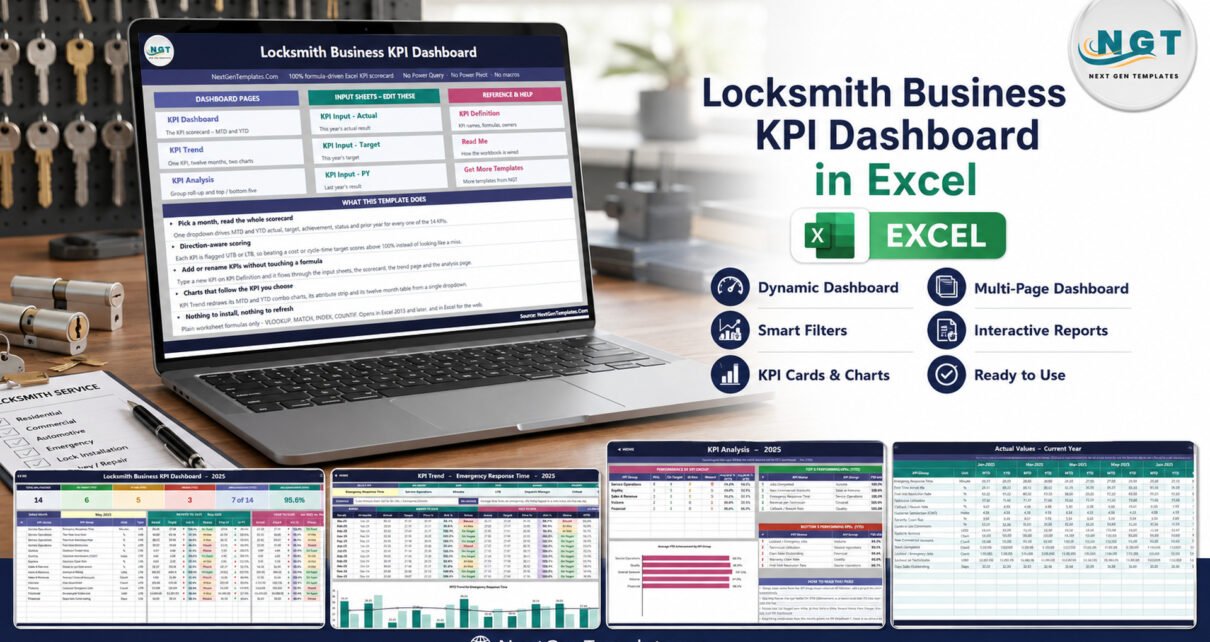
The sample workbook ships with a full year of data. Selecting May 2025 shows 6 KPIs On Target, 5 At Risk and 3 Missed for the year to date, 7 of 14 improving against the prior year, 95.6% average MTD achievement and 98.9% average YTD achievement. Eleven worksheets, 22 KPI rows wired and 14 filled in, and every figure is a plain worksheet formula you can trace with F2.
Key Features of the Locksmith Business KPI Dashboard in Excel
- 14 KPIs in 5 groups – Service Operations (4), Quality (3), Sales & Revenue (3), Volume (2) and Financial (2).
- Month picker on cell D6 of the KPI Dashboard sheet. It lists the twelve months of whatever reporting year you set, and the whole scorecard plus the analysis page follow it.
- MTD and YTD blocks side by side, each with actual, target, achievement %, status, prior year and the vs-PY percentage.
- UTB and LTB typing per KPI, so a lower-is-better measure such as Emergency Response Time is scored as Target / Actual and can legitimately exceed 100%.
- Seven summary cards: Total KPIs Tracked, On Target (YTD), At Risk (YTD), Missed (YTD), Improving vs PY (MTD), Avg Achievement (MTD) and Avg Achievement (YTD).
- Editable thresholds – On Target from 100%, At Risk 95% to 99%, Missed below 95%, held in the formulas in columns L and U.
- Three input sheets – Actual, Target and Prior Year – each carrying an MTD and a YTD column for every month.
- Excel 2013 and later, and it opens in Excel for the web because there is nothing to install or refresh.
Dashboard Pages Explanation
The Locksmith Business KPI Dashboard in Excel is an eleven-sheet workbook, and the Home page groups them into three columns so nobody has to hunt through tabs.
Home
A navigation page with three blocks – Dashboard Pages, Input Sheets and Reference & Help – plus a short “what this template does” panel. It is the page to hand a colleague who has never opened the file.
KPI Dashboard
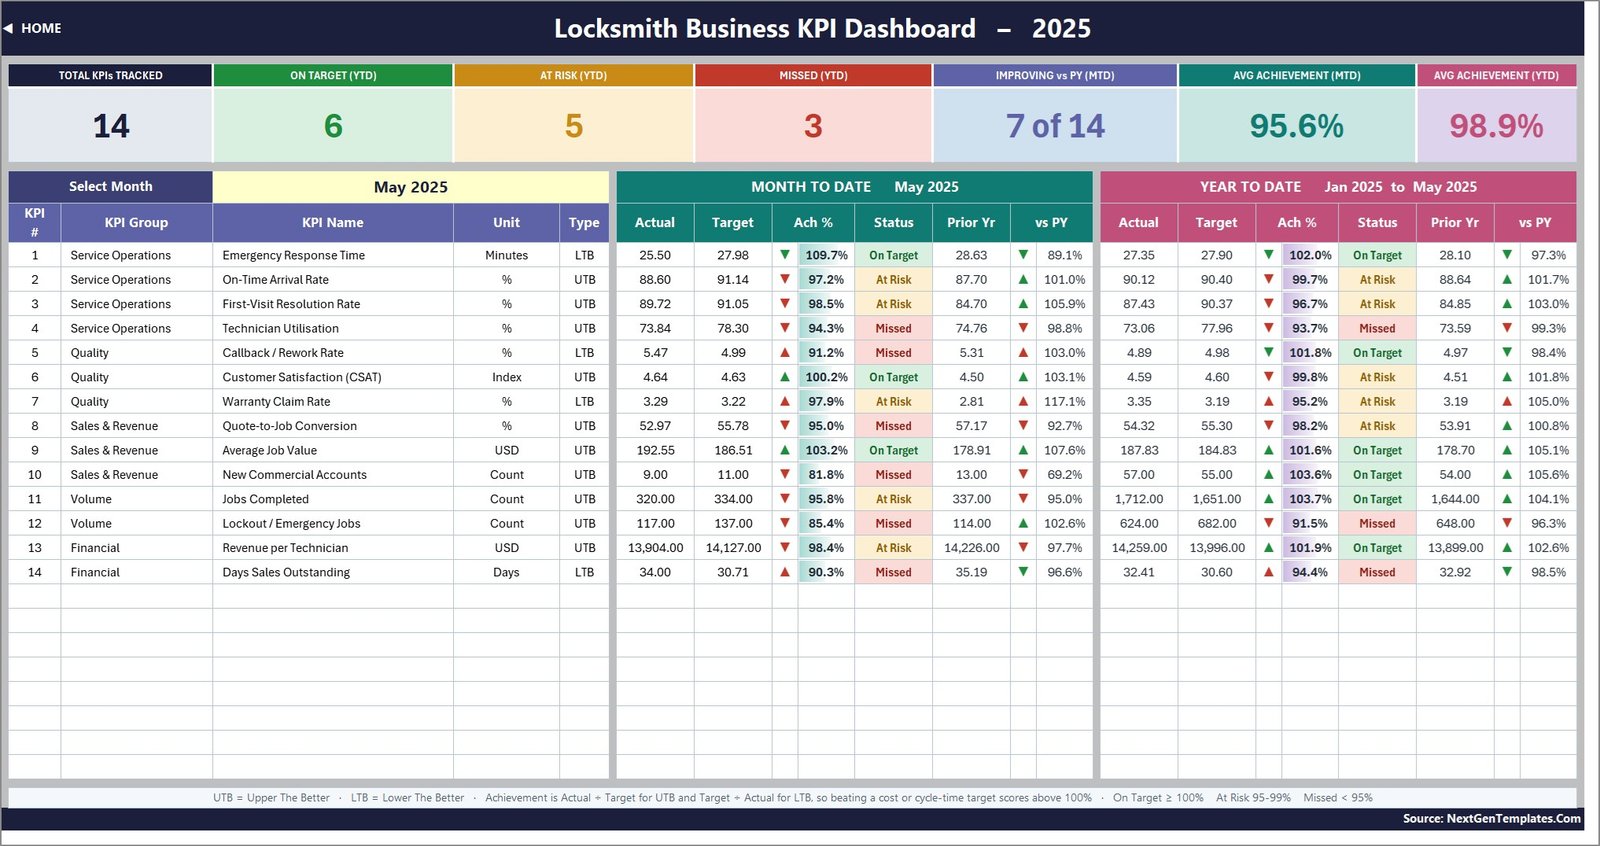
The scorecard. Fourteen rows, one per KPI, with the group, unit and type on the left, then the month-to-date block and the year-to-date block. In the May 2025 sample, Emergency Response Time comes in at 25.50 minutes against a 27.98 target – 109.7% achievement and On Target, because the KPI is typed LTB. Technician Utilisation at 73.84% against 78.30% is Missed, and Average Job Value at $192.55 against $186.51 is On Target. Green up-arrows and red down-arrows show direction against the prior year, coloured by whether that direction is good for the KPI rather than by the raw sign.
KPI Trend

One KPI at a time, chosen in cell B4. The page opens with an attribute strip – group, unit, type, owner, priority, frequency – then the formula and definition straight from the master list, then a twelve-month table carrying MTD and YTD actual, target, prior year, achievement and status. Two combo charts sit underneath: actual and prior-year columns with a target line, one for MTD and one for YTD. For Emergency Response Time the sample runs from a Missed 94.7% in January to On Target months from March onward, with a dip back to 93.6% in June.
KPI Analysis

Everything on this page follows the month picked on the scorecard. Performance by KPI Group counts On Target, At Risk and Missed per group and shows average MTD and YTD achievement; a bar chart repeats the YTD figure. Alongside it sit the top five and bottom five KPIs on year-to-date achievement. In the sample the top five open with Jobs Completed at 103.7% and New Commercial Accounts at 103.6%, while the bottom five open with Lockout / Emergency Jobs at 91.5% and Technician Utilisation at 93.7%. A “how to read this page” panel explains the ranking and the thresholds.
KPI Input – Actual, Target and PY
Three sheets with identical layouts: KPI number, group, name and unit down the left, then an MTD and a YTD column for each of the twelve months. Cell E3 on the Actual sheet is the first month of the reporting year; change it and the Target sheet, the Prior Year sheet, the month dropdown and every sheet title re-base themselves. Storing YTD explicitly rather than deriving it means you keep control of whether a measure accumulates or averages.
KPI Definition, Read Me and Get More Templates
KPI Definition is the master list – number, group, name, unit, formula, definition, type, owner, priority and frequency for all fourteen KPIs, with dropdowns for UTB/LTB, priority and frequency. Every other sheet reads from it. Read Me documents the wiring in four short tables, and Get More Templates links out to the rest of the catalogue.
Excel vs. Google Sheets vs. Paid Field Service Software – Feature Comparison
| Feature | This Excel dashboard | Google Sheets edition | ServiceTitan / Jobber style software |
|---|---|---|---|
| Cost | $12.99 one time | $8.99 one time | $99-$400 per user per month |
| Platform | Excel 2013+ and Excel for the web | Any browser | Cloud, vendor hosted |
| Setup time | Under an hour | Under an hour | Weeks, plus onboarding |
| Real-time team collaboration | Via OneDrive or SharePoint | Native | Native |
| Mobile access | Excel mobile app | Browser and app | Full mobile app |
| Customisable KPIs | Yes – 22 rows wired | Yes | Only what the vendor exposes |
| Share with a link | OneDrive link | Sheet link | Per-seat login |
| Year-1 cost at 5 users | $12.99 | $8.99 | $5,900+ |
| Dispatch and invoicing | No – reporting only | No | Yes |
| File ownership | Permanent | Permanent | Ends with the subscription |
Who Should Use This Template
It fits a locksmith firm with roughly two to twenty technicians that already records job counts and revenue somewhere and wants one management page rather than four exports. Owner-operators reporting to a lender or franchisor, operations managers running a Monday review, and firms holding property-management contracts that must evidence response times all get value from it on day one.
It is the wrong tool if you want live dispatch, scheduling, invoicing or GPS tracking – none of that exists here. There is no automatic CRM import either; the three input sheets are typed or pasted monthly.
Real-World Use Cases
Quarterly evidence for a commercial account. A six-van 24/7 firm keeps Emergency Response Time and On-Time Arrival Rate on the trend page and drops the twelve-month chart into the client’s quarterly review pack.
The Monday operations huddle. An operations manager picks last month on the scorecard, reads the bottom-five list on the analysis page, and walks into the huddle with the two Missed KPIs already identified.
Pricing the next tender. A two-technician mobile locksmith checks Quote-to-Job Conversion and Average Job Value before quoting a property-management contract, so the price reflects what actually converts.
Advantages of the Locksmith KPI Dashboard
- Genuinely formula-driven. No macro prompt, no data model, no refresh button, so it opens on a locked-down laptop and in the browser.
- Direction-aware scoring. Cost and cycle-time KPIs are not penalised for improving, which is the single most common flaw in home-made scorecards.
- Extensible without formula work. Eight spare KPI rows are already wired; a fifteenth KPI is a typed row on KPI Definition, nothing else.
- Owner and priority fields on every KPI, so the scorecard doubles as an accountability list.
- Explicit YTD. Because year-to-date is stored, not derived, a compliance rate does not silently sum to 1,100% by December.
Opportunities for Improvement
Two things are worth saying plainly. First, the Read Me sheet’s “cumulative or average YTD” note still uses examples from the template family it was cloned from – “aircraft deliveries, non-conformance reports” – rather than locksmith examples. The rule it states is correct and the workbook behaves accordingly; only the illustration is off-trade. Second, the product artwork badges “Smart Filters” and “Interactive Reports”, while the workbook’s actual controls are two dropdowns – the month on KPI Dashboard and the KPI on KPI Trend. There are no slicers and no report-builder.
Beyond that, the model covers one reporting year plus the prior year, so multi-year rolling comparison needs a second copy. Targets are typed per month rather than generated from a growth rate. Reporting is company-level: there is no per-technician or per-branch breakdown. And because there are no macros, exporting or emailing the scorecard is a manual Save As PDF.
Best Practices
- Set the year first. Change cell E3 on KPI Input – Actual before typing anything; every header and title re-bases from it.
- Decide accumulate or average per KPI before filling the YTD column. Counts accumulate; rates, indices and per-unit values average.
- Set thresholds once, then leave them. Moving the 95% and 100% cut-offs mid-year makes month-to-month status meaningless.
- Fill the owner column. A KPI with no named owner never improves.
- Review the bottom five, not the average. The headline achievement figure hides the two measures that need action.
- Keep a copy per year and archive the finished one, so the prior-year sheet always has clean data to point at.
Explore Relevant Templates
- Locksmith Business KPI Dashboard in Power BI – the same fourteen KPIs as an interactive .pbix report.
- Locksmith Business KPI Scorecard in Excel – the lighter ten-KPI single-page version.
- Pest Control Business KPI Dashboard in Excel – the same engine tuned for pest control.
- Septic Tank Service KPI Dashboard in Excel and Swimming Pool Service KPI Dashboard in Excel – neighbouring field-service trades.
- Fencing Contractor KPI Dashboard in Excel – another contractor build on the same layout.
Frequently Asked Questions
Does the Locksmith Business KPI Dashboard in Excel need macros?
No. It is built entirely from VLOOKUP, MATCH, INDEX and COUNTIF, so there is no macro warning, no data model and no refresh step. That is also why it works in Excel for the web.
Can I add my own KPIs?
Yes. The sheets are wired for 22 KPI rows and 14 are used. Fill the next empty row on KPI Definition and the name appears on the three input sheets, the scorecard, the trend dropdown and the analysis page.
How do the dropdowns work?
They are ordinary data-validation lists pointing at helper ranges, not form controls – see Microsoft’s guide to drop-down lists if you want to extend them.
What is included in the download?
A ZIP holding the .xlsx workbook and the Excel KPI Dashboard user manual PDF. Nothing is locked, hidden or password protected.
Is the sample data real?
No. It is realistic sample data for a mid-sized locksmith firm across 2025 with 2024 comparatives, included so every card, chart and traffic light can be seen working before you replace it.
Which Excel version do I need?
Excel 2013 or later on Windows or Mac. It also opens in Excel for the web and in the Excel mobile app, although the charts read best on a desktop screen.
About the Author
Built by PK – Microsoft Certified Professional with 15+ years of Excel, Google Sheets, and Power BI experience. Founder of NextGenTemplates, reaching 300K+ subscribers across YouTube channels. Every template is hand-built and tested before release.
Conclusion
The Locksmith Business KPI Dashboard in Excel does one job well: it turns a month of locksmith operating data into a scorecard an owner can read in two minutes, with a trend page for the KPI under discussion and an analysis page that names the worst five. It will not dispatch a van or raise an invoice, and it does not pretend to. If you already have the numbers and want a management view you own outright, it is an afternoon’s setup.
Get it from NextGenTemplates for $12.99 instead of $19.99, and subscribe to youtube.com/@PKAnExcelExpert for Excel dashboard tutorials.