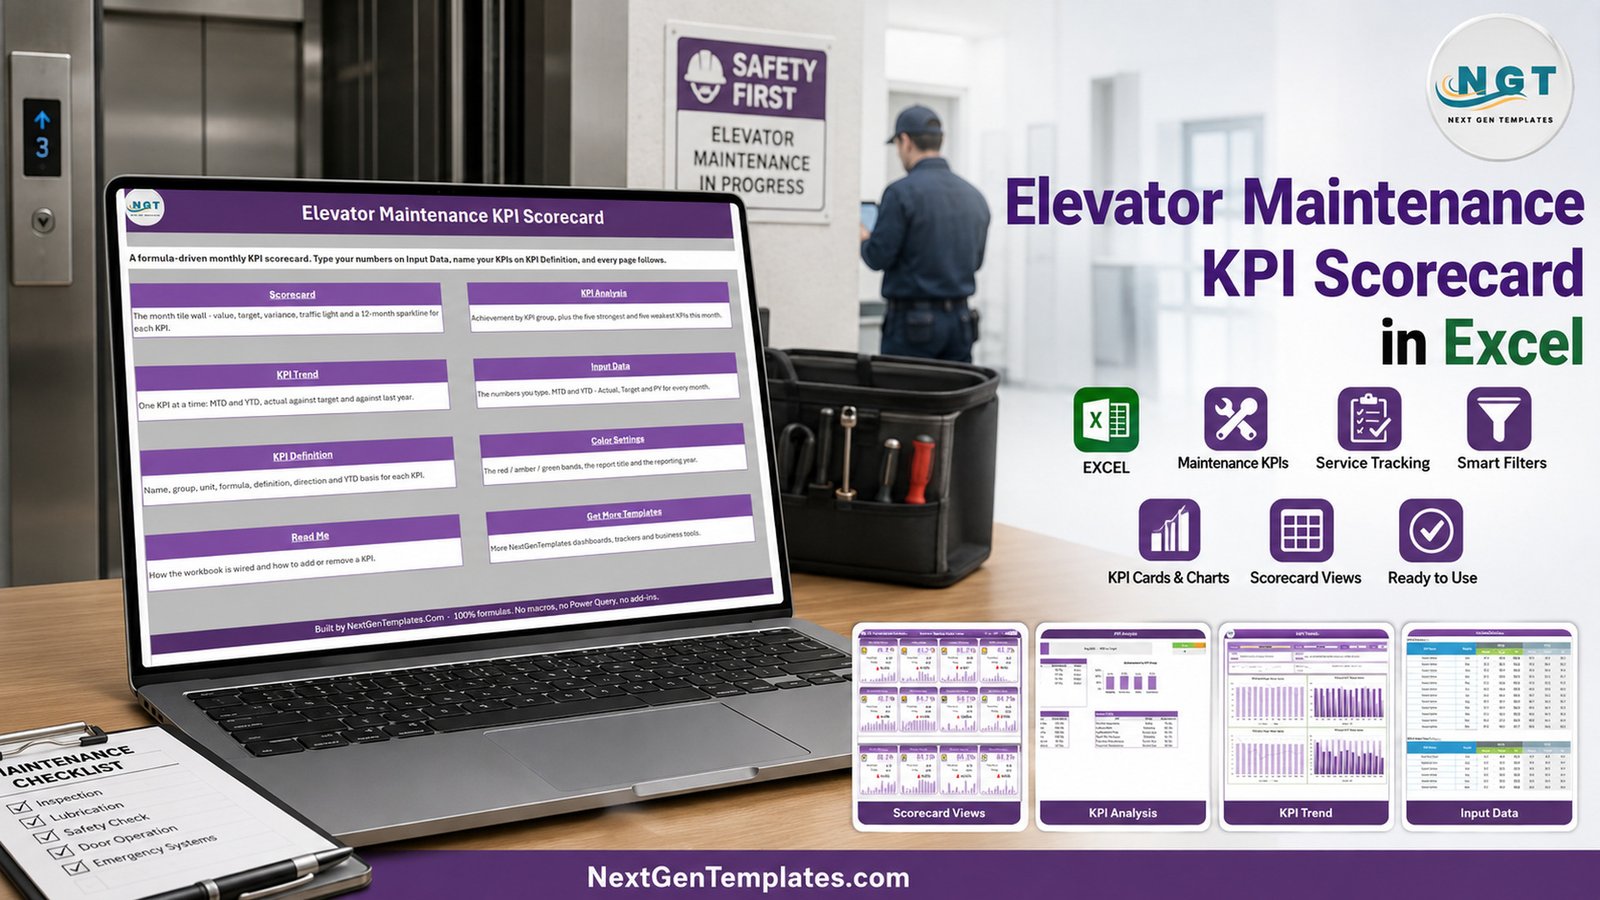
The Elevator Maintenance KPI Scorecard in Excel brings 10 monthly service indicators into one formula-driven workbook. Its scorecard combines red/amber/green traffic lights, MTD and YTD modes, target and prior-year comparisons, 12-month sparklines and a KPI range selector. Separate Analysis and Trend sheets help managers move from the status view to group results and individual KPI patterns. No macros, add-ins or Power Query are required. The template is designed for management reporting; it does not replace inspections, statutory records, engineer certification, alarms or qualified maintenance systems.
Key Features of the Elevator Maintenance KPI Scorecard in Excel
- Ten preconfigured measures: Elevator Uptime, Mean Time To Repair, Callback Rate, Preventive Maintenance, Average Response Time, First-Time Fix Rate, Entrapment Incidents, Safety Compliance, Overdue Inspections and Contract Renewal Rate.
- Four KPI groups: Reliability, Service Ops, Safety and Commercial.
- Month-by-month reporting: select the reporting month from the header.
- MTD/YTD choice: switch the entire scorecard between the two bases.
- Target/PY choice: compare the selected actual with target or the same period last year.
- Direction-aware status: upper-the-better and lower-the-better measures use the correct comparison direction.
- Adjustable RAG bands: edit the threshold bands on Color Settings.
- Expandable structure: the workbook provides space for 20 KPIs and displays 10 at a time.
Workbook Pages Explained
Home
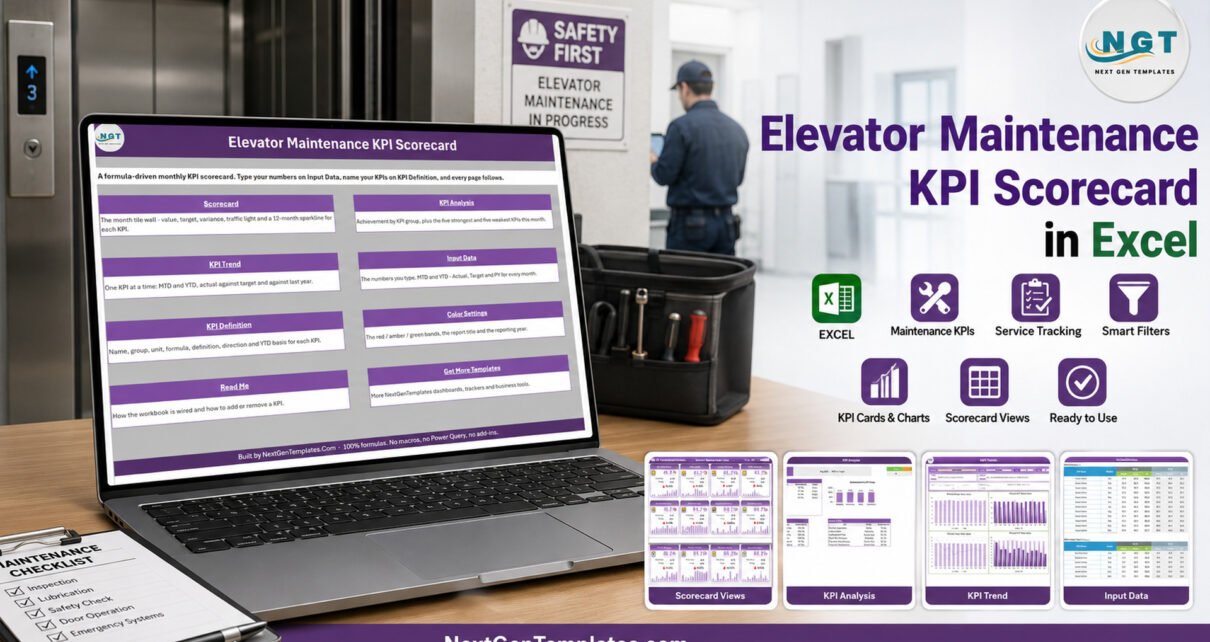
The Home sheet is both an index and a compact guide. It links to Scorecard, KPI Analysis, KPI Trend, Input Data, KPI Definition, Color Settings, Read Me and Get More Templates. A note at the bottom confirms that the file is formula driven and uses no macros, Power Query or add-ins.

Scorecard
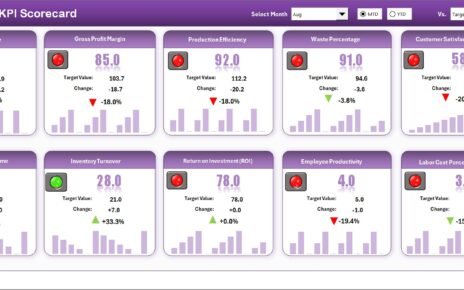
The main Scorecard displays ten tiles. Every tile combines actual value, comparison value, absolute change, percentage change, directional arrow, traffic light and a 12-month sparkline. The sample month of August 2025 shows four green, four amber and two red cards; these are sample values, not industry benchmarks.
KPI Analysis
KPI Analysis summarises achievement by group and lists the five highest and five lowest KPI achievements for the selected month. That gives a management meeting a useful sequence: identify the overall mix, see which group needs attention, and then open the trend page for a specific measure.

KPI Trend
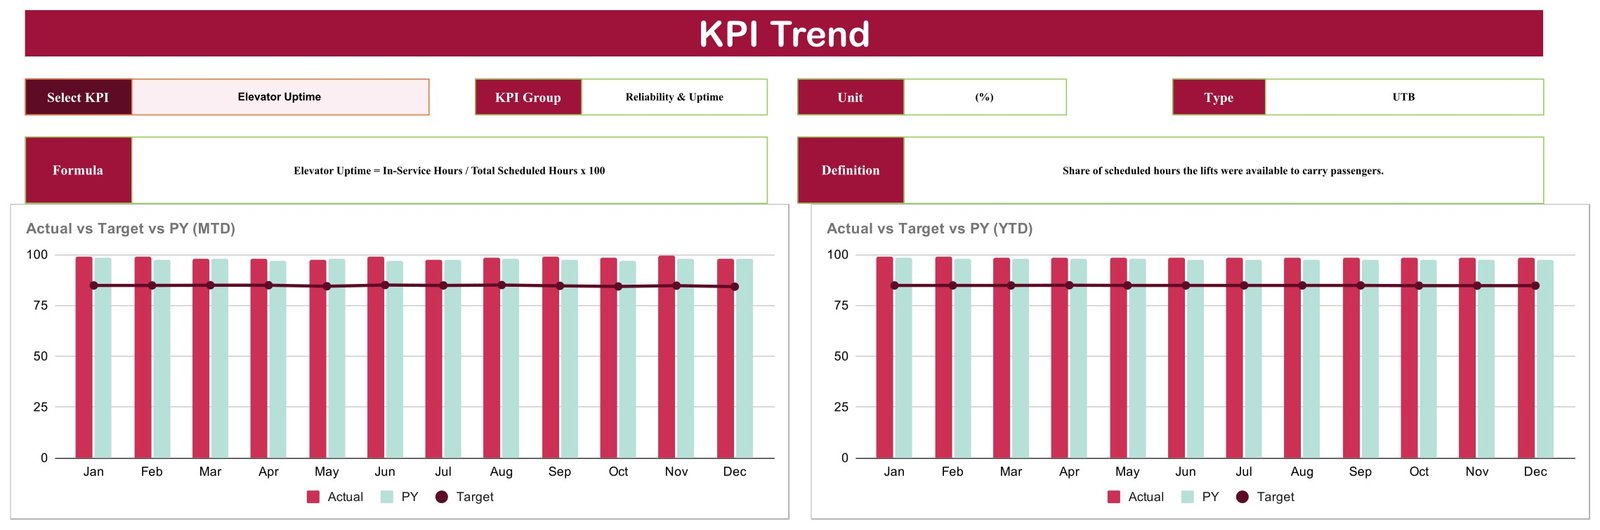
Select one KPI to display its definition, formula, unit, direction and four charts: MTD Actual vs Target, MTD Actual vs PY, YTD Actual vs Target and YTD Actual vs PY. The page presents 12 months together so a reader can distinguish a one-off miss from a recurring pattern.

Input Data
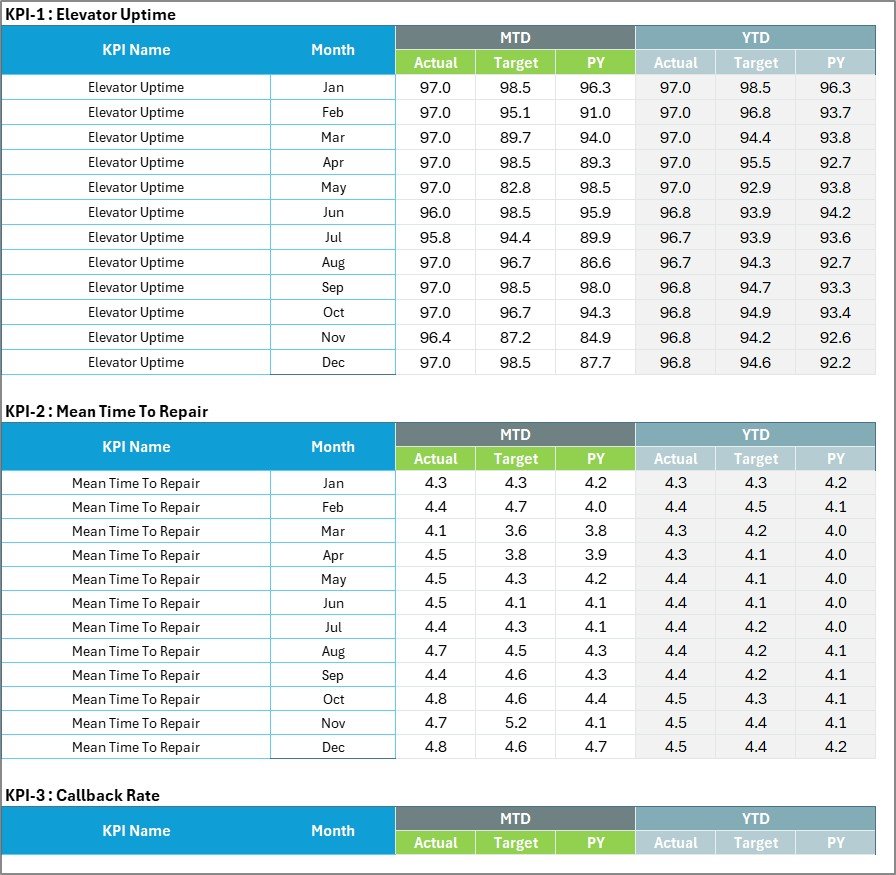
Input Data is where monthly values are typed. Each KPI block has 12 rows and six value columns: MTD Actual, Target and PY, followed by YTD Actual, Target and PY. The workbook deliberately asks for finished YTD figures because sums, averages and business-specific roll-ups are not interchangeable.
KPI Definition
KPI Definition documents name, group, unit, formula, definition, type and YTD basis. The built-in definitions are a starting structure for monthly reporting, not official standards. Review every formula and term against your contracts, policies and approved data sources before using the workbook in a formal review.

Color Settings and Read Me
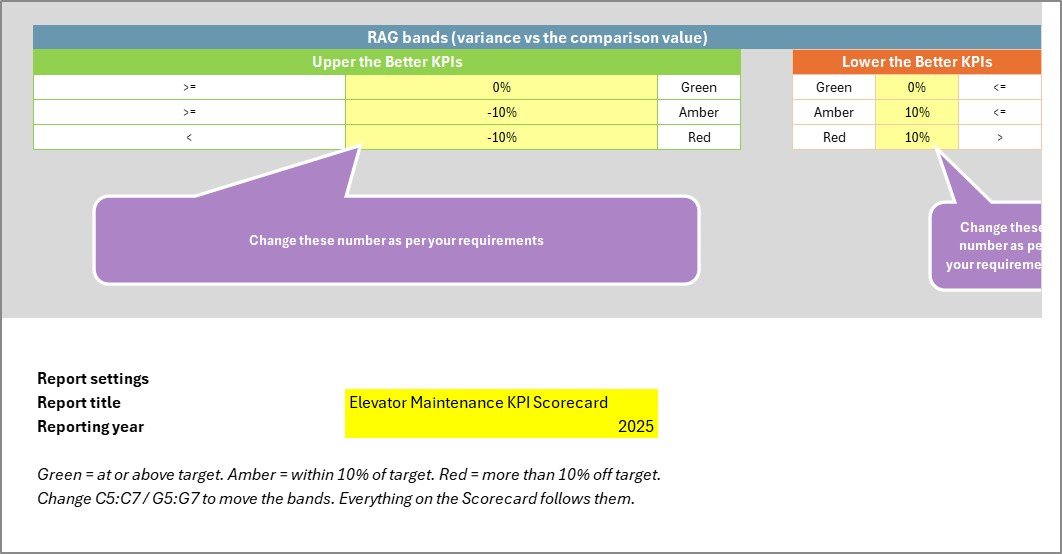
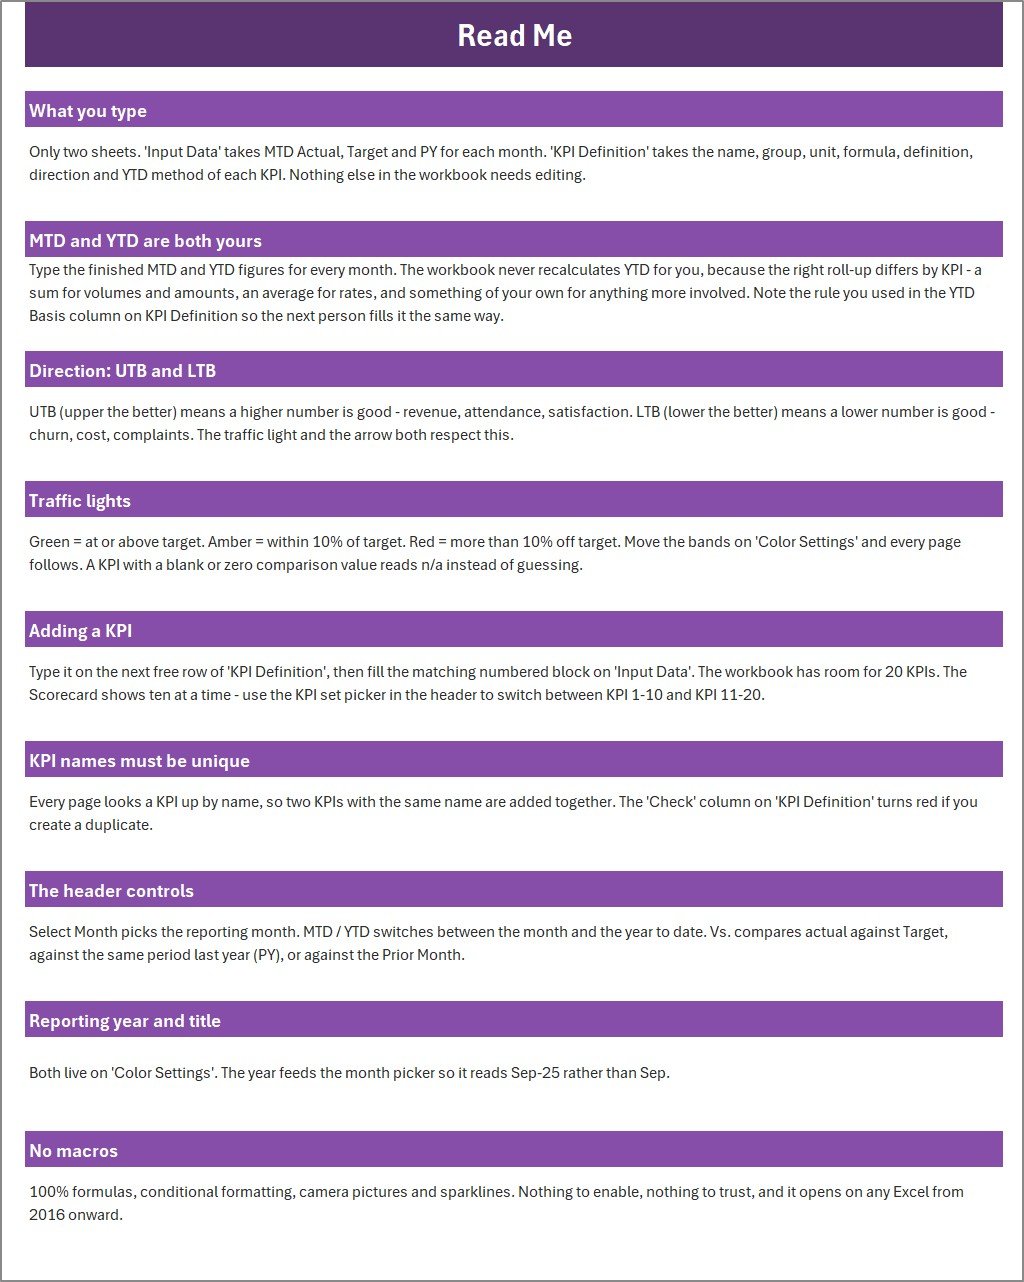
Color Settings holds the report title, year and RAG bands for both KPI directions. Read Me explains what users type, why YTD is supplied rather than inferred, how UTB/LTB works, how to add KPIs and how the scorecard header controls behave.
Elevator Maintenance KPI Scorecard in Excel vs. Google Sheets vs. Field-Service SaaS – Feature Comparison
| Area | Excel scorecard | Google Sheets scorecard | Field-service SaaS |
|---|---|---|---|
| Commercial model | One-off template price | One-off template price | Usually recurring subscription |
| Primary environment | Excel desktop | Web browser and Sheets app | Vendor platform |
| Real-time collaboration | Possible through supported Microsoft cloud workflows | Native Sheets sharing | Usually included |
| KPI editing | Transparent and editable | Transparent and editable | May depend on plan |
| RAG status | Yes, buyer-set bands | Yes, template-specific | Usually configurable |
| Automated source integration | No | No | May be available |
| Dispatch, alerts and inspections | No | No | Product-specific |
Who Should Use This Template
Elevator service companies can use it as a monthly management layer after their approved job and maintenance systems have produced the source figures. Facilities teams can use it to organise contractor-reported performance for portfolio reviews. Operations analysts can adapt KPI names and thresholds to an existing governance pack.
It is not suitable as a source of inspection evidence, a maintenance schedule, an alarm console, a predictive model or a certification system. Even where a built-in KPI uses words such as safety or inspections, the spreadsheet only reports the values entered by the user. Qualified professionals and designated systems remain responsible for maintenance decisions and required records.
Real-World Use Cases
Regional service review
A service manager enters approved monthly results and uses the red cards to structure the meeting. KPI Trend then shows whether a miss is isolated or has appeared over several months.
Contract performance discussion
A facilities manager records the figures supplied by the contractor, keeps the service-review summary in Excel and retains inspection certificates and technical evidence in the organisation’s controlled repository.
Definition harmonisation
An operations analyst uses KPI Definition to document precisely what each team means by uptime, callback rate or response time before comparing branches.
Advantages of This Excel KPI Scorecard
The strongest advantage is transparency. Inputs, formulas, definitions and thresholds remain visible rather than hidden behind a subscription interface. The month, basis and comparison controls make one workbook useful across several meeting questions. The no-macro design also reduces setup friction: open the file in Excel 2016 or later and start replacing sample values.
The Excel edition is a natural choice for teams that already assemble monthly reports in Microsoft Office. If browser collaboration matters more, the Google Sheets edition offers a closely related workflow.
Opportunities for Improvement
The template does not import from a CMMS, ticketing system or IoT platform. Monthly values are manual. It does not calculate YTD automatically, because the appropriate roll-up differs by KPI. It also does not create reminders, dispatch technicians, store inspection documents or produce equipment-level histories. Those limitations are intentional boundaries, but buyers needing automation should consider a dedicated service platform.
Best Practices
- Agree definitions first. Confirm the formula, unit, direction and YTD basis for each KPI.
- Use governed sources. Enter values only after they have been checked in the responsible operational system.
- Set thresholds deliberately. Red/amber/green bands should reflect management policy, not the sample file.
- Keep evidence elsewhere. Do not attach legal meaning to a traffic light; retain inspections and certifications in approved systems.
- Protect formulas. Save a clean master copy before adapting the workbook.
- Review trends with context. Investigate data quality and operating conditions before drawing conclusions from one card.
For general workbook collaboration guidance, see Microsoft’s guidance on Excel co-authoring.
Explore Relevant Templates
Read the related Elevator Maintenance Checklist in Excel article for a task-oriented format, or compare the broader Aviation Maintenance KPI Dashboard in Excel example. Browse the Excel templates archive and dashboard articles for more spreadsheet approaches.
On NextGenTemplates, related products include the Facility Services Dashboard in Excel, Maintenance Work Order Data Entry System, HVAC Contractor KPI Scorecard in Excel and Equipment Maintenance Management System Web App.
Frequently Asked Questions
Does the scorecard use macros?
No. It uses formulas, conditional formatting, camera pictures and sparklines.
Which Excel versions are supported?
The workbook’s Read Me states Excel 2016 onward.
How many KPIs can I maintain?
Ten are included, with room for up to 20. The Scorecard shows KPI 1-10 or KPI 11-20.
Can it compare actuals with last year?
Yes. Change the comparison control from Target to PY and use either MTD or YTD.
Does it calculate maintenance compliance?
No. It displays the values and formulas configured by the buyer. It does not inspect source evidence or determine legal compliance.
Does it replace elevator maintenance or safety software?
No. It is a monthly management-reporting workbook without inspections, alarms, dispatch, certifications or predictive functions.
What is in the download?
The ZIP contains the Excel workbook and the Excel KPI Scorecard User Manual.
About the Author
Built by PK – Microsoft Certified Professional with 15+ years of Excel, Google Sheets, and Power BI experience. Founder of NextGenTemplates, reaching 300K+ subscribers across YouTube channels. Every template is hand-built and tested before release.
Conclusion
The Elevator Maintenance KPI Scorecard in Excel is a clear fit when a team already has trustworthy monthly source figures and wants an editable, repeatable review workbook. It makes KPI status, comparisons, trends and definitions easier to discuss without pretending to be an operational safety system.
View the Elevator Maintenance KPI Scorecard in Excel on NextGenTemplates, and visit PK-AnExcelExpert on YouTube for practical Excel tutorials.
Last updated: 10 September 2026.