Farm supply chain reporting often starts as a practical Excel problem: orders sit in one file, supplier notes in another, fulfillment updates somewhere else, and quality performance only gets discussed after a delay. The Farm Supply Chains Dashboard in Excel turns that messy reporting cycle into a structured workbook with dashboard pages for suppliers, farm supply movement, fulfillment, product quality, and sample data review.
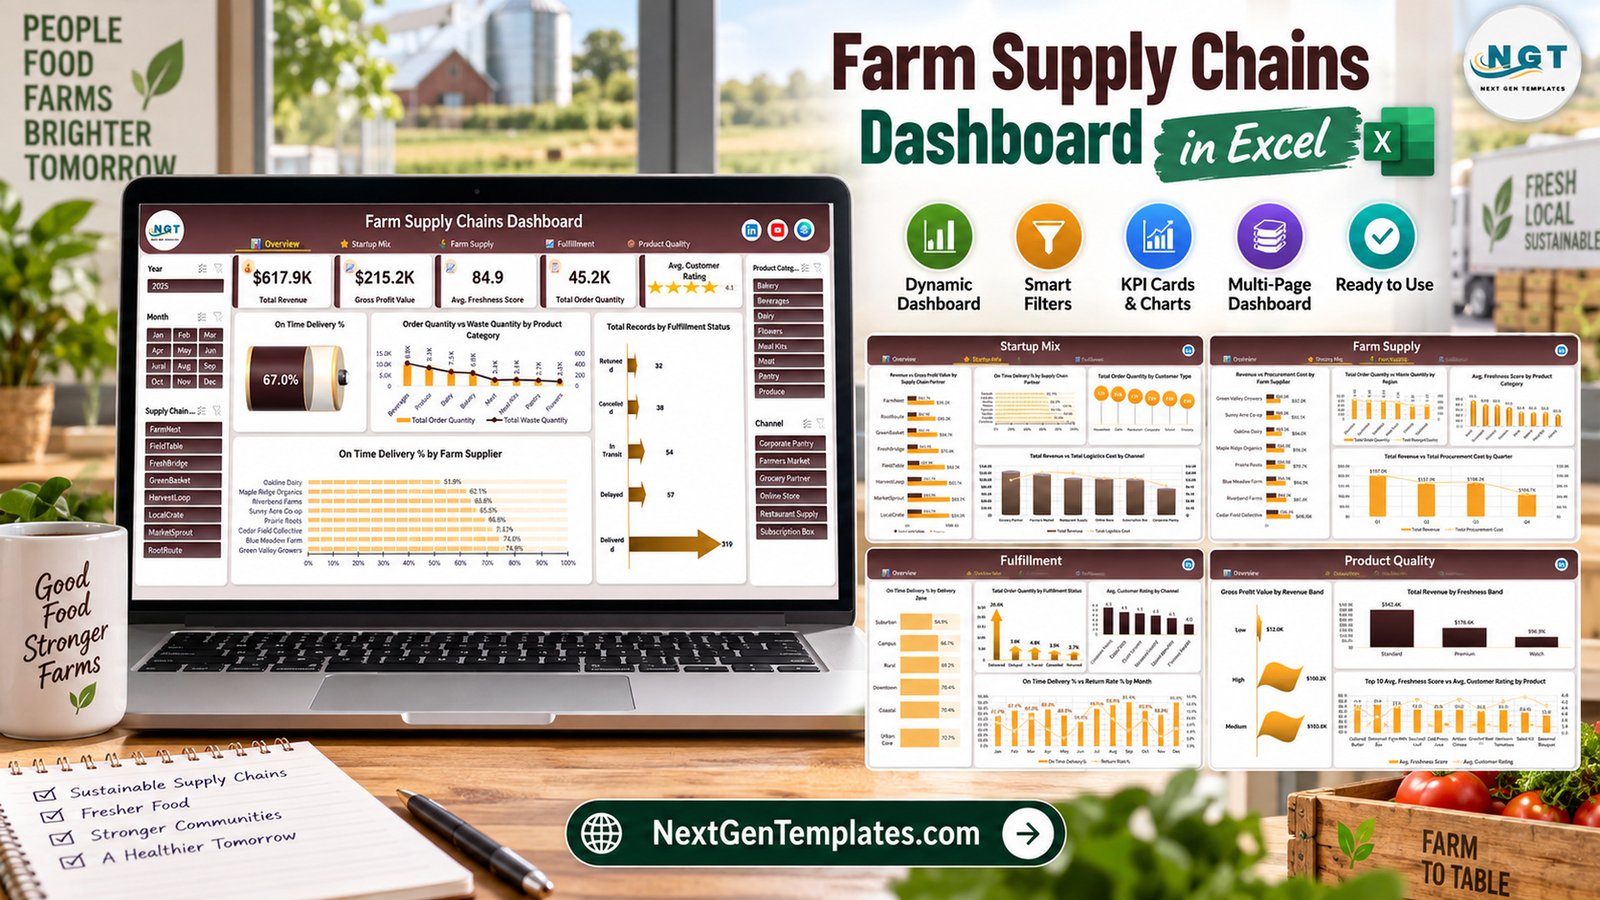
This template is designed for agri procurement teams, farm operations analysts, distributors, food supply coordinators, and consultants who want a ready dashboard without building every chart from scratch. It is an Excel reporting template, not an ERP system, so it works best when you need a clear analytical layer over data you already maintain.
Key Features of Farm Supply Chains Dashboard in Excel
The workbook focuses on the practical questions farm supply teams ask every week: what volume moved, where profit is changing, which categories are active, how fulfillment is performing, and whether product quality is trending in the right direction. It includes KPI cards, charts, side navigation, a visible data sheet, and multiple dashboard pages.
Dashboard Pages Explanation
Main Dashboard
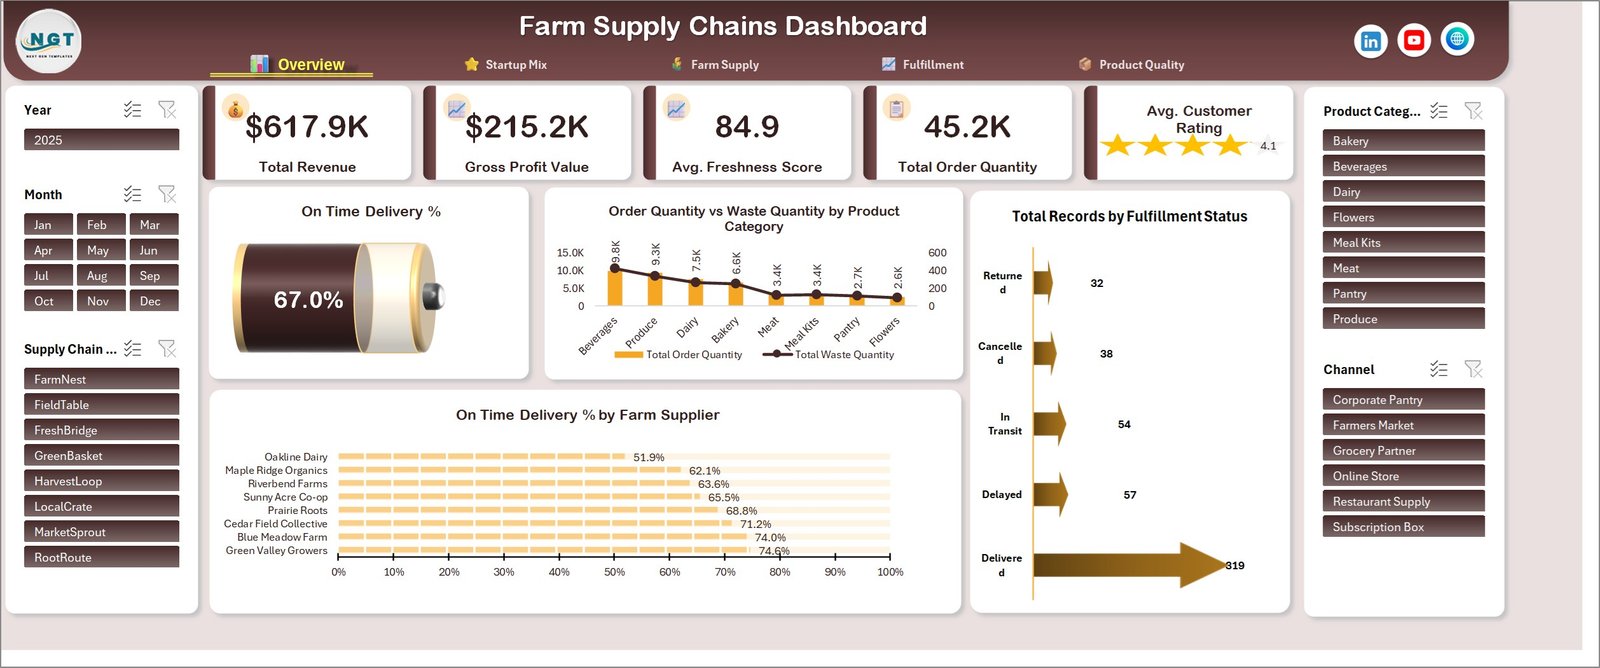
The main page summarizes total order quantity, total profit, average production quantity, average customer rating, and order status. It is the best first screen for management review.
Startup Mix
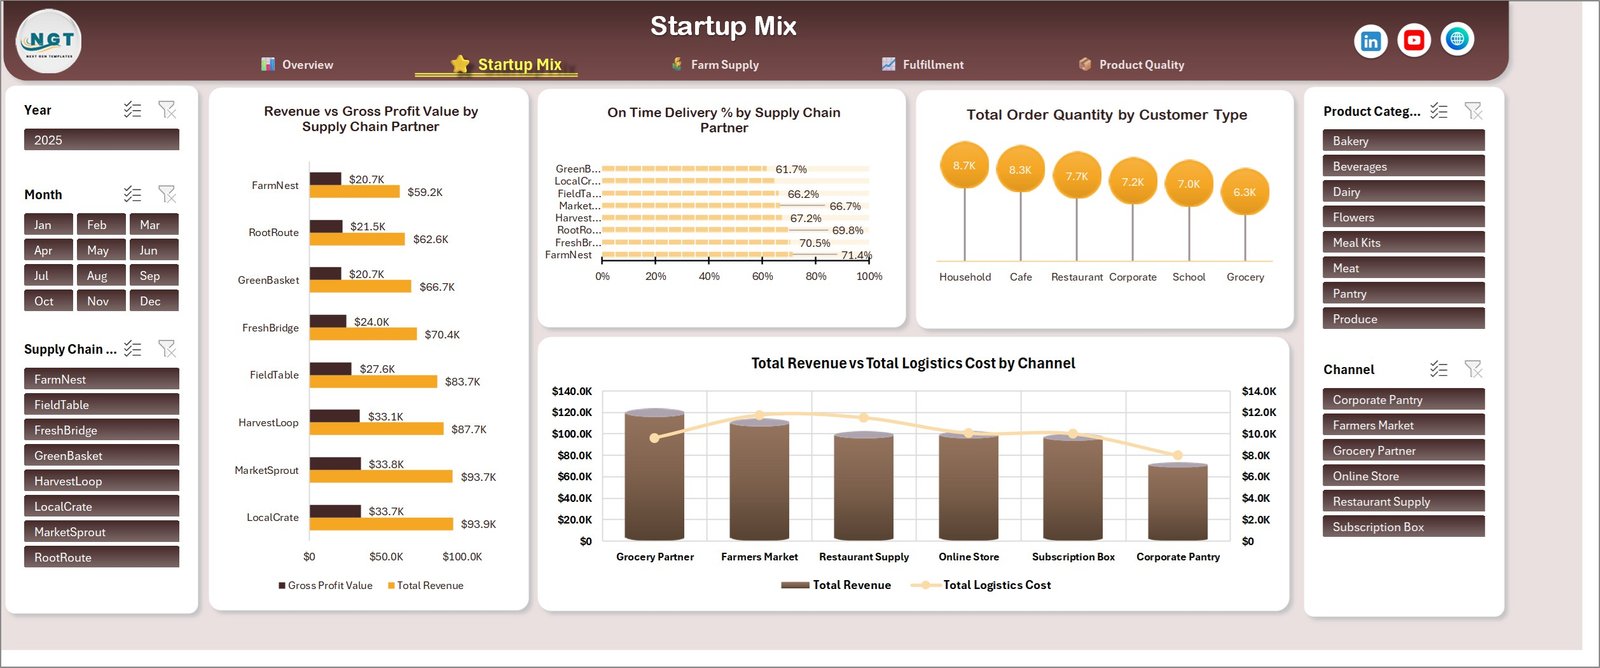
The startup mix page helps compare product, channel, and category contribution using clean Excel charts.
Farm Supply
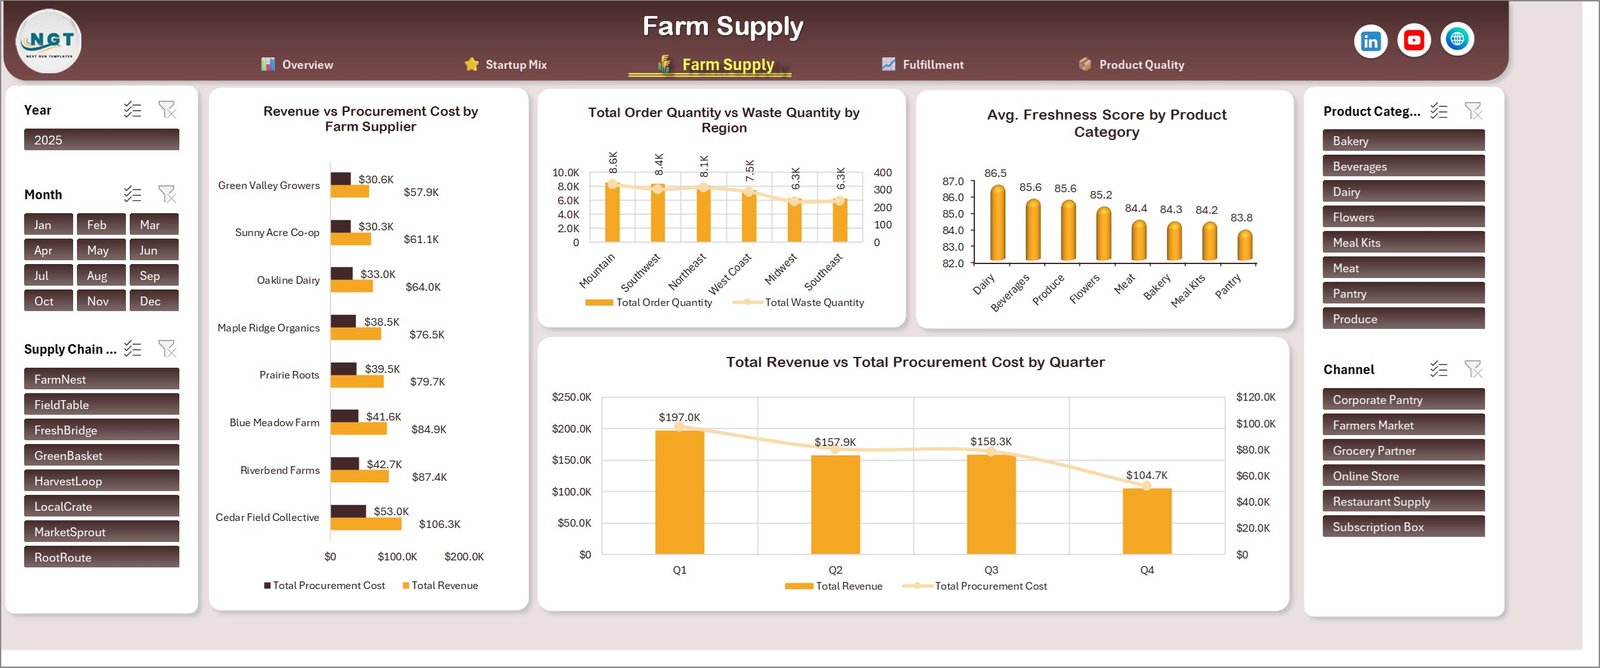
The farm supply page concentrates on procurement and supply movement patterns, including quantity and production views.
Fulfillment
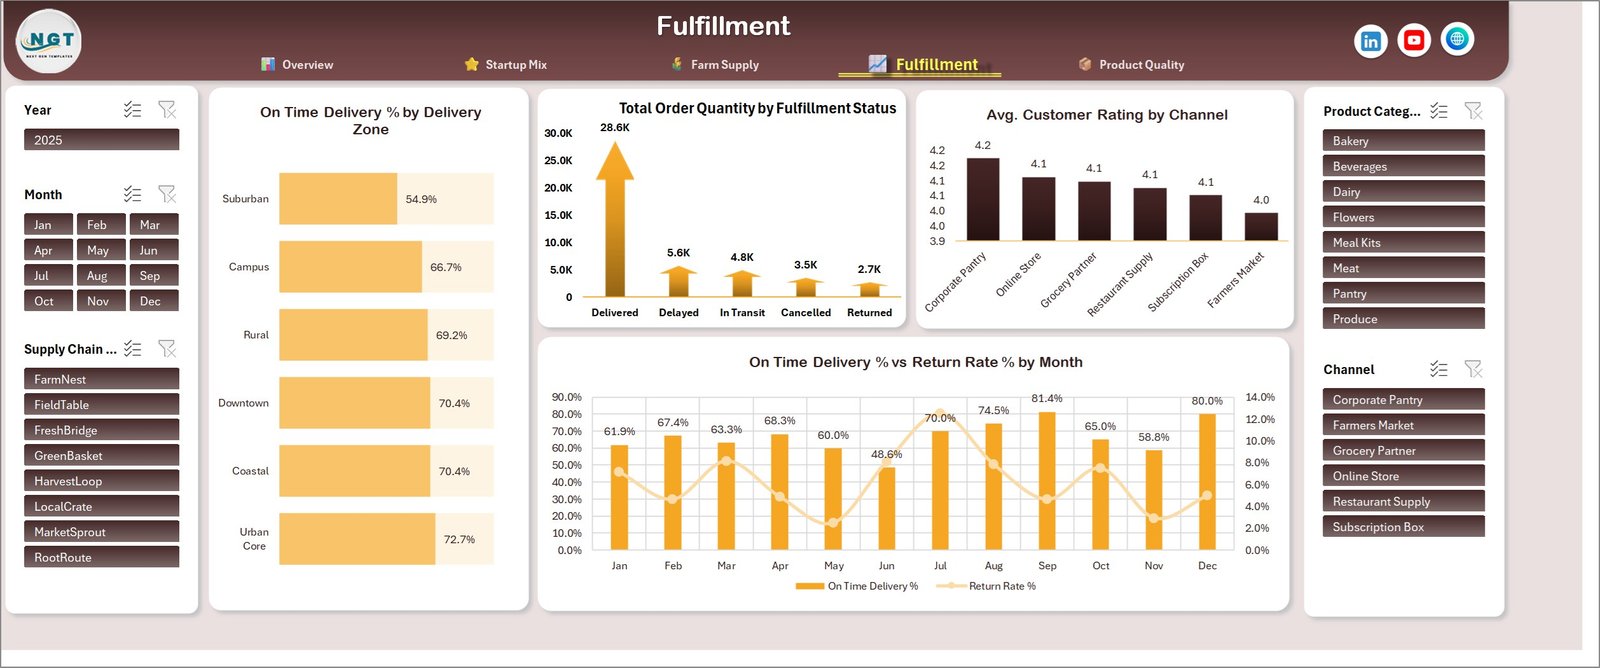
The fulfillment page supports operational review by showing delivery quantity and customer rating patterns.
Product Quality
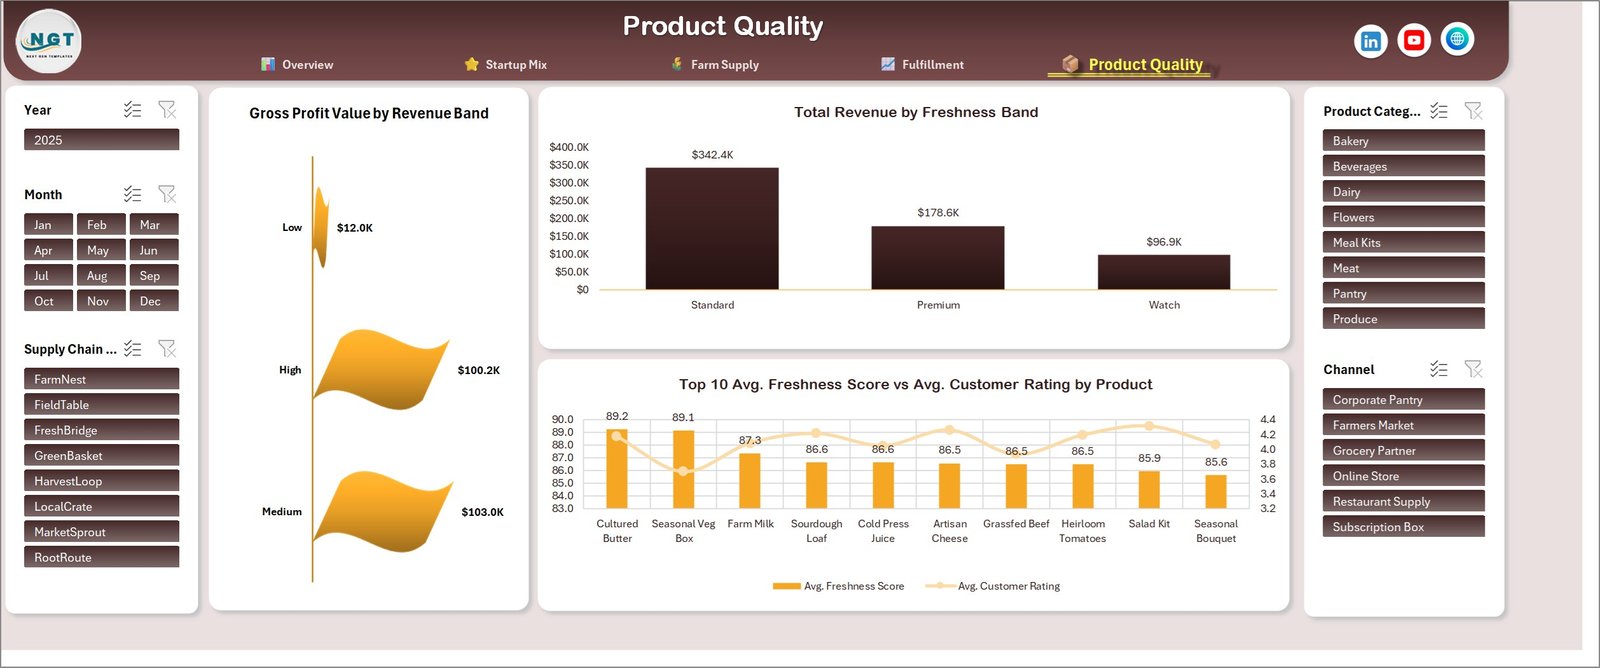
The product quality page gives a focused view of quality metrics and product-level comparison.
Data and Summary Views

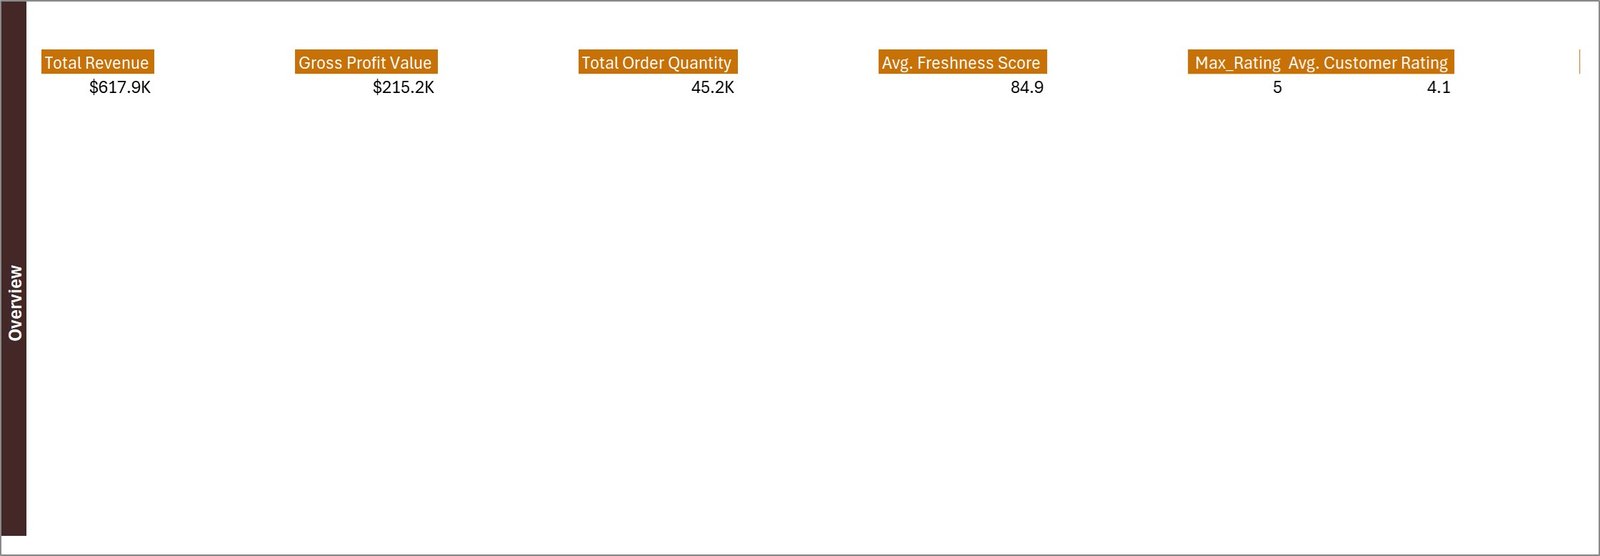
The data and summary pages show how the workbook is structured, making it easier for buyers to replace sample records with their own farm supply data.
Farm Supply Chain Excel Dashboard vs. Google Sheets vs. Paid ERP/SaaS – Feature Comparison
| Area | Excel dashboard | Google Sheets dashboard | Paid ERP or SaaS |
|---|---|---|---|
| Best for | Offline analysis and presentation | Browser-based collaboration | Live transaction management |
| Cost model | One-time purchase | Usually low cost | Subscription plus setup |
| Customization | High for Excel users | High for sheet users | Depends on vendor plan |
| Implementation | Fast template setup | Fast if data is simple | Longer onboarding |
| Farm supply reporting | Built into the workbook pages | Requires a similar template | May require modules and configuration |
Who Should Use This Template
Readers who want broader Excel automation ideas can also explore PK-AnExcelExpert tutorials before adapting the file.
This dashboard is useful for farm supply distributors, input suppliers, greenhouse operators, agri startups, farm co-operatives, procurement analysts, and consultants who prepare recurring supply chain reports. It is especially useful when Microsoft Excel is already part of the team’s workflow.
Real-World Use Cases
Weekly supplier meeting: bring order quantity, fulfillment, and quality trends into one discussion.
Seasonal planning: compare category and channel patterns before a new growing season.
Management reporting: turn raw farm supply records into presentation-ready Excel pages.
Advantages of Farm Supply Chain Excel Dashboard
The biggest advantage is speed. You start from a finished workbook, not a blank grid. The dashboard also keeps the data visible, which matters for teams that want to understand how the report is built. Microsoft has useful guidance on Excel tables and structured references at Microsoft Excel support, and this template follows the same practical idea: keep data organized so reporting is easier.
Opportunities for Improvement
This is not a live system. It does not scan inventory, send supplier emails, connect automatically to accounting software, or enforce procurement approvals. A buyer can extend it, but those features are outside the delivered dashboard.
Best Practices
Keep one clean copy of the original file, update the data sheet on a regular schedule, use consistent category and channel names, and review the dashboard after each data refresh. If your team uses shared files, store the workbook in a controlled folder so only responsible users edit the source data.
Explore Relevant Templates
The Farm Supply Chain Excel Dashboard pairs well with Excel reporting tutorials, dashboard cleanup workflows, and supply chain KPI review habits. See more Excel help on PK-AnExcelExpert Excel resources. You can explore more Excel templates and dashboards on NextGenTemplates, including other operations, supply chain, logistics, inventory, and KPI reporting files.
Farm Supply Chain Excel Dashboard works best when the team needs a repeatable Excel reporting view for farm supply chain meetings. Use the Farm Supply Chain Excel Dashboard during supplier reviews, fulfillment checks, product quality discussions, and weekly management reporting. The Farm Supply Chain Excel Dashboard keeps the reporting scope clear: dashboard analysis in Excel, with editable sample data and visible workbook pages.
Frequently Asked Questions
Is this Farm Supply Chain Excel Dashboard a finished template?
Yes. It is a downloadable Excel dashboard with sample data, dashboard pages, a data sheet, and a user manual inside the ZIP.
Can I replace the sample data?
Yes. Replace the sample records in Excel with your own farm supplier, order, fulfillment, and quality data.
Does it require macros?
No special VBA workflow is required for the dashboard listing. Open it in Microsoft Excel and update the sample data.
Is this an ERP system?
No. It is an Excel reporting template, not a live ERP, warehouse system, or procurement platform.
What pages are included?
The screenshots show the main dashboard, startup mix, farm supply, fulfillment, product quality, data, and summary views.
About the Author
Built by PK – Microsoft Certified Professional with 15+ years of Excel, Google Sheets, and Power BI experience. Founder of NextGenTemplates, reaching 300K+ subscribers across YouTube channels. Every template is hand-built and tested before release.
Conclusion
The Farm Supply Chain Excel Dashboard gives teams a reusable way to review supplier, fulfillment, and quality performance. The Farm Supply Chain Excel Dashboard is a practical starting point for teams that need clearer visibility into suppliers, orders, fulfillment, and product quality. It keeps reporting inside Excel while giving you a finished dashboard structure from day one. For more tutorials, visit PK: An Excel Expert on YouTube.