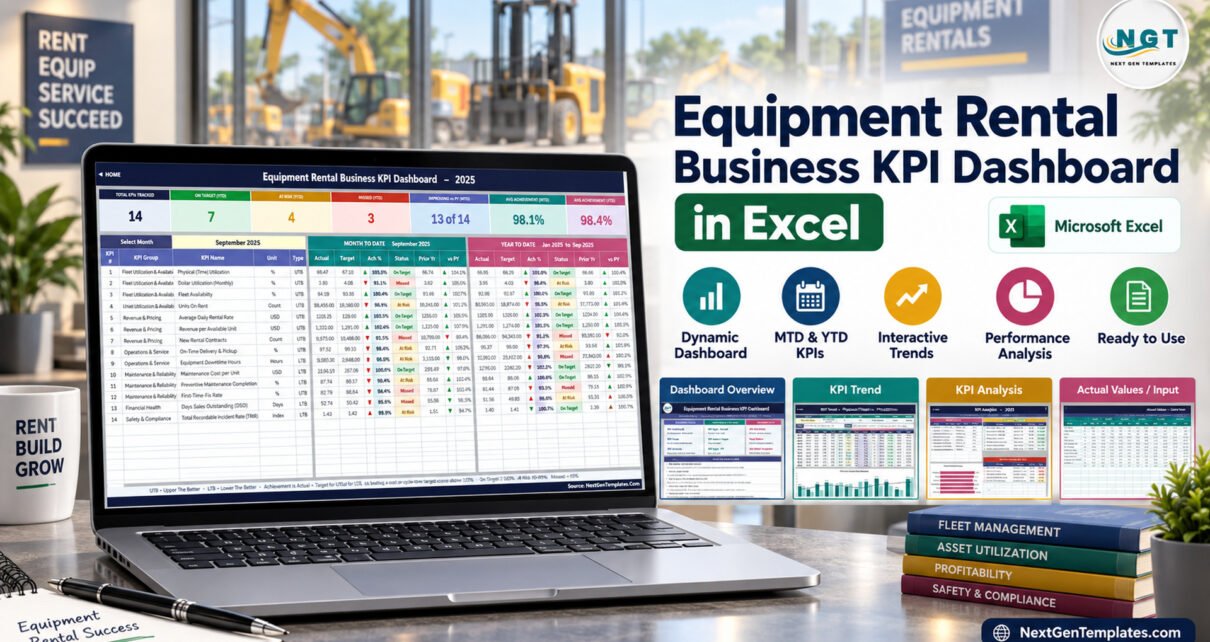
The Equipment Rental Business KPI Dashboard in Excel puts 14 rental-fleet KPIs, grouped into 6 areas, on one month-driven scorecard. Pick a month and you see MTD and YTD actual, target, achievement %, traffic-light status and prior-year movement for every KPI. The workbook has 11 sheets and 3 charts, ships with twelve months of 2025 sample data plus 2024 prior-year figures, and runs on plain worksheet formulas with no macros and no Power Query.
Rental companies live and die on utilization, rate and downtime, yet the monthly review is often a stack of exports and a hand-built slide. This template gives fleet, revenue, maintenance and finance managers one shared view of the numbers that matter, with each KPI scored in the right direction. It is the KPI Dashboard edition – month picker, KPI Trend page and KPI Analysis page – and not the separate Equipment Rental Business KPI Scorecard template.
Key Features of the Equipment Rental KPI Dashboard
- One month selector. Cell D6 on the KPI Dashboard sheet is a dropdown of the twelve months of your reporting year, and every KPI row, summary card and the analysis page follow it.
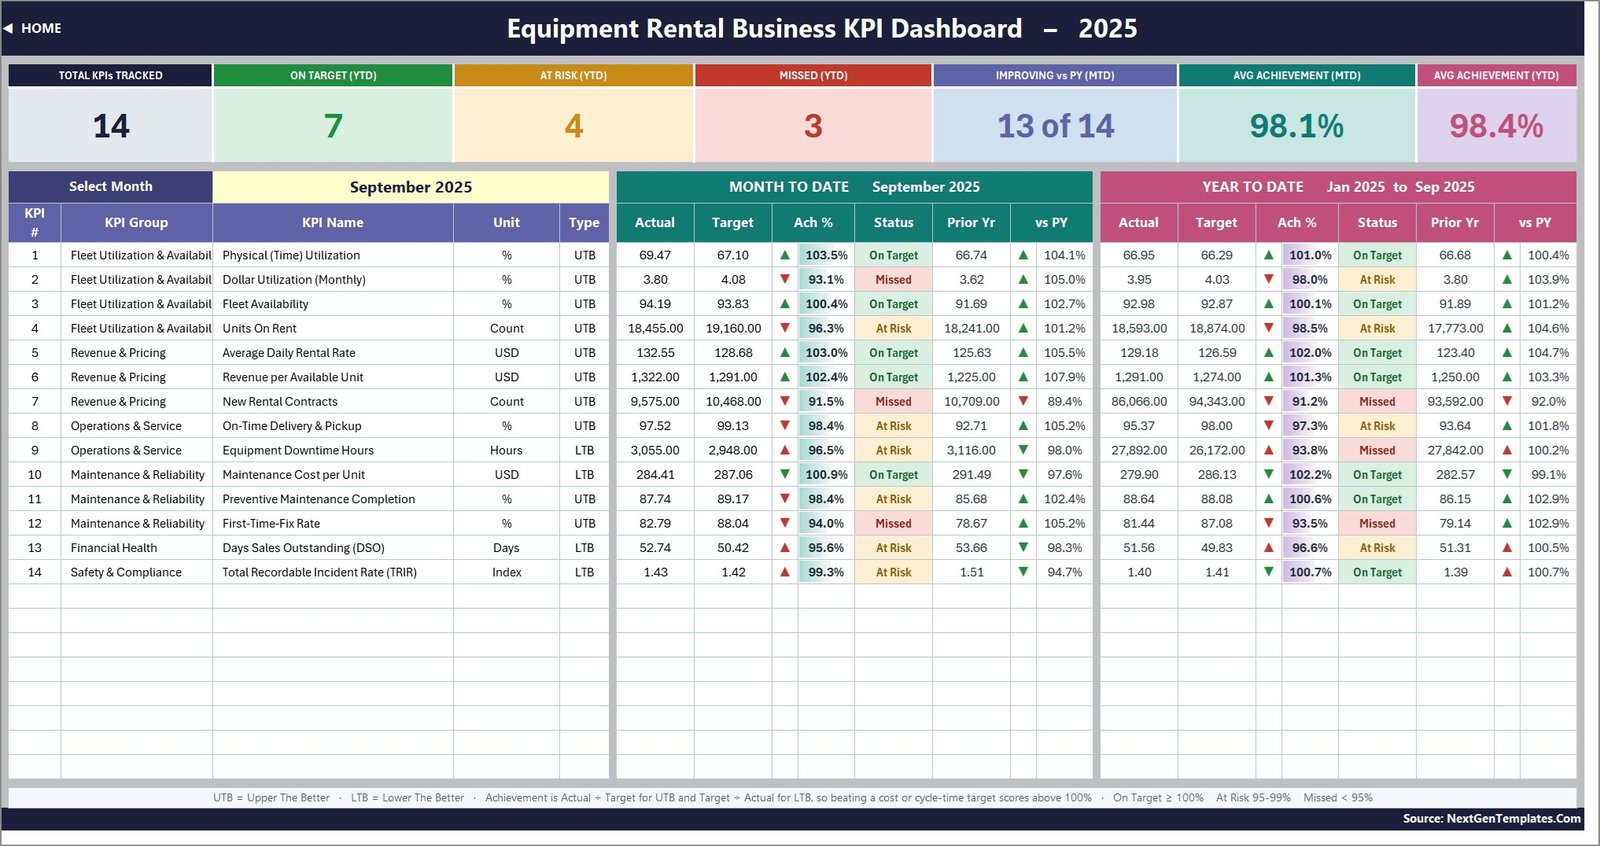
- Seven summary cards. Total KPIs Tracked, On Target (YTD), At Risk (YTD), Missed (YTD), Improving vs PY (MTD), Avg Achievement (MTD) and Avg Achievement (YTD). The September 2025 sample reads 14, 7, 4, 3, 13 of 14, 98.1% and 98.4%.
- Direction-aware achievement. 10 KPIs are UTB (upper the better) and 4 are LTB (lower the better). For an LTB KPI achievement is Target divided by Actual, so a downtime or cost figure below target scores above 100%.
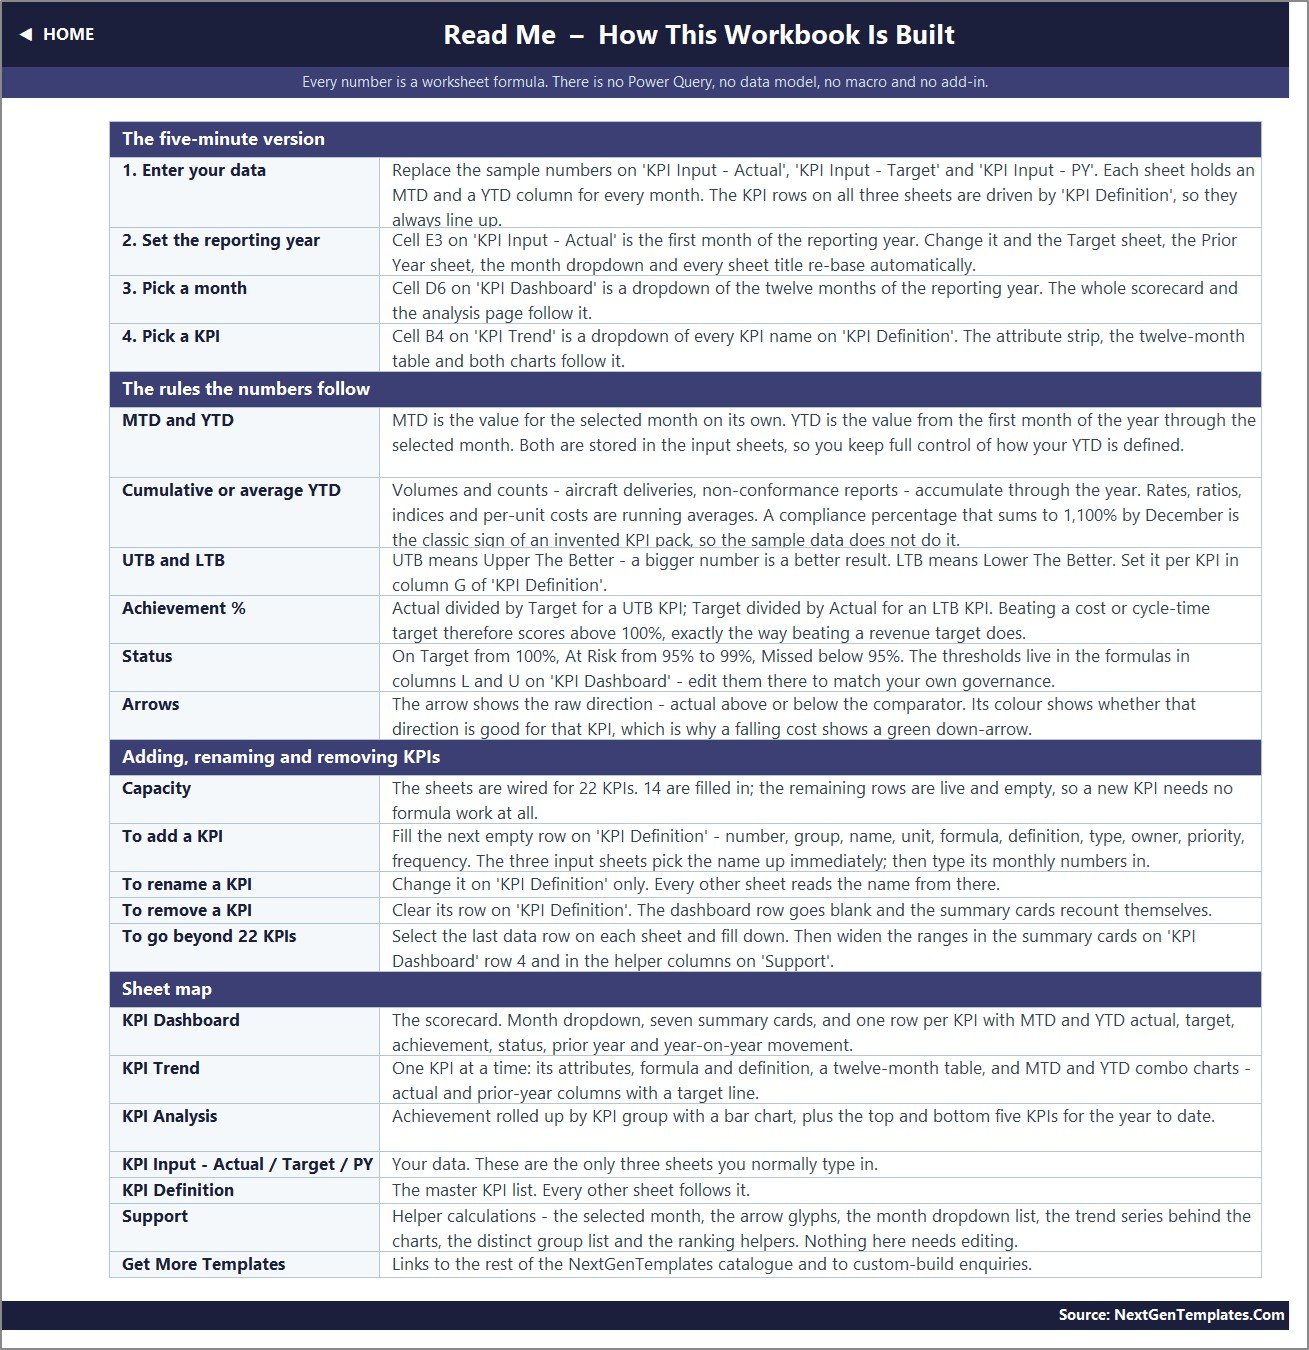
- Clear status bands. On Target from 100%, At Risk from 95% to 99%, Missed below 95%, applied to both MTD and YTD.
- Colour-aware arrows. The vs-PY arrow shows the raw direction and its colour shows whether that direction is good for the KPI, which is why a falling cost shows a green down arrow.
- Capacity for 22 KPIs. 14 rows are filled and 8 more are live and empty, so a new KPI needs no formula work.
The 14 KPIs and Their Groups
| Group | KPI | Unit | Type | Owner |
|---|---|---|---|---|
| Fleet Utilization & Availability | Physical (Time) Utilization | % | UTB | VP Fleet Operations |
| Fleet Utilization & Availability | Dollar Utilization (Monthly) | % | UTB | VP Fleet Operations |
| Fleet Utilization & Availability | Fleet Availability | % | UTB | Director of Maintenance |
| Fleet Utilization & Availability | Units On Rent | Count | UTB | VP Fleet Operations |
| Revenue & Pricing | Average Daily Rental Rate | USD | UTB | VP Revenue Management |
| Revenue & Pricing | Revenue per Available Unit | USD | UTB | VP Revenue Management |
| Revenue & Pricing | New Rental Contracts | Count | UTB | VP Sales |
| Operations & Service | On-Time Delivery & Pickup | % | UTB | Director of Logistics |
| Operations & Service | Equipment Downtime Hours | Hours | LTB | Director of Maintenance |
| Maintenance & Reliability | Maintenance Cost per Unit | USD | LTB | Director of Maintenance |
| Maintenance & Reliability | Preventive Maintenance Completion | % | UTB | Fleet Maintenance Manager |
| Maintenance & Reliability | First-Time-Fix Rate | % | UTB | Field Service Manager |
| Financial Health | Days Sales Outstanding (DSO) | Days | LTB | Credit & Collections Manager |
| Safety & Compliance | Total Recordable Incident Rate (TRIR) | Index | LTB | Director of Safety (EHS) |
TRIR follows the recordable incidents x 200,000 / hours worked convention described in OSHA’s recordkeeping guidance. The sample values are illustrative and are not a regulatory filing.
Equipment Rental Business KPI Dashboard in Excel: Sheet-by-Sheet Walkthrough
Home
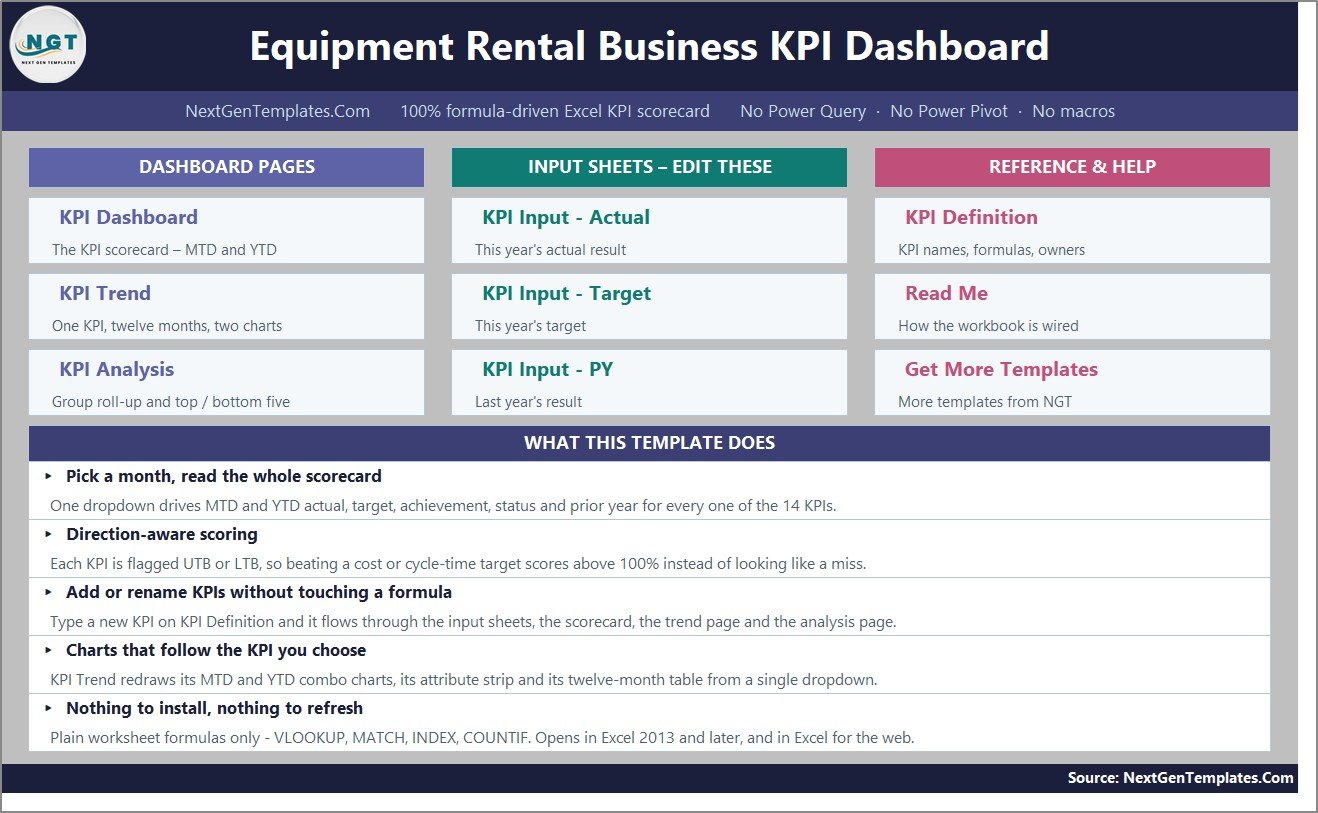
The start page groups navigation into Dashboard Pages, Input Sheets and Reference & Help, and lists what the template does in five short points.
KPI Dashboard
The scorecard: seven summary cards, the month selector, and one row per KPI with KPI group, name, unit and type, followed by an MTD block and a YTD block (actual, target, achievement %, status, prior year, vs PY).
KPI Trend
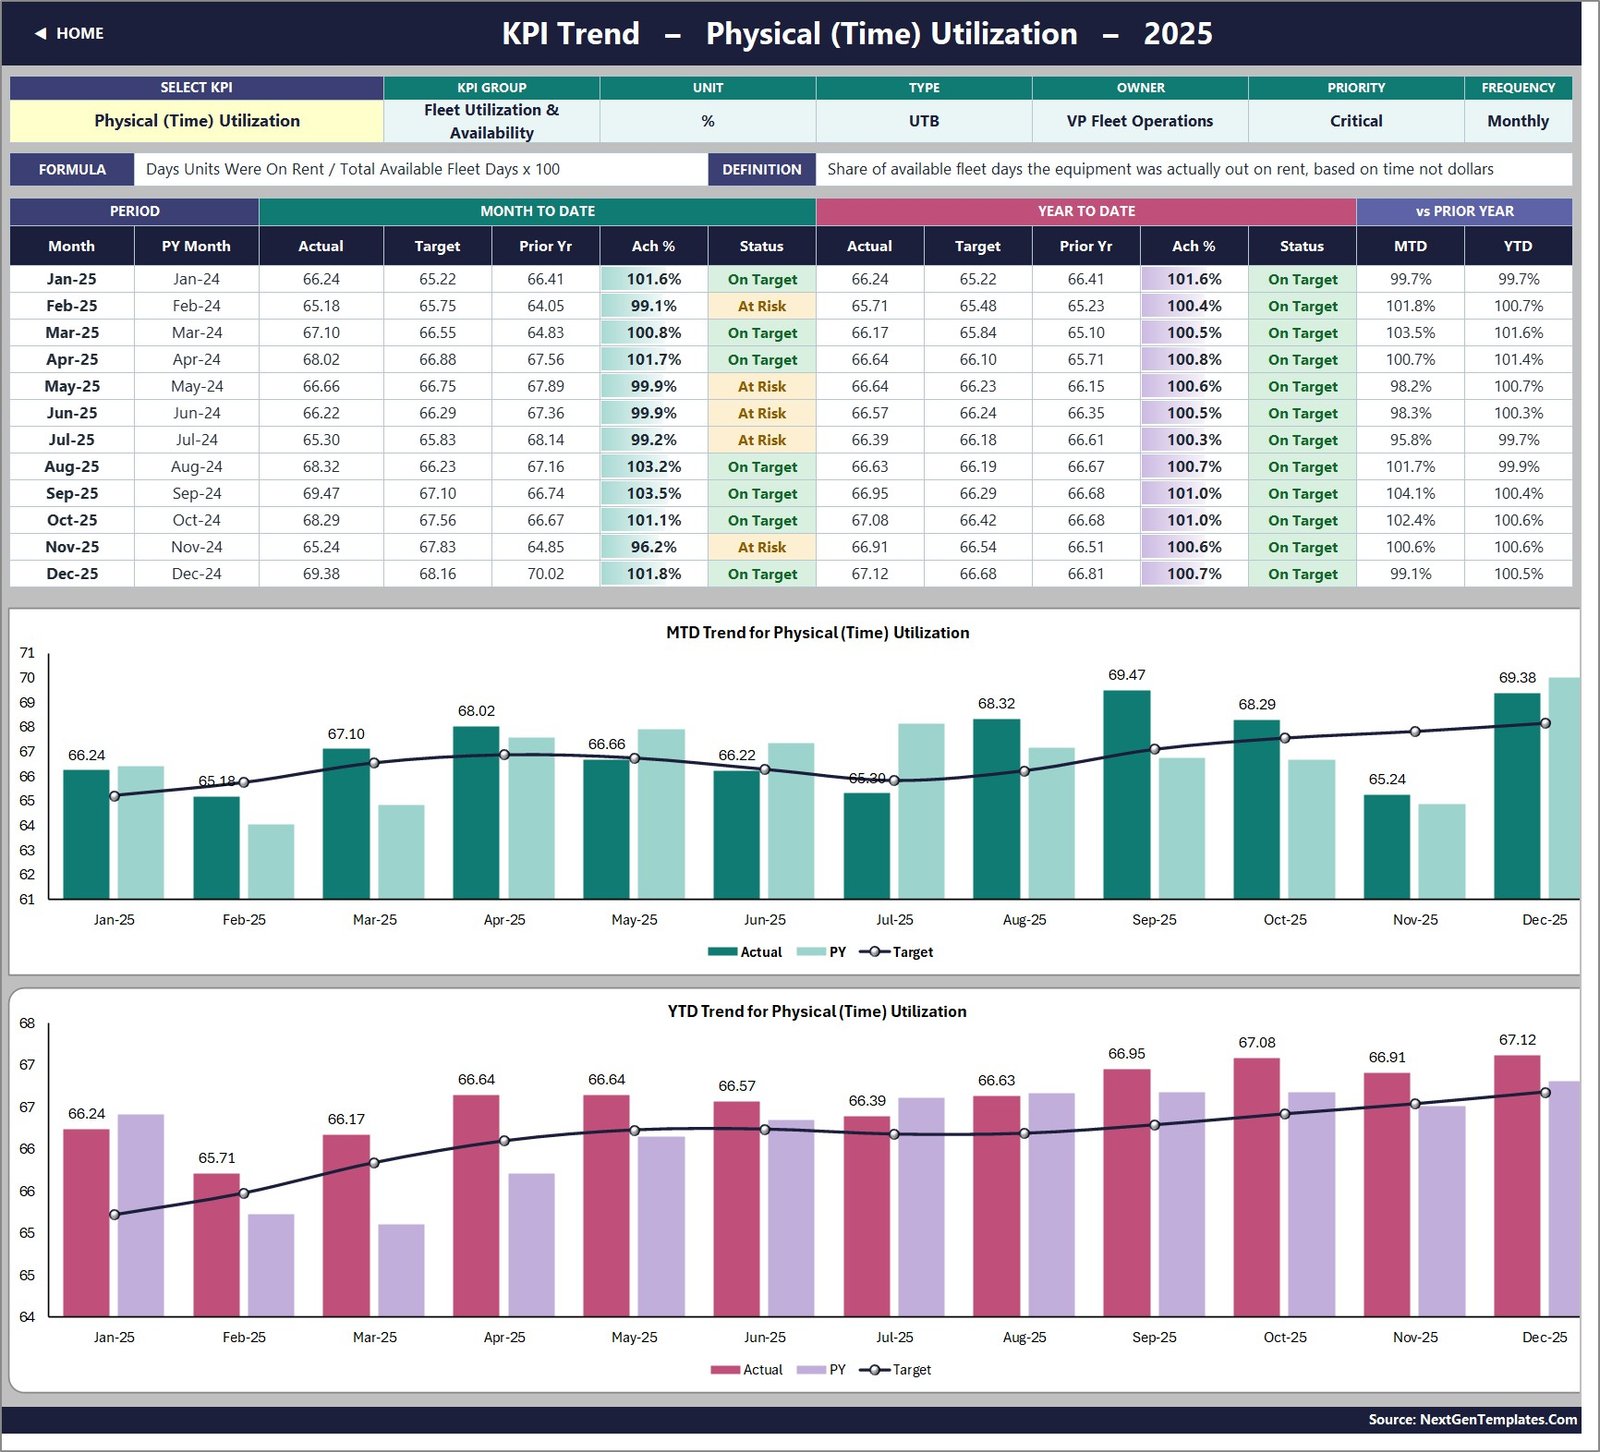
Pick a KPI in cell B4 to load its group, unit, type, owner, priority, frequency, formula and definition, a twelve-month table, and two charts: MTD Trend and YTD Trend, each with actual and prior-year columns and a target line. In the sample, Physical (Time) Utilization reached 69.47% against a 67.10% target in September 2025.
KPI Analysis
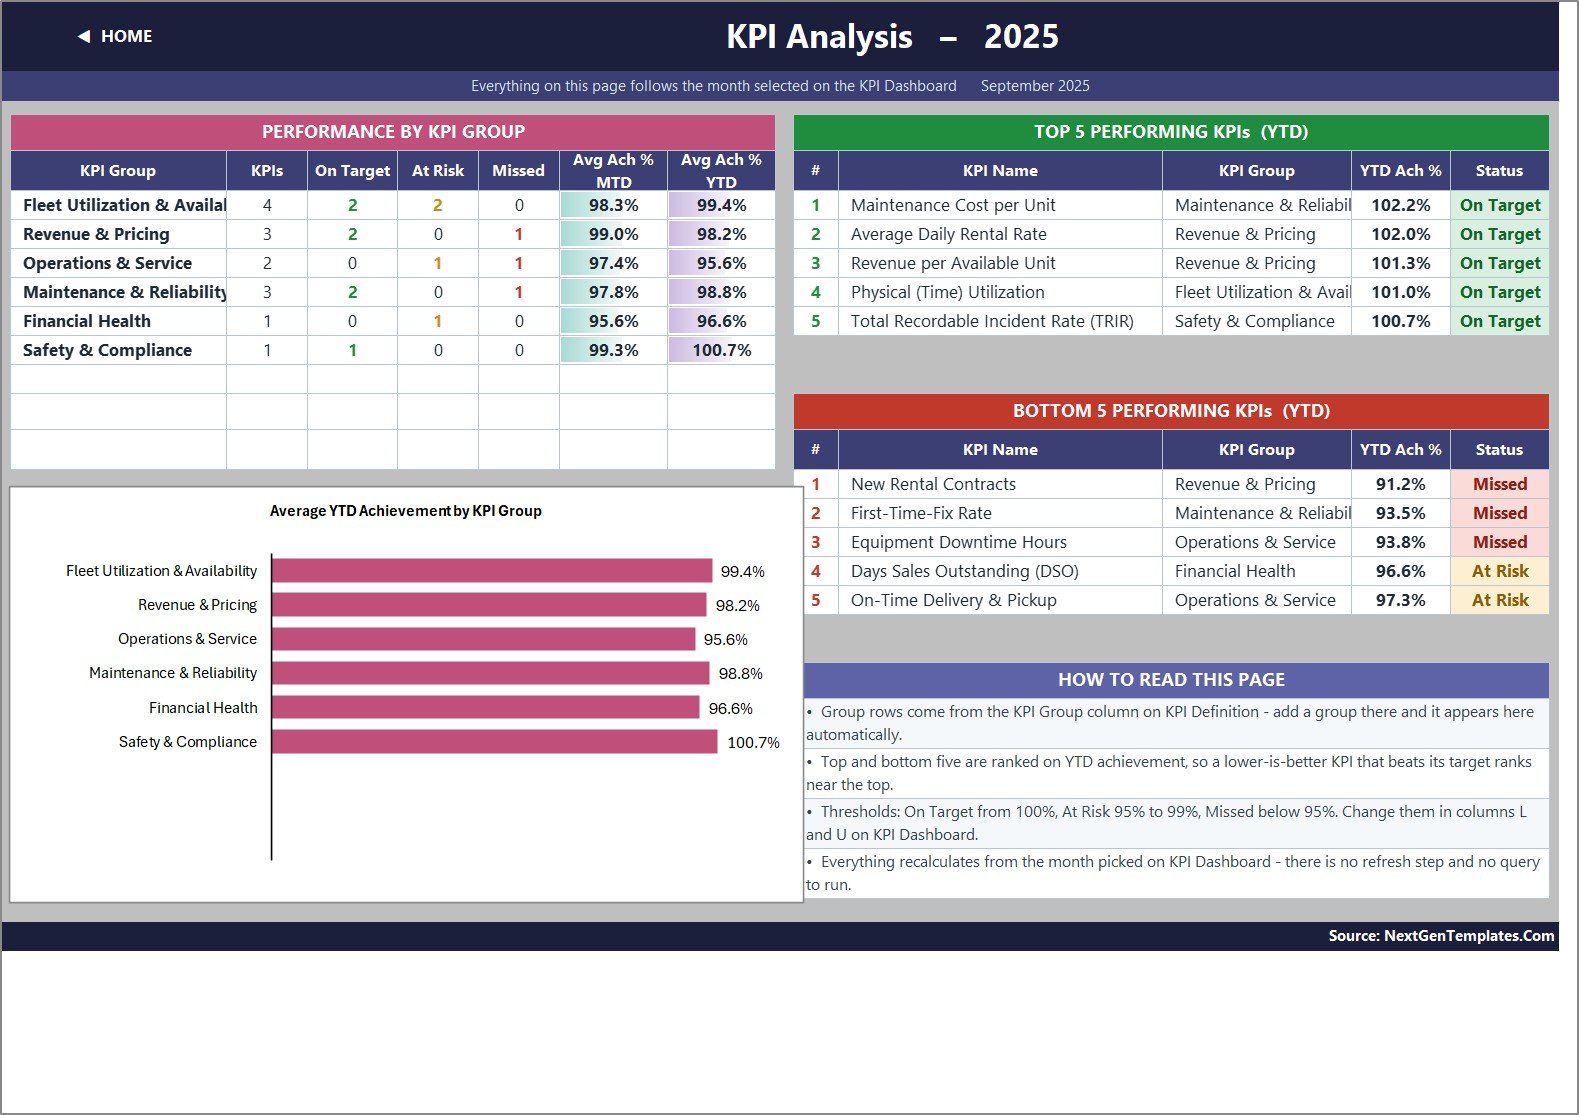
Performance by KPI Group, the Average YTD Achievement by KPI Group chart, and top five and bottom five KPIs ranked on YTD achievement. In the September 2025 sample, Maintenance Cost per Unit leads at 102.2% and New Rental Contracts trails at 91.2%, while Operations & Service is the weakest group at 95.6% average YTD achievement.
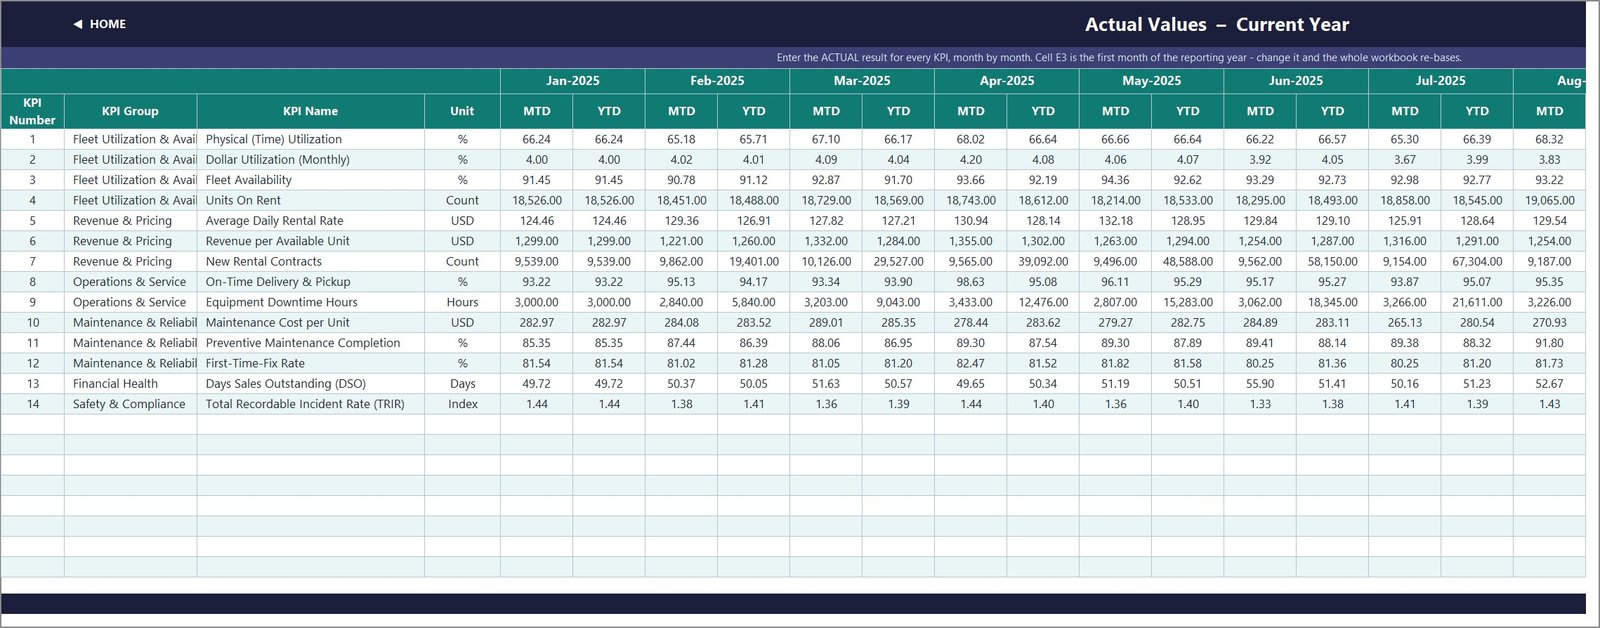
KPI Input – Actual
This year’s actual MTD and YTD result for every KPI and month. Cell E3 is the first month of the reporting year; change it and the whole workbook re-bases.
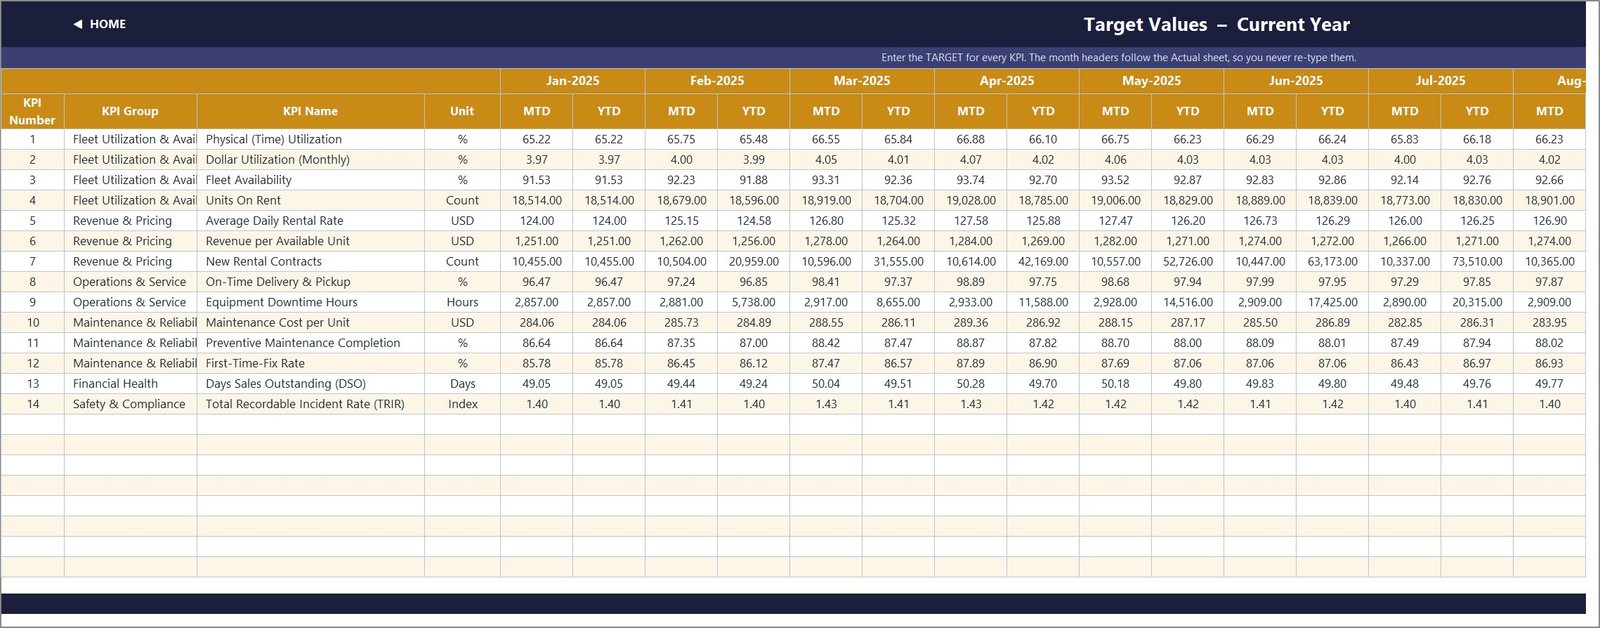
KPI Input – Target
The same grid for targets. Month headers follow the Actual sheet, so you never retype them.
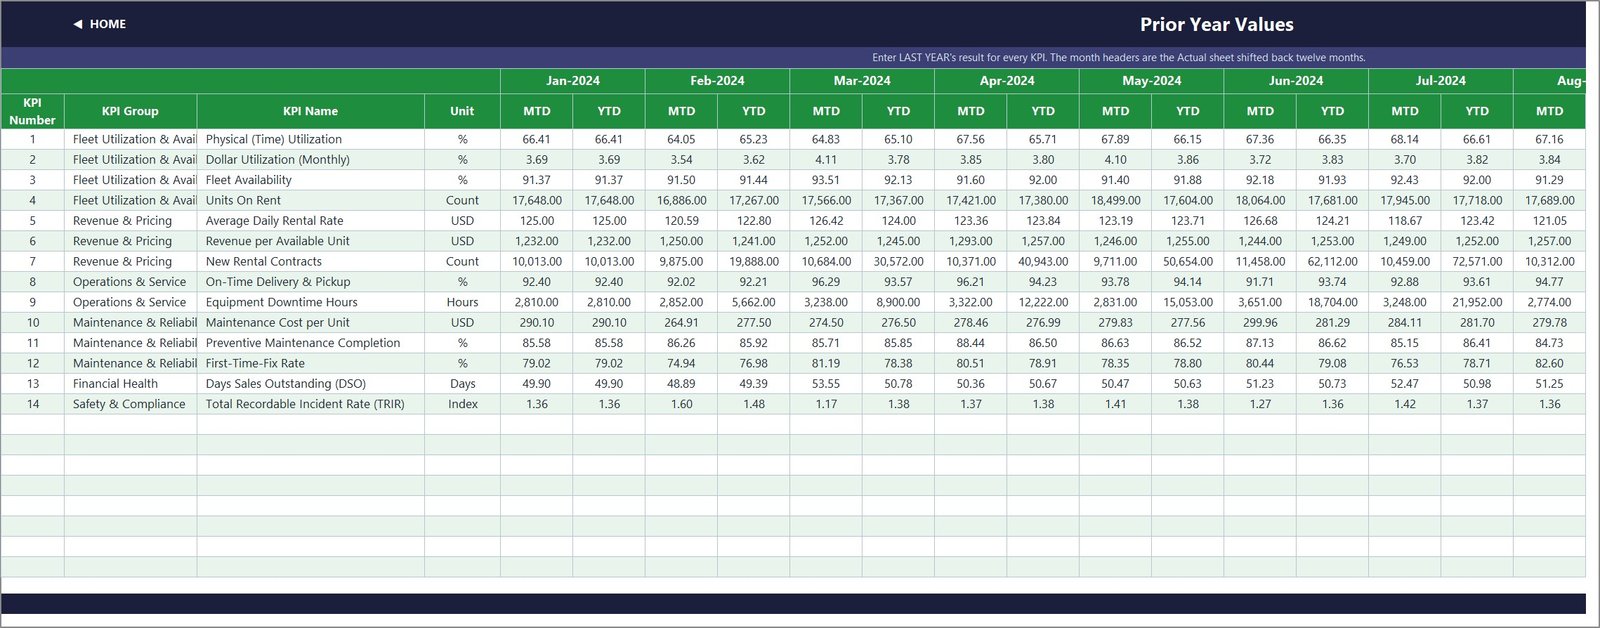
KPI Input – PY
Last year’s results, with headers shifted back twelve months automatically.
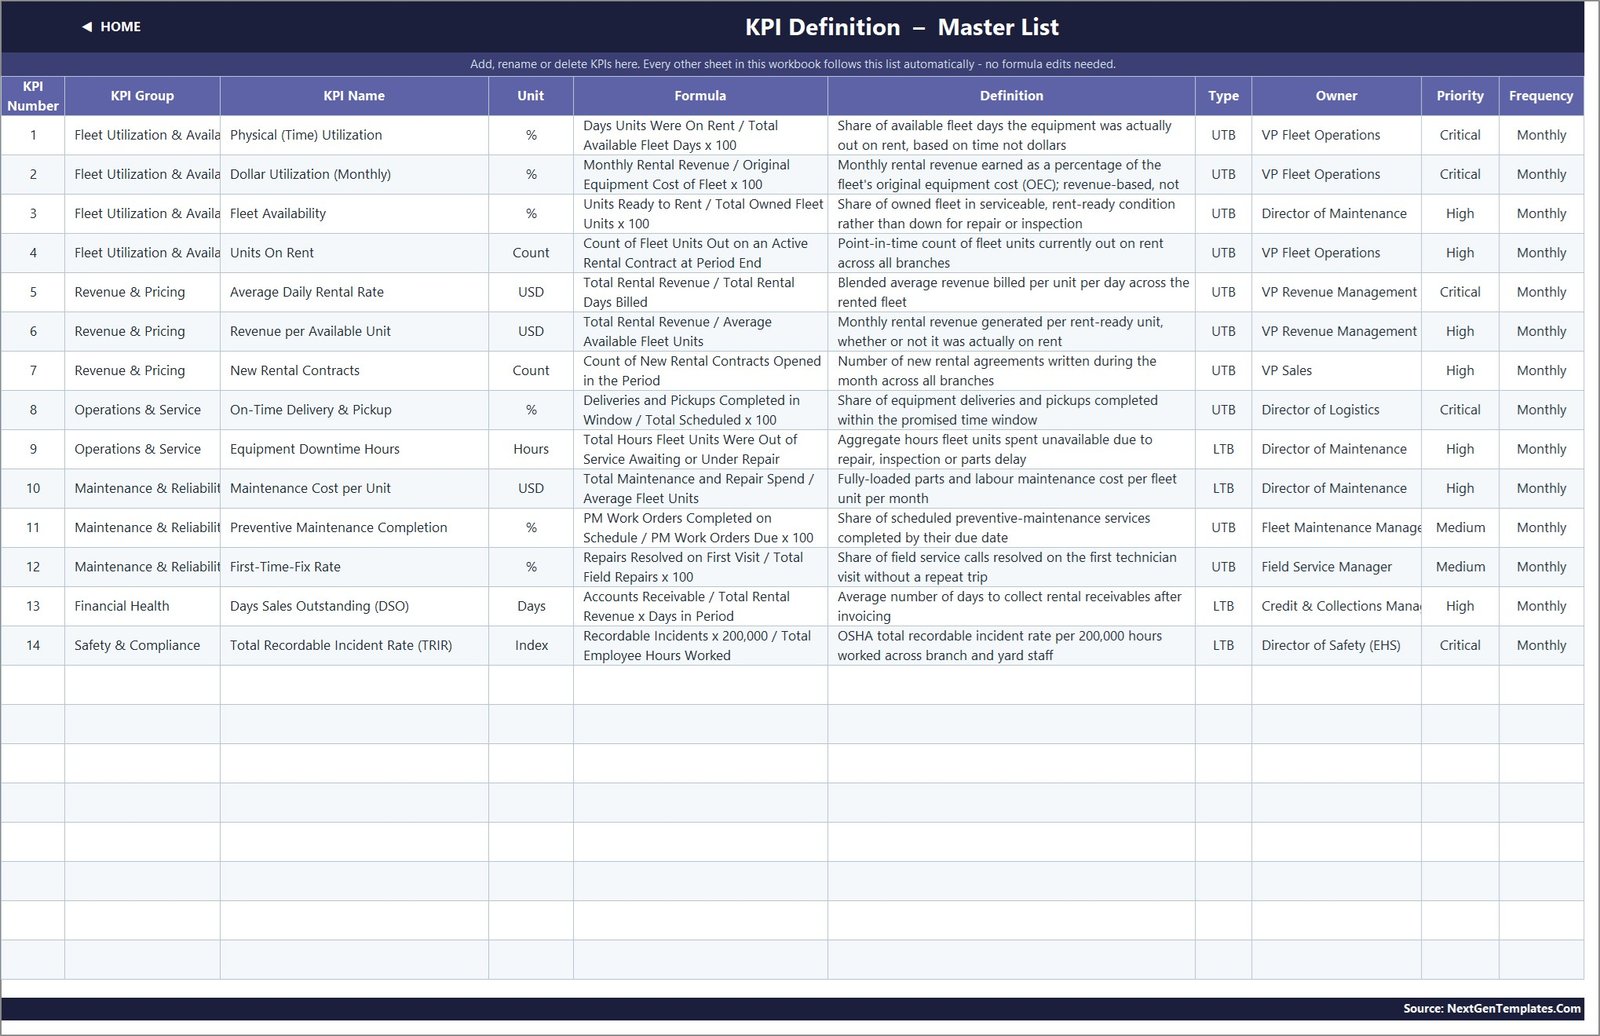
KPI Definition
The master list every other sheet reads: number, group, name, unit, formula, definition, type, owner, priority and frequency.
Read Me and Get More Templates
Read Me explains data entry, the YTD rules, UTB and LTB, status thresholds, arrows and how to add KPIs. Get More Templates links to related NextGenTemplates products. A Support sheet holds helper calculations and needs no editing.
Excel KPI Dashboard vs. Google Sheets vs. Rental Management Software
| Feature | This Excel KPI Dashboard | Google Sheets equivalent | Rental management software |
|---|---|---|---|
| Cost | ✅ $12.99 one-time | One-time template price | Recurring subscription, usually quoted per location or user |
| Platform | ✅ Excel 2013+ and Excel for the web | Browser | Vendor cloud |
| Setup time | ✅ Under an hour | Similar | Weeks of onboarding |
| Real-time collaboration | Via OneDrive or SharePoint | ✅ Built in | ✅ Built in |
| Contracts, dispatch and billing | Not included | Not included | ✅ Core feature |
| MTD/YTD traffic-light scorecard | ✅ Yes | Depends on template | Often a reporting add-on |
| Editable KPIs and formulas | ✅ Fully open | ✅ Open | Vendor fields only |
| Year-1 cost at 5 users | ✅ $12.99 total | One-time | Subscription x 5 users x 12 months |
For rental operators who want a disciplined monthly KPI review without a platform project, this Excel scorecard sits in the sweet spot.
Who Should Use This Template
Perfect for:
- Owners and general managers of construction, industrial or general equipment rental companies
- Fleet, revenue, maintenance and credit managers who report to leadership each month
- Consultants building a KPI pack for a rental or plant-hire client
Not a fit if:
- You need contracts, dispatch, invoicing or an asset register
- You want live feeds from a rental system – figures are typed or pasted in
- You need branch-level or unit-level drill-down
Real-World Use Cases
Maria owns a six-branch construction equipment rental firm. She pastes monthly utilization, rate and downtime numbers into the input sheets, selects the month, and walks her managers through the bottom-five list on KPI Analysis.
Dev leads maintenance at a regional plant-hire company. He tracks Preventive Maintenance Completion and First-Time-Fix Rate on KPI Trend to show whether a new service schedule is closing the gap to target.
Aisha is the finance lead at a scaffolding and access rental business. She watches Days Sales Outstanding and Revenue per Available Unit side by side so collections and pricing are discussed in the same meeting.
Advantages
- One-time cost. No per-user subscription for a monthly reporting job.
- Nothing to install. Functions such as IF, VLOOKUP, MATCH, INDEX, EDATE, COUNTIFS and AVERAGEIF only, documented on Microsoft Excel support.
- Honest scoring. LTB KPIs such as downtime and DSO are never shown as misses when they beat target.
- Adaptable. Rename KPIs, change owners or add up to 8 more without touching formulas.
Opportunities for Improvement
- YTD is entered, not derived. You type both MTD and YTD, which gives control over cumulative KPIs (New Rental Contracts, Downtime Hours) versus averaged ones, but means one more column to maintain.
- Thresholds live in formulas. The 100% and 95% bands are edited in columns L and U of the KPI Dashboard sheet rather than in a settings cell.
- One sentence of stray boilerplate. The Read Me explanation of cumulative YTD cites “aircraft deliveries, non-conformance reports” as examples. It changes no calculation, but you may want to reword it.
- Clipped group names. Longer KPI group names are cut off by column width on the scorecard and input sheets.
- Company-level only. There is no branch, category or unit breakdown.
Best Practices
- Agree each KPI’s formula and owner on KPI Definition before entering data.
- Decide per KPI whether YTD is a sum or an average, and apply it consistently in all three input sheets.
- Close the month, then enter actuals and review KPI Analysis before the management meeting.
- Keep Dollar Utilization monthly, as defined, and do not mix it with annualised figures.
Explore Relevant Templates
- Fleet Management KPI Dashboard in Excel – the same scorecard format for vehicle fleets
- Rental Equipment Management System Web App – bookings and an asset register
- Construction KPI Dashboard in Excel – for your contractor customers
More on this blog: the Rental Services Dashboard in Excel, the Agro Machinery Rental Dashboard in Excel, the Concrete Contractor KPI Dashboard in Excel and the Machine Maintenance Data Entry System in Excel.
Frequently Asked Questions
What does this equipment rental KPI dashboard track?
It tracks 14 KPIs in 6 groups: fleet utilization and availability, revenue and pricing, operations and service, maintenance and reliability, financial health, and safety. Examples include Physical (Time) Utilization, Average Daily Rental Rate, Equipment Downtime Hours and TRIR.
Do I need macros, Power Query or Power Pivot?
No. The workbook uses ordinary worksheet formulas only, with no macro, data model or add-in. It opens in Excel 2013 and later and in Excel for the web, and recalculates as soon as you pick a month.
How long does setup take?
Most users need under an hour: set the first month in cell E3, adjust KPI Definition, and replace the sample numbers on the Actual, Target and PY sheets. The scorecard, trend and analysis pages update from there.
Is this the same as the Equipment Rental Business KPI Scorecard?
No. This is the KPI Dashboard edition with a month dropdown, MTD and YTD traffic lights, a KPI Trend page and a KPI Analysis page. The KPI Scorecard is a separate template with its own layout.
How does it compare with rental management software?
Rental software handles contracts, dispatch and invoicing on a subscription. This workbook only reports KPIs, for a one-time $12.99, so many companies use their rental system as the source and this scorecard for the monthly review.
Can I add my own KPIs?
Yes. Fill the next empty row on KPI Definition and the three input sheets pick it up immediately. The sheets are wired for 22 KPIs; beyond that, fill the formulas down and widen the ranges described in Read Me.
About the Author
Built by PK – Microsoft Certified Professional with 15+ years of Excel, Google Sheets and Power BI experience and founder of NextGenTemplates. Every template is hand-built and tested before release.
Conclusion
If your rental business reviews utilization, rates, downtime, collections and safety every month, this workbook turns that review into one dropdown and three pages, scored in the right direction for each KPI.
👉 Click here to purchase the Equipment Rental Business KPI Dashboard in Excel
✅ Instant download · One-time payment · No subscription
🎥 Video tutorials: Youtube.com/@PKAnExcelExpert
Last updated: September 2026