Most flooring companies know their revenue. Far fewer can say, in the first week of the month, how many square feet went down against plan, what share of jobs was handed over on the promised date, and whether offcut waste is creeping past the ceiling. The Flooring Installation KPI Scorecard in Excel puts all of it on one page: ten KPIs in five groups, a target and a red / amber / green light on every tile, the change against target, and a twelve-month sparkline underneath.
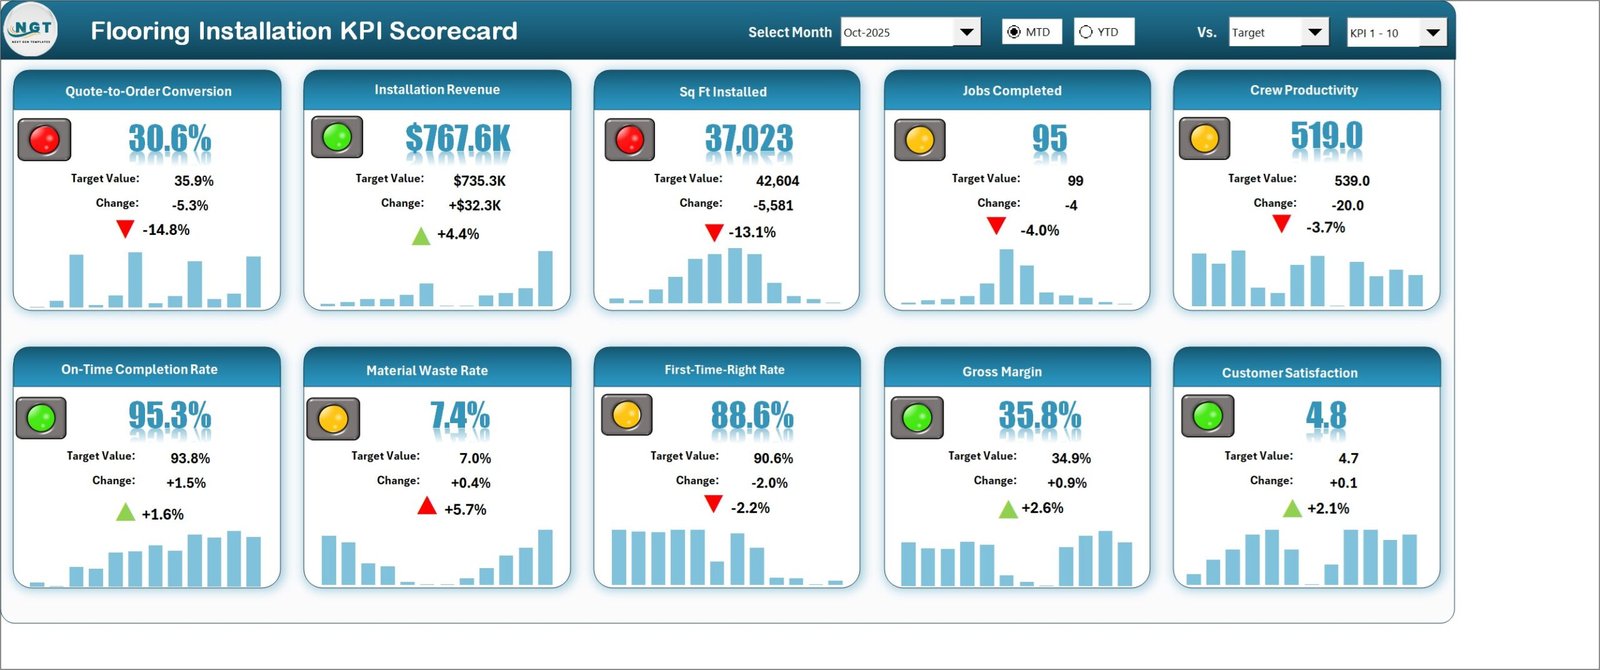
In the October 2025 sample that ships with the file the month reads 4 green, 4 amber and 2 red. Installation revenue is green at $767.6K against a $735.3K target. Quote-to-order conversion is red at 30.6% against 35.9%, and square feet installed is red at 37,023 against a plan of 42,604. On-time completion, gross margin and customer satisfaction are all green. That single line is the whole point of a scorecard: the month has a shape, and you can see it before anyone opens a spreadsheet argument.
It is 100% worksheet formulas – no macros, no Power Query, no add-ins – so it opens on any Excel for Windows desktop from 2016 onward.
This is the scorecard line, not the dashboard line. If you want slicers, a transaction table and pivot-driven analysis of flooring jobs, that is the Flooring and Tiles Dashboard in Excel. The scorecard is deliberately lighter: you type twelve months of finished figures, and it reports them the same way every month.
Key Features of the Flooring Installation KPI Scorecard in Excel
- Ten flooring KPIs in five groups. Quote-to-Order Conversion and Installation Revenue (Sales & Estimating); Sq Ft Installed and Jobs Completed (Installation Delivery); Crew Productivity and On-Time Completion Rate (Productivity & Schedule); Material Waste Rate and First-Time-Right Rate (Quality & Rework); Gross Margin and Customer Satisfaction (Financial & Customer).
- One month picker. Choose Oct-2025 in the header and the tile wall, the analysis page and the trend page all move together.
- MTD or YTD on a toggle, compared against Target, Prior Year or Prior Month.
- Direction-aware scoring. Material Waste Rate is marked LTB (lower the better), so a falling waste number scores green; the other nine are UTB.
- Editable RAG bands on the Color Settings sheet – green at or above target, amber within 10%, red beyond.
- A twelve-month sparkline on every tile, so seasonality is visible without leaving the scorecard.
- KPI Analysis page – achievement by KPI group, a green / amber / red counter, and automatic Top 5 and Bottom 5 rankings.
- KPI Trend page – four twelve-month charts for whichever KPI you pick.
- Room for 20 KPIs, displayed ten at a time through the KPI set picker.
- No macros. Formulas, conditional formatting, camera pictures and sparklines only.
Sheet-by-Sheet Walkthrough
Nine sheets you work with, plus two hidden calculation sheets that feed the charts.
Home
A navigation page with a linked card for every sheet – Scorecard, KPI Analysis, KPI Trend, Input Data, KPI Definition, Color Settings, Read Me and Get More Templates – each with a one-line description of what it does. The footer states the rule the whole file follows: 100% formulas, no macros, no Power Query, no add-ins.
Scorecard
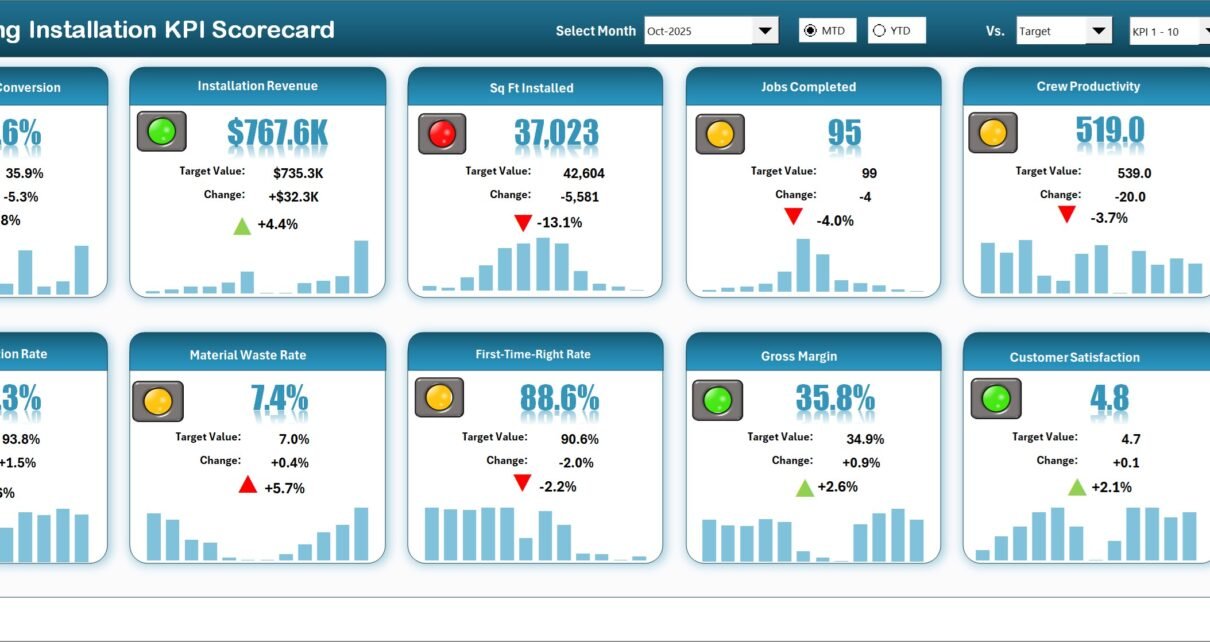
The tile wall, and the page you will actually print. Ten cards laid out five across, each showing the KPI name, the traffic light, the value in large type, the target value, the absolute change, the percentage change with a coloured arrow, and a twelve-month sparkline.
The October 2025 sample reads like this:
| KPI | Actual | Target | Variance | Light |
|---|---|---|---|---|
| Quote-to-Order Conversion | 30.6% | 35.9% | -14.8% | Red |
| Installation Revenue | $767.6K | $735.3K | +4.4% | Green |
| Sq Ft Installed | 37,023 | 42,604 | -13.1% | Red |
| Jobs Completed | 95 | 99 | -4.0% | Amber |
| Crew Productivity | 519.0 sq ft/day | 539.0 | -3.7% | Amber |
| On-Time Completion Rate | 95.3% | 93.8% | +1.6% | Green |
| Material Waste Rate (LTB) | 7.4% | 7.0% | +5.7% | Amber |
| First-Time-Right Rate | 88.6% | 90.6% | -2.2% | Amber |
| Gross Margin | 35.8% | 34.9% | +2.6% | Green |
| Customer Satisfaction | 4.8 | 4.7 | +2.1% | Green |
Note the Material Waste Rate row. Waste rose from the 7.0% ceiling to 7.4%, so the change is +5.7% – but because the KPI is scored lower-the-better, the arrow is red and the light is amber. A scorecard that treated every increase as good news would have shown a green arrow there, and the meeting would have moved on.
KPI Analysis
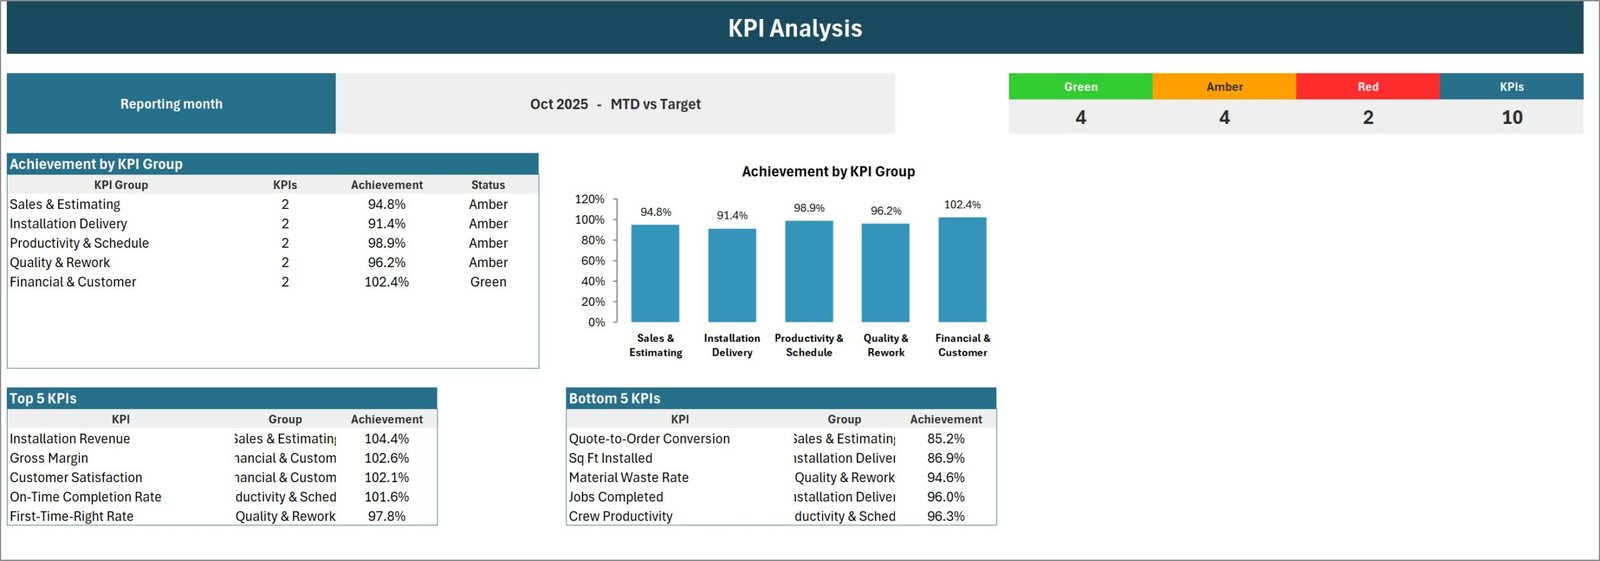
The page that sets the agenda. A banner states the reporting month and the comparison in force – Oct 2025 – MTD vs Target – beside a counter reading 4 green, 4 amber, 2 red out of 10 KPIs.
Below it, achievement by KPI group as a table and a matching column chart: Sales & Estimating 94.8%, Installation Delivery 91.4%, Productivity & Schedule 98.9%, Quality & Rework 96.2% and Financial & Customer 102.4%. Only the last is green, which tells you the month made its money on margin and satisfaction rather than on volume.
Then two ranked lists. Top 5: Installation Revenue 104.4%, Gross Margin 102.6%, Customer Satisfaction 102.1%, On-Time Completion Rate 101.6%, First-Time-Right Rate 97.8%. Bottom 5: Quote-to-Order Conversion 85.2%, Sq Ft Installed 86.9%, Material Waste Rate 94.6%, Jobs Completed 96.0%, Crew Productivity 96.3%. Both lists rebuild themselves when you change the month.
KPI Trend
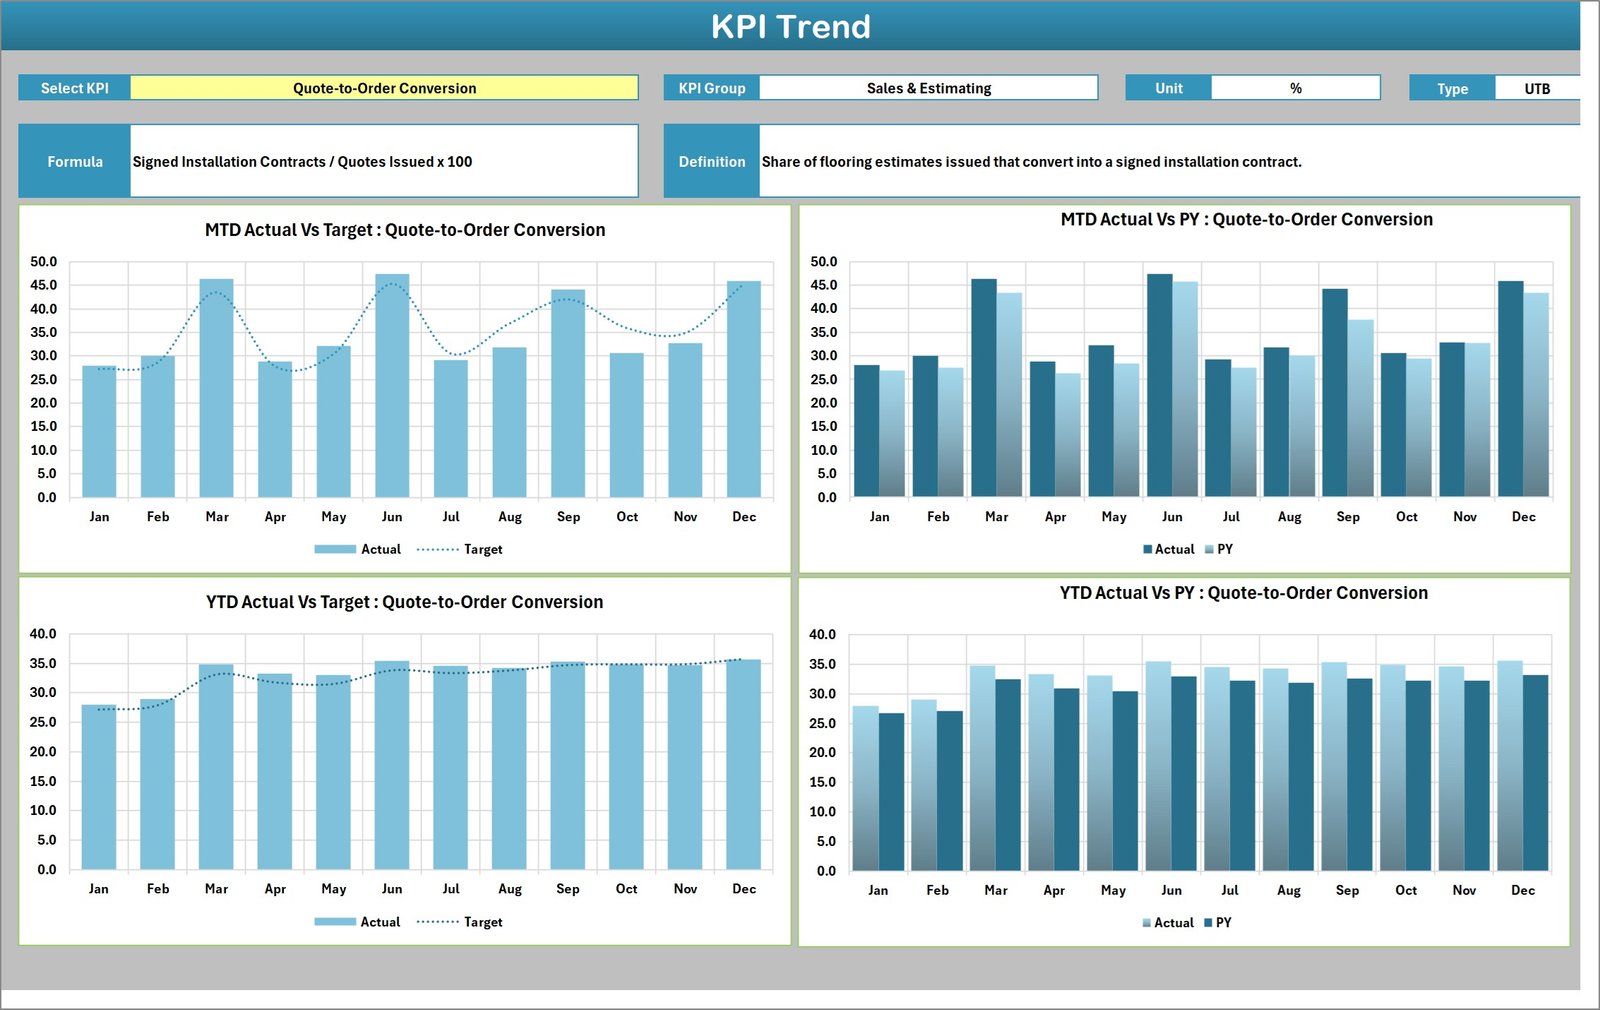
Pick one KPI from the yellow dropdown and the page fills in its group, unit and type, plus the formula and the definition typed on KPI Definition – for Quote-to-Order Conversion, Signed Installation Contracts / Quotes Issued x 100, described as the share of flooring estimates that convert into a signed installation contract.
Underneath sit four twelve-month charts: MTD Actual vs Target, MTD Actual vs PY, YTD Actual vs Target and YTD Actual vs PY. This is where a red tile gets its context. Quote-to-order conversion spikes in March, June, September and December and dips between – so October at 30.6% is partly the shape of the year, but the YTD line sitting flat against target says the slide is real too.
Input Data
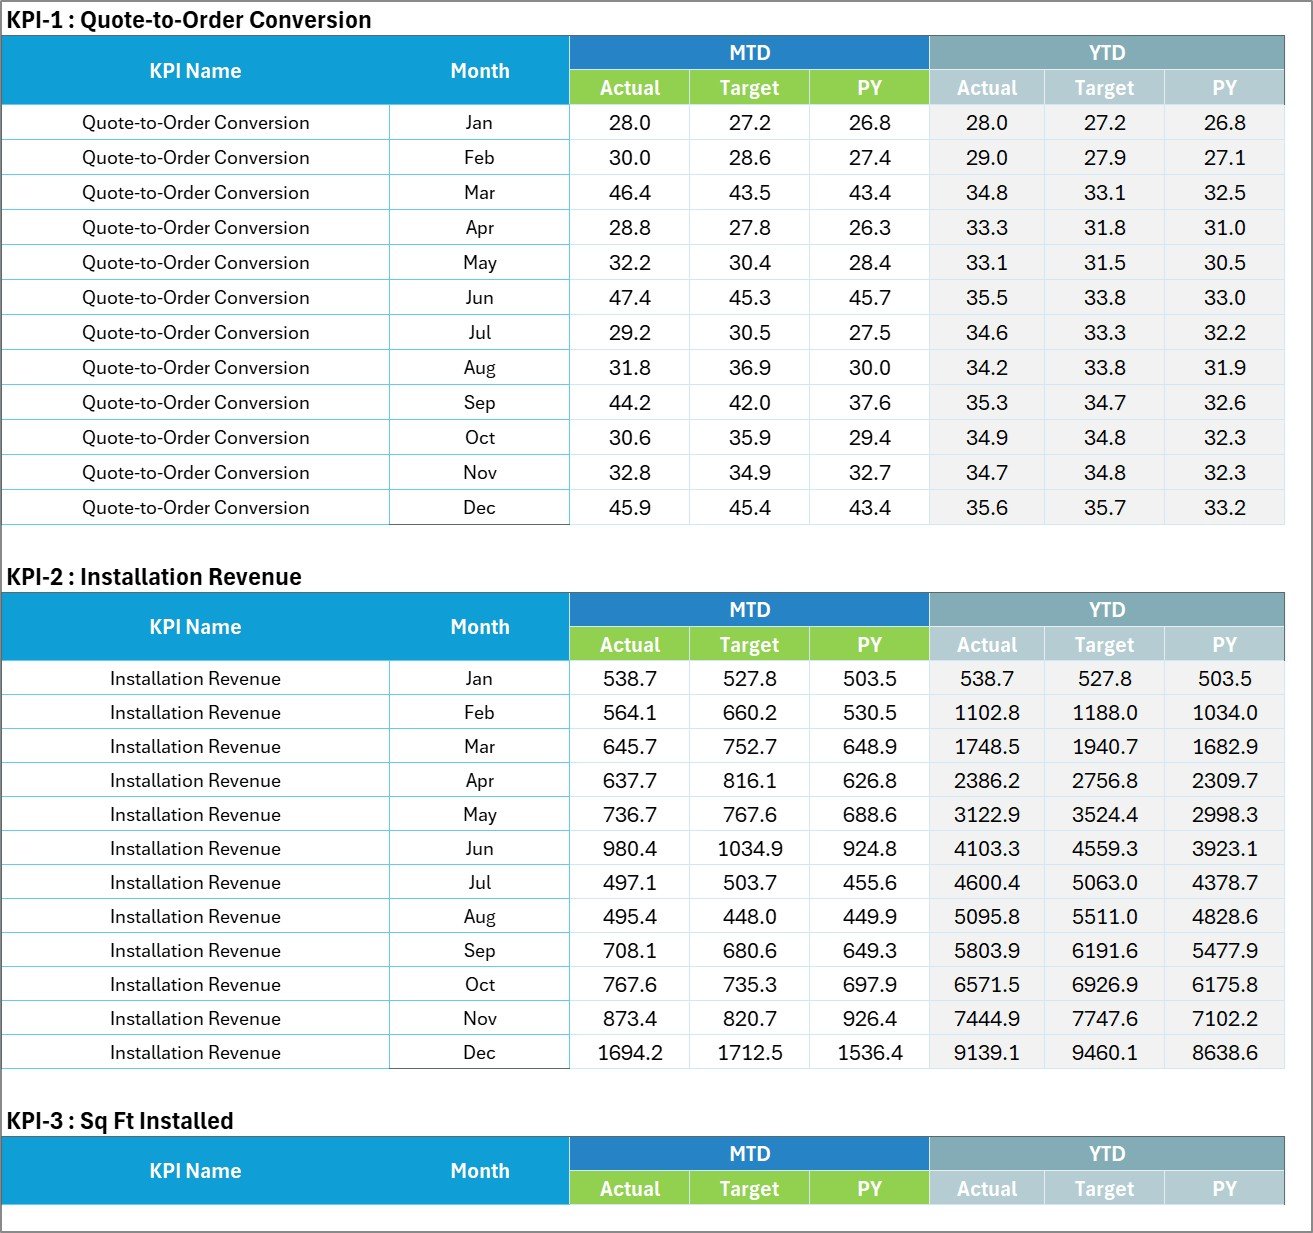
The only sheet you type numbers into. One numbered block per KPI – KPI-1 : Quote-to-Order Conversion, KPI-2 : Installation Revenue, and so on – each with twelve month rows and six columns: MTD Actual, Target and PY, then YTD Actual, Target and PY.
Both MTD and YTD are yours to fill. The workbook deliberately does not roll YTD up for you, because the correct roll-up differs by KPI: a sum for Sq Ft Installed and Jobs Completed, an average for Gross Margin, Crew Productivity and Customer Satisfaction. You record which rule you used in the YTD Basis column so the next person fills it the same way.
KPI Definition, Color Settings and Read Me
KPI Definition is the register: number, group, name, unit, formula, definition, type (UTB or LTB), YTD basis, and a Check column that turns red if two KPIs share a name – which matters, because every page looks a KPI up by name.
Color Settings holds two three-row RAG tables, one for upper-the-better KPIs and one for lower-the-better, plus the report title and the reporting year that feeds the month picker. Change 10% to 5% and every light on every page re-scores.
Read Me covers the same ground in nine short sections – what you type, why MTD and YTD are both yours, how UTB and LTB work, how to add a KPI, why names must be unique, and what the header controls do. Get More Templates closes the file with links to the wider catalogue.
Excel vs. Google Sheets vs. Paid Flooring Software – Feature Comparison
| This scorecard (Excel) | Google Sheets edition | Flooring / field-service SaaS | |
|---|---|---|---|
| Cost | $9.99 once | $8.99 once | $99-$300+ per user per month |
| Platform | Excel for Windows desktop, 2016+ | Any browser | Web plus mobile app |
| Setup time | Type KPI names and twelve months of figures | Same, in the browser | Weeks – crews, price book, integrations |
| Real-time collaboration | No – one owner updates the file | Yes | Yes |
| Mobile access | Limited | Yes | Yes |
| Customisable KPIs | Yes – all ten, room for twenty | Yes | Fixed catalogue plus paid reports |
| Data stays on your machine | Yes | No – Google Drive | No – vendor cloud |
| Year-1 cost at 5 users | $9.99 | $8.99 | $6,000-$18,000 |
| Takeoff, scheduling, invoicing | No | No | Yes |
Who Should Use This Template
It fits flooring installation companies and installation subcontractors that already keep the numbers somewhere – a job book, an accounting package, a crew day sheet – and want one monthly page for the management meeting. Office managers reporting to an owner, general managers running several crews, and anyone who has been asked for the numbers on one page every month will get value from it in an afternoon.
It is not the right tool if you want live scheduling, material takeoff or invoicing; if you need an automatic feed from QuickBooks, Xero or a CRM; if your team works only on phones or in Excel for the web; or if you report daily rather than monthly.
Real-World Use Cases
- The monthly owner meeting. One printed page instead of four reports, with a light beside every number.
- Diagnosing a conversion problem. A red quote-to-order tile at 30.6% sends you to KPI Trend to separate seasonality from a genuine slide.
- Holding waste to a ceiling. Material Waste Rate scored lower-the-better keeps a rise honest instead of dressing it as growth.
- Crew reviews. Crew Productivity in square feet per day next to First-Time-Right Rate gives a two-sided read on speed and quality.
- Bank or investor reporting. YTD Gross Margin and Installation Revenue against prior year, in a file that never leaves your machine.
Advantages of the Flooring Installation KPI Scorecard in Excel
- Fast to adopt. No model to build, no measures to write – name your KPIs and type figures.
- Honest scoring. UTB and LTB directions mean lower-is-better KPIs are not accidentally rewarded.
- Consistent month to month. The same ten tiles, the same bands, the same two ranked lists.
- Portable and private. One file, no add-ins, no cloud account, nothing to enable.
- Room to grow. Twenty KPI slots and a set picker for when ten stops being enough.
Opportunities for Improvement
Being straight about the limits: the workbook has no data connection, so somebody types the figures each month – about ten minutes once the routine is set. YTD is typed rather than calculated, which is a design choice but does mean two numbers per KPI per month. It holds one reporting year per file, so a new year means a new copy with last year moved into the PY columns. And the tile wall relies on camera pictures and sparklines, which need desktop Excel on Windows – the browser and phone versions will not render it faithfully. If any of those matter, the Google Sheets edition may suit better.
Best Practices
- Set the definitions before the first month. Agree what counts as a completed job and a signed contract, and write it into the Definition column.
- Set targets for all twelve months up front, including the seasonal peaks, so a busy month is not scored against a flat plan.
- Record the YTD rule in the YTD Basis column – sum or average – so the file survives a change of staff.
- Tune the RAG bands once. If 10% is too generous for waste, tighten the lower-the-better table and leave it alone thereafter.
- Close the month on a fixed date and keep the copy. A folder of twelve monthly PDFs is a year of history nobody has to reconstruct.
- Take three questions to the meeting, not ten – the Bottom 5 list picks them for you.
Explore Relevant Templates
The same scorecard in the browser: Flooring Installation KPI Scorecard in Google Sheets. The same Excel scorecard for other trades: Roofing Contractor KPI Scorecard in Excel and Painting Contractor KPI Scorecard in Excel. For heavier analysis of the same trade: Flooring and Tiles KPI Dashboard in Excel, Flooring and Tiles Dashboard in Excel and Flooring and Tiles Dashboard in Power BI. To run the jobs behind the numbers, see the Carpet and Flooring Business Management System Web App.
Frequently Asked Questions
Does the Flooring Installation KPI Scorecard in Excel use macros?
No. It is worksheet formulas, conditional formatting, camera pictures and sparklines. Nothing to enable, and no security prompt.
Can I replace the ten flooring KPIs with my own?
Yes. Type your own on KPI Definition – name, group, unit, formula, definition, UTB or LTB and YTD basis – then fill the matching numbered block on Input Data. There is room for 20 KPIs, shown ten at a time.
Does it connect to QuickBooks, Xero or a flooring CRM?
No. There is no query connection; the monthly figures are typed. That is what keeps the file macro-free and portable.
Will it run in Excel for the web or on a Mac?
It is built for Excel for Windows desktop, 2016 or later. The camera pictures and sparklines behind the tile wall do not render reliably elsewhere.
How long does the first setup take?
Plan an afternoon: agreeing definitions and targets takes longer than typing. After that a month close is about ten minutes.
Is this the same as your Flooring and Tiles KPI Dashboard?
No. This is the lighter scorecard line – month picker, tile wall, analysis page, trend page, driven by figures you type. The KPI Dashboard and the analytical Excel Dashboard for flooring are separate, heavier products built on a transaction table with slicers and pivot-driven charts.
What is in the download?
A ZIP holding the Excel workbook and a PDF user manual that walks through every sheet.
About the Author
Built by PK – Microsoft Certified Professional with 15+ years of Excel, Google Sheets, and Power BI experience. Founder of NextGenTemplates, reaching 300K+ subscribers across YouTube channels. Every template is hand-built and tested before release.
Conclusion
A flooring business does not need a bigger report; it needs the same page every month, scored the same way, with the awkward numbers impossible to miss. That is what this workbook does – ten KPIs, five groups, one month picker, and a Bottom 5 list that writes the agenda for you.
Get the Flooring Installation KPI Scorecard in Excel – instant download, $9.99, workbook plus PDF user manual. Need it wired to your own KPI list? Email info@nextgentemplates.com and we will quote a customisation.