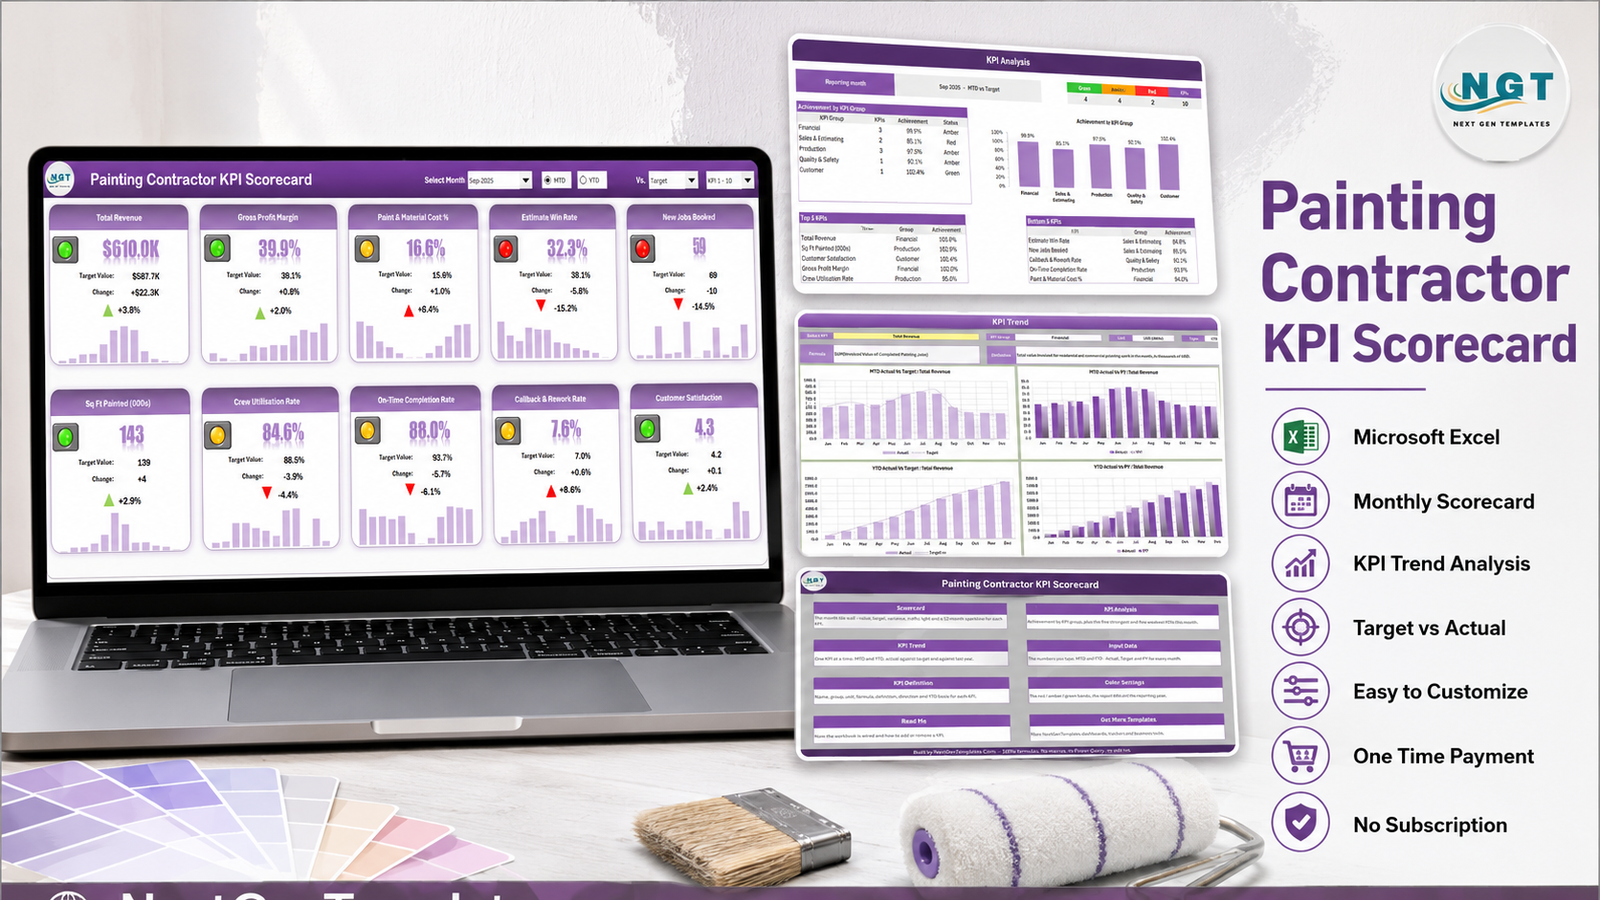
Most painting contractors already know their revenue. Far fewer can say, in one look, whether September was a good month. The Painting Contractor KPI Scorecard in Excel answers that in ten tiles: it takes ten painting-business metrics, compares each one to your target, and colours it green, amber or red. The sample month the workbook ships with reads 4 green, 4 amber and 2 red across five KPI groups, and the two reds – Estimate Win Rate at 84.8% of target and New Jobs Booked at 85.5% – are exactly the kind of thing a revenue-only report hides. Revenue was up 3.8% on target that month. The pipeline feeding it was not.
This is a monthly scorecard, not an analytical dashboard. There are no slicers over a job table and no drill-through. There is a month picker, an MTD/YTD switch, a comparison basis, traffic lights and two supporting pages. It is 100% formulas – no macros, no Power Query, no add-ins – and it opens in any Excel from 2016 onward.
Key Features of the Painting Contractor KPI Scorecard in Excel
- Ten painting KPIs on one tile wall. Total Revenue, Gross Profit Margin, Paint & Material Cost %, Estimate Win Rate, New Jobs Booked, Sq Ft Painted (000s), Crew Utilisation Rate, On-Time Completion Rate, Callback & Rework Rate and Customer Satisfaction.
- Five KPI groups. Financial (3), Sales & Estimating (2), Production (3), Quality & Safety (1) and Customer (1).
- A month picker in the header. Select Month moves the entire page from Jan-25 through Dec-25.
- MTD or YTD. A radio switch flips every tile between the reporting month and the year to date.
- Three comparison bases. The “Vs.” dropdown scores actual against Target, against the same period last year (PY), or against the Prior Month.
- Direction-aware scoring. Each KPI is tagged UTB (upper the better) or LTB (lower the better). Paint & Material Cost % coming in 6.4% above target draws a red arrow, not a green one – which is the correct reading, because for that KPI up is bad.
- Editable RAG bands. Green at or above target, amber within 10%, red beyond 10%. Three cells on Color Settings move them, and everything re-colours.
- A 12-month sparkline under every number.
- Room for 20 KPIs. The tile wall shows ten at a time; a set picker switches between KPI 1-10 and KPI 11-20.
- No macros. Formulas, conditional formatting, camera pictures and sparklines only.
Workbook Pages Explained
Home
A navigation wall. Eight linked tiles, each with a one-line description of the sheet behind it, and a footer that states the build honestly: “100% formulas. No macros, no Power Query, no add-ins.”
Scorecard
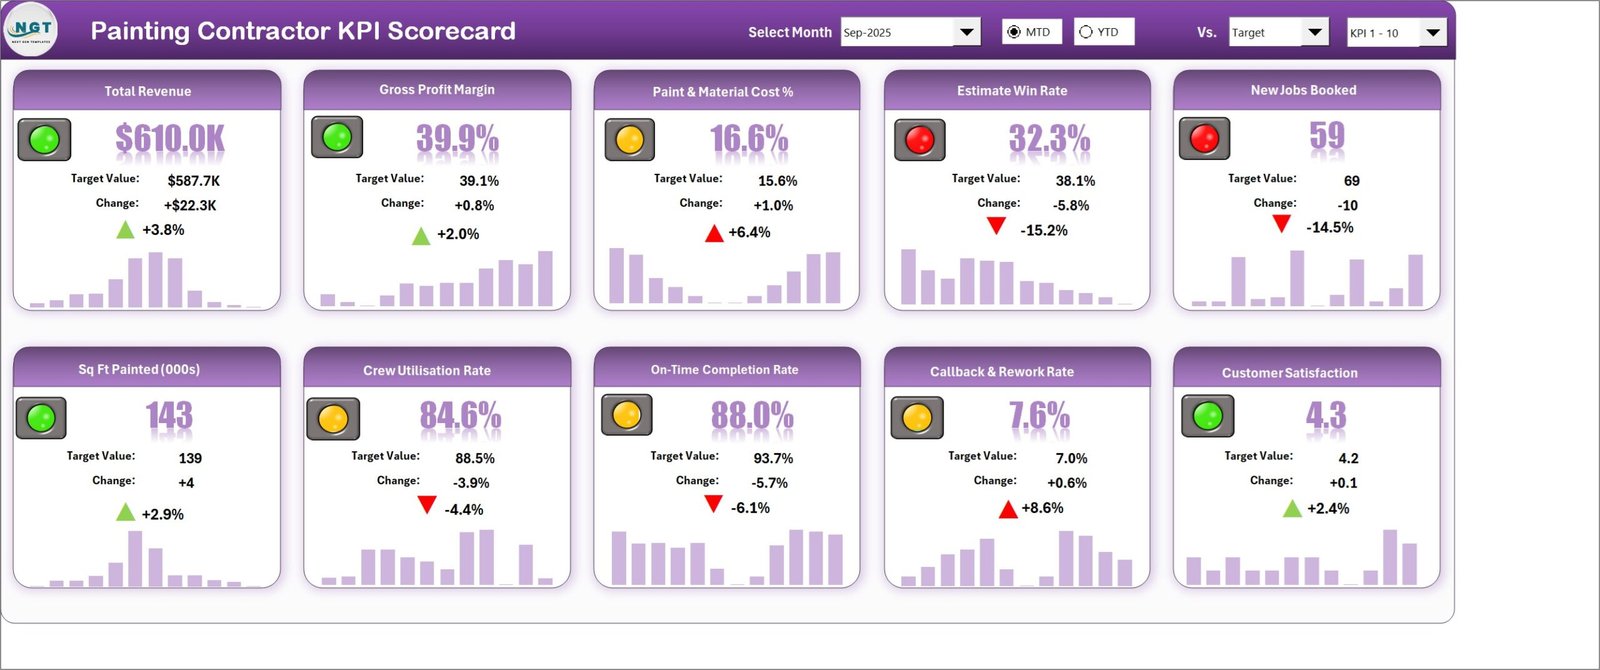
The page you will live on. Each KPI gets a card with a traffic light, the current value, the target value, the absolute change and the variance percentage with a direction-aware arrow, plus a 12-month sparkline. In the sample September 2025 month: Total Revenue $610.0K against a $587.7K target (+3.8%, green), Gross Profit Margin 39.9% against 39.1% (+2.0%, green), Paint & Material Cost % 16.6% against 15.6% (+6.4%, amber), Estimate Win Rate 32.3% against 38.1% (-15.2%, red), New Jobs Booked 59 against 69 (-14.5%, red), Sq Ft Painted 143 against 139 (+2.9%, green), Crew Utilisation 84.6% against 88.5% (-4.4%, amber), On-Time Completion 88.0% against 93.7% (-6.1%, amber), Callback & Rework 7.6% against 7.0% (+8.6%, amber) and Customer Satisfaction 4.3 against 4.2 (+2.4%, green).
KPI Analysis
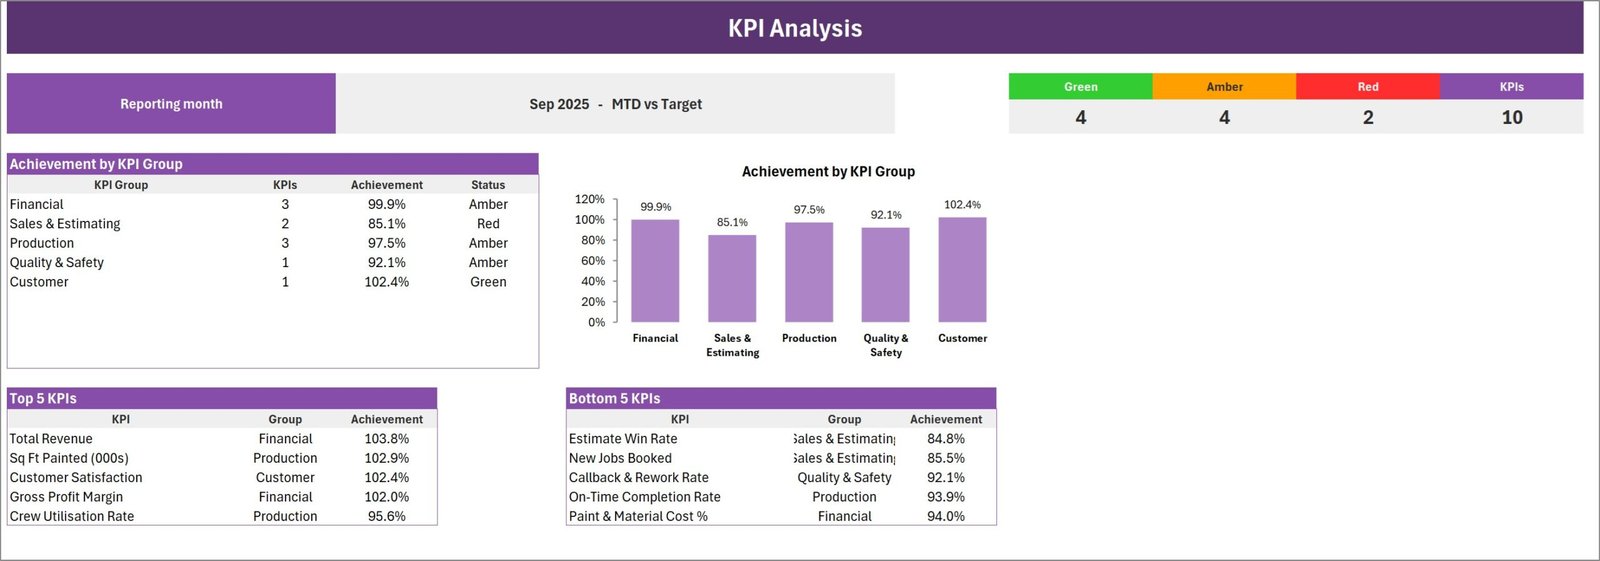
The group-level view. A header strip states the reporting month and basis (“Sep 2025 – MTD vs Target”) and counts the traffic lights: 4 green, 4 amber, 2 red, 10 KPIs. Below it, achievement by KPI group as both a table and a column chart – Customer 102.4% (green), Financial 99.9% (amber), Production 97.5% (amber), Quality & Safety 92.1% (amber), Sales & Estimating 85.1% (red). Two ranked tables finish the page: Top 5 KPIs led by Total Revenue at 103.8%, and Bottom 5 KPIs led by Estimate Win Rate at 84.8%.
KPI Trend
One KPI at a time. Pick a KPI and the page prints its group, unit, direction, formula and definition, then draws four charts: MTD Actual vs Target, MTD Actual vs PY, YTD Actual vs Target and YTD Actual vs PY. This is the page you take into a meeting when someone asks why a tile is red.
Input Data
The only sheet you type numbers into. Each of the 20 KPI slots gets its own block of twelve monthly rows with six columns: MTD Actual, Target and PY, then YTD Actual, Target and PY.
KPI Definition
The sheet that renames the product. Ten rows carrying number, KPI Group, KPI Name, Unit, Formula, Definition, Type (UTB/LTB), YTD Basis and a Check column that flags duplicate names. Change “Sq Ft Painted (000s)” to “Square Metres Coated” here and every page follows, because every page looks a KPI up by name.

Color Settings, Read Me and Get More Templates
Color Settings holds the RAG thresholds for UTB and LTB KPIs, the report title and the reporting year – the year is what makes the month picker read “Sep-25” rather than “Sep”. Read Me is nine short sections covering what you type, why YTD is yours to enter, direction logic, traffic lights, adding a KPI, unique names, the header controls and the macro-free build. Get More Templates links out to the wider catalogue.
Painting Contractor KPI Scorecard vs. Google Sheets vs. Paid Job-Management SaaS – Feature Comparison
| This scorecard (Excel) | Google Sheets scorecard | Paid job-management SaaS | |
|---|---|---|---|
| Cost | $9.99 one time | $8.99 one time | $79-$199 per user / month |
| Platform | Excel 2016+ on desktop | Any browser | Vendor cloud |
| Setup time | 15-30 minutes | 10-20 minutes | 2-6 weeks onboarding |
| Real-time team collaboration | Via OneDrive / SharePoint | Native | Native |
| Mobile access | Excel mobile app | Browser and Sheets app | Dedicated app |
| Customizable fields | Any KPI renameable, up to 20 | Any KPI renameable | Vendor-defined |
| Share with link | File share | View-only link | Seat-based login |
| Year-1 cost at 5 users | $9.99 | $8.99 | $4,700-$11,900 |
| Works offline | Yes | No | Partly |
| Per-job costing | No | No | Yes |
Who Should Use This Template
Residential and commercial painting contractors running roughly two to twenty crews, who already close a month and know the figures. Owners reporting upward to a partner, a lender or a board. Operations managers who run a standing Monday review and want the agenda ranked for them. Franchise support teams who want eleven locations reporting the same ten metrics on the same bands.
It is a poor fit if you want the workbook to derive revenue from invoices, if you need profitability per address, or if you need more than 20 KPIs. It is also a poor fit if nobody can supply a year-to-date figure, because the workbook does not roll YTD up for you – see Opportunities for Improvement below.
Real-World Use Cases
The lender pack. Marcus runs six residential crews. He closes the month, types twelve numbers, and sends one page to his bookkeeper and his lender. Because the tiles carry target and prior-year comparisons, he stopped writing a covering note.
The Monday review. Dana manages commercial crews and opens KPI Analysis. The Bottom 5 table hands her the agenda in rank order: Estimate Win Rate 84.8%, New Jobs Booked 85.5%, Callback & Rework Rate 92.1%. Fifteen minutes on the first two, five on the third.
The franchise standard. Priya ships the file to eleven franchisees with KPI names and targets pre-set. Every location reports the same ten metrics on the same RAG bands, so the pages stack.
Advantages of the Painting Contractor KPI Scorecard in Excel
- It is honest about direction. Two of the ten KPIs are lower-the-better, and the workbook scores them that way rather than showing a green arrow over a rising cost.
- The thresholds are yours. A 10% amber band is a default, not a law. Painting margins on commercial repaints tolerate different tolerances from residential; change three cells.
- Nothing to enable. Macro-enabled workbooks get stripped by mail gateways and blocked by IT policy. This one does not.
- It renames cleanly. Because every page resolves KPIs by name, renaming on one sheet propagates everywhere – and the Check column catches the duplicate-name mistake that would otherwise silently add two KPIs together.
- Small and fast. The file is a few hundred kilobytes. It opens instantly and it will still open in five years.
Opportunities for Improvement
Worth knowing before you buy, stated plainly:
- You type YTD yourself. The workbook never recalculates year-to-date, by design – a sum is right for revenue and square footage, an average is right for margin and satisfaction, and it will not guess. You record the rule you used in the YTD Basis column. It is a defensible choice, but it is more typing than a rolled-up model would need.
- No transaction layer. There is no job table, no per-address costing and no crew-level breakdown. Ten monthly figures in, one scorecard out.
- Twenty KPIs is the ceiling, and the tile wall shows ten at a time.
- Sample data ships with the file. The 2025 figures are realistic but invented. Clear them before anyone mistakes them for yours.
- Desktop Excel does the work. Camera pictures and sparklines render best in desktop Excel; Excel on the web is fine for reading, less good for editing.
Best Practices
- Set the reporting year and title on Color Settings first – the month picker depends on the year.
- Rename the KPIs before you type any numbers, so the Input Data blocks are already labelled correctly.
- Keep KPI names unique and short enough to fit a tile header.
- Agree the YTD rule per KPI once, write it in the YTD Basis column, and stop re-deciding it every month.
- Set targets for the whole year in one sitting. Monthly target-setting turns a scorecard into a negotiation.
- Review MTD vs Target for the operating conversation and YTD vs PY for the strategic one – the same page, two different questions.
- Tighten the amber band once the process is stable. A band that never shows red is not measuring anything.
- Microsoft’s own guidance on using sparklines to show data trends is a good primer if you want to restyle the mini-charts on the tiles.
Explore Relevant Templates
- Painting Contractor KPI Scorecard in Excel – the template this article describes.
- HVAC Contractor KPI Scorecard in Excel – same build, heating and cooling KPI set.
- Electrical Contractor KPI Scorecard in Excel – same build, electrical KPI set.
- Plumbing Business KPI Scorecard in Excel – the first of the trade scorecards.
- Job Work Order Data Entry System in Excel – capture the work orders whose totals feed a scorecard like this.
Frequently Asked Questions
Is this the same as a painting contractor dashboard?
No, and the distinction matters. A dashboard slices a transaction table with filters. This is a monthly scorecard: a fixed KPI list, a month picker, targets and traffic lights. If you want slicers over job records, look at the analytical dashboards instead.
Does it need macros?
No. It is 100% formulas, conditional formatting, camera pictures and sparklines, and it opens in any Excel from 2016 onward.
Can I use my own KPIs?
Yes. Rename any row on KPI Definition and every page follows. There is room for 20 KPIs, shown ten at a time.
Why does it not calculate year-to-date automatically?
Because the right roll-up differs by KPI. Revenue and square footage sum; margin, win rate and satisfaction average. The workbook asks you for the finished figure and for the rule you used, rather than guessing.
How are green, amber and red decided?
Green is at or above target, amber is within 10%, red is more than 10% off – and for lower-the-better KPIs the bands invert. All three thresholds sit in editable cells on Color Settings.
Is there a Google Sheets version?
Yes. A Painting Contractor KPI Scorecard in Google Sheets is published separately for teams that work in a browser. It is the same scorecard concept on a different platform with its own KPI list – not an export of this file – so pick the platform your team actually reports in.
What is in the download?
A single ZIP containing the .xlsx workbook and the Excel KPI Scorecard user manual in PDF. No installer and no add-in.
About the Author
Built by PK – Microsoft Certified Professional with 15+ years of Excel, Google Sheets, and Power BI experience. Founder of NextGenTemplates, reaching 300K+ subscribers across YouTube channels. Every template is hand-built and tested before release.
Conclusion
A painting business that only reports revenue will keep being surprised. The Painting Contractor KPI Scorecard in Excel puts ten metrics, five groups and a full year of context on one page, scores each one in the correct direction against a target you set, and does it without a single macro. The sample month makes the case on its own: revenue green, margin green – and the estimating pipeline red, three months before that shows up in the bank.
Get the Painting Contractor KPI Scorecard in Excel – one payment, instant download, no subscription.
More Excel walkthroughs and template builds on YouTube: youtube.com/@PKAnExcelExpert.