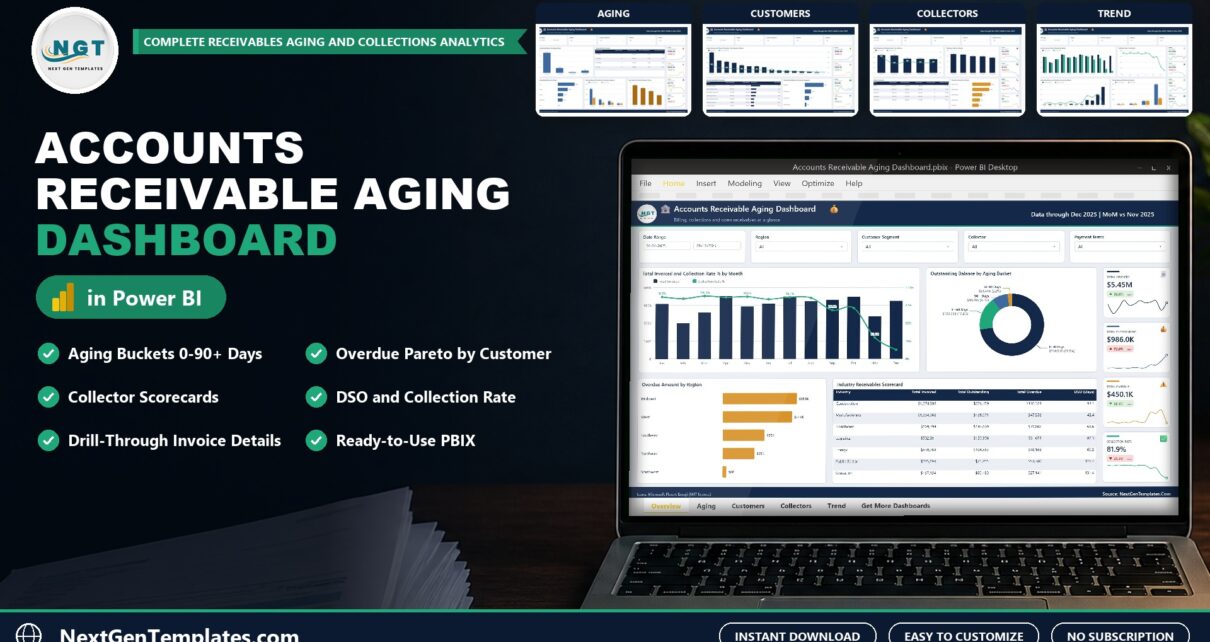
Late payments hide inside long invoice lists. The Accounts Receivable Aging Dashboard in Power BI groups every open invoice into aging buckets and shows who owes what, which customers pay late and how each collector is doing.
Watch the Accounts Receivable Aging Dashboard in Power BI: AR Aging and DSO walkthrough
What Is an Accounts Receivable Aging Dashboard?
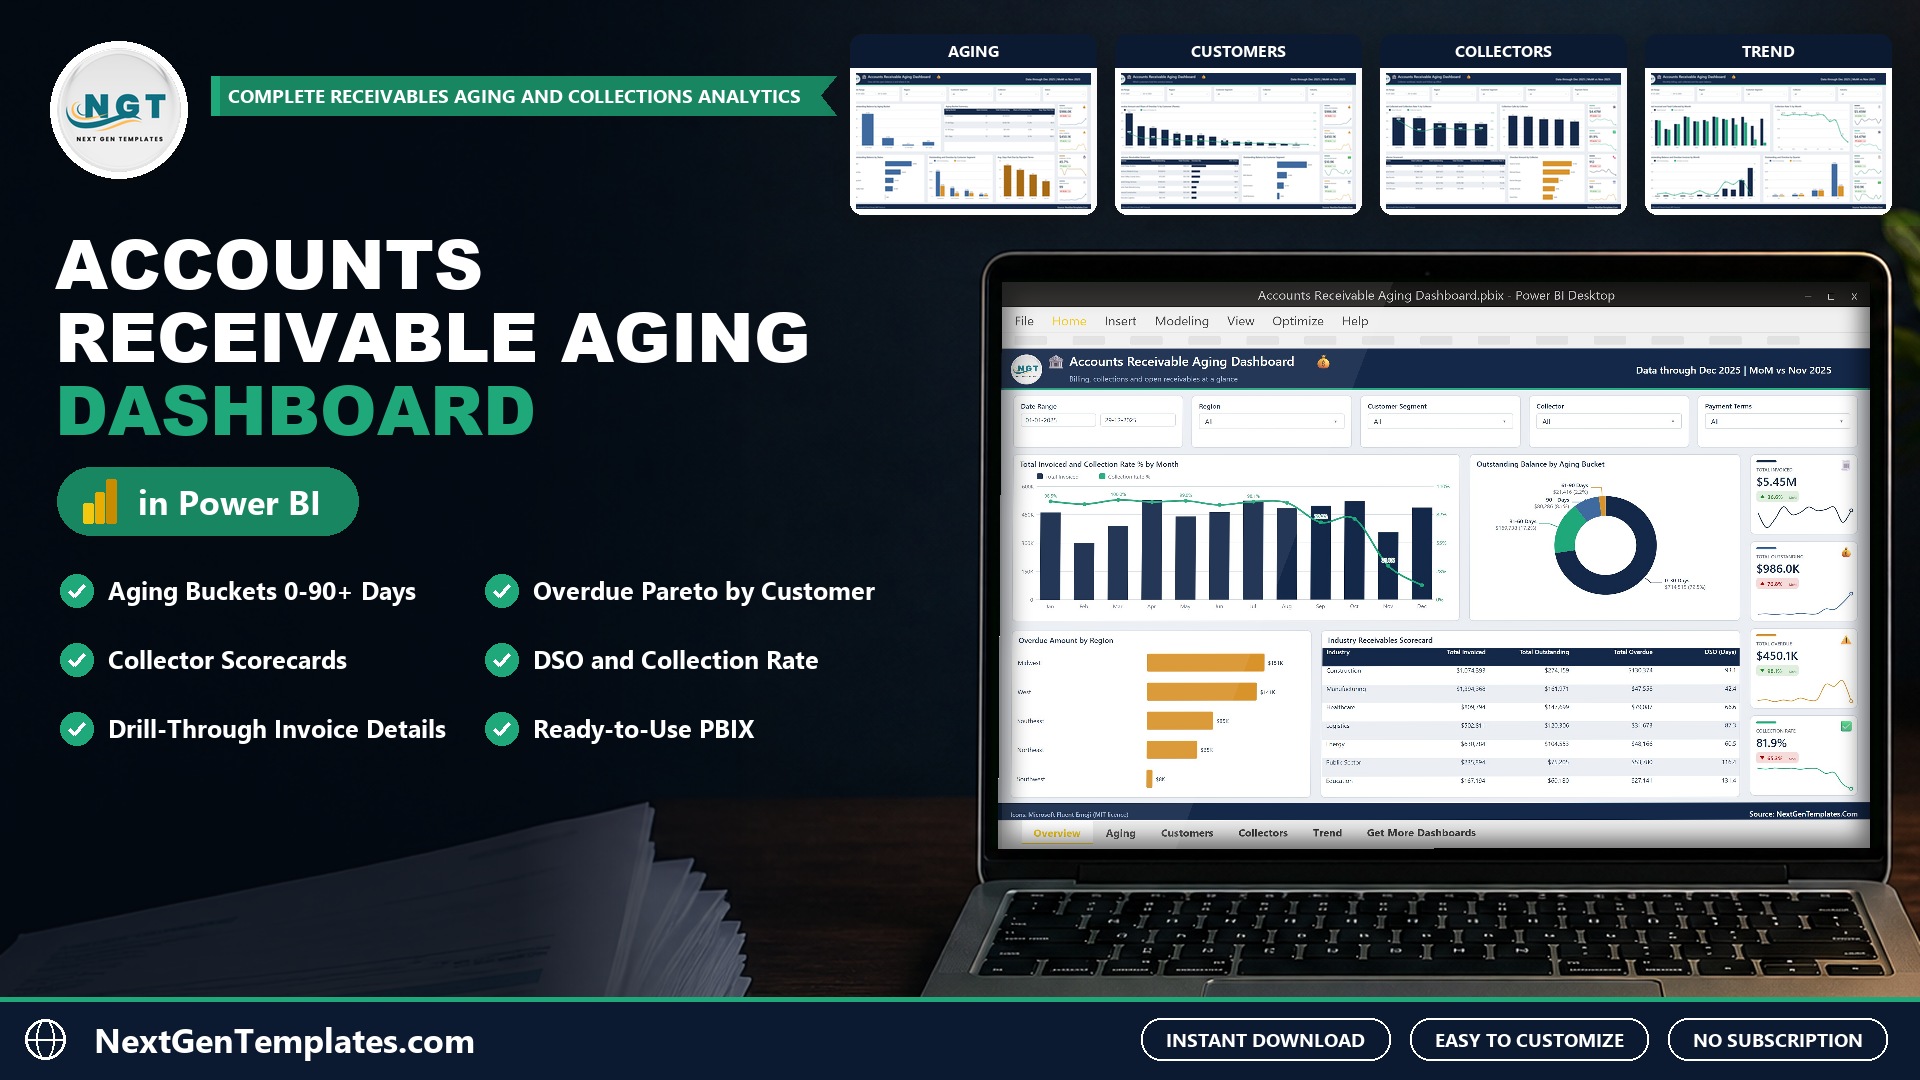
An accounts receivable aging dashboard shows the money customers owe you, split by how long it has been outstanding. This one is a Power BI report built on an Excel data file. You add your invoices, click Refresh, and the Overview, Aging, Customers, Collectors and Trend pages update.
Inside the Dashboard
Overview Page
Total Invoiced, Total Outstanding, Total Overdue and Collection Rate cards with month-over-month change and trend lines, invoiced and collection rate by month, outstanding by aging bucket, overdue by region and an industry scorecard.
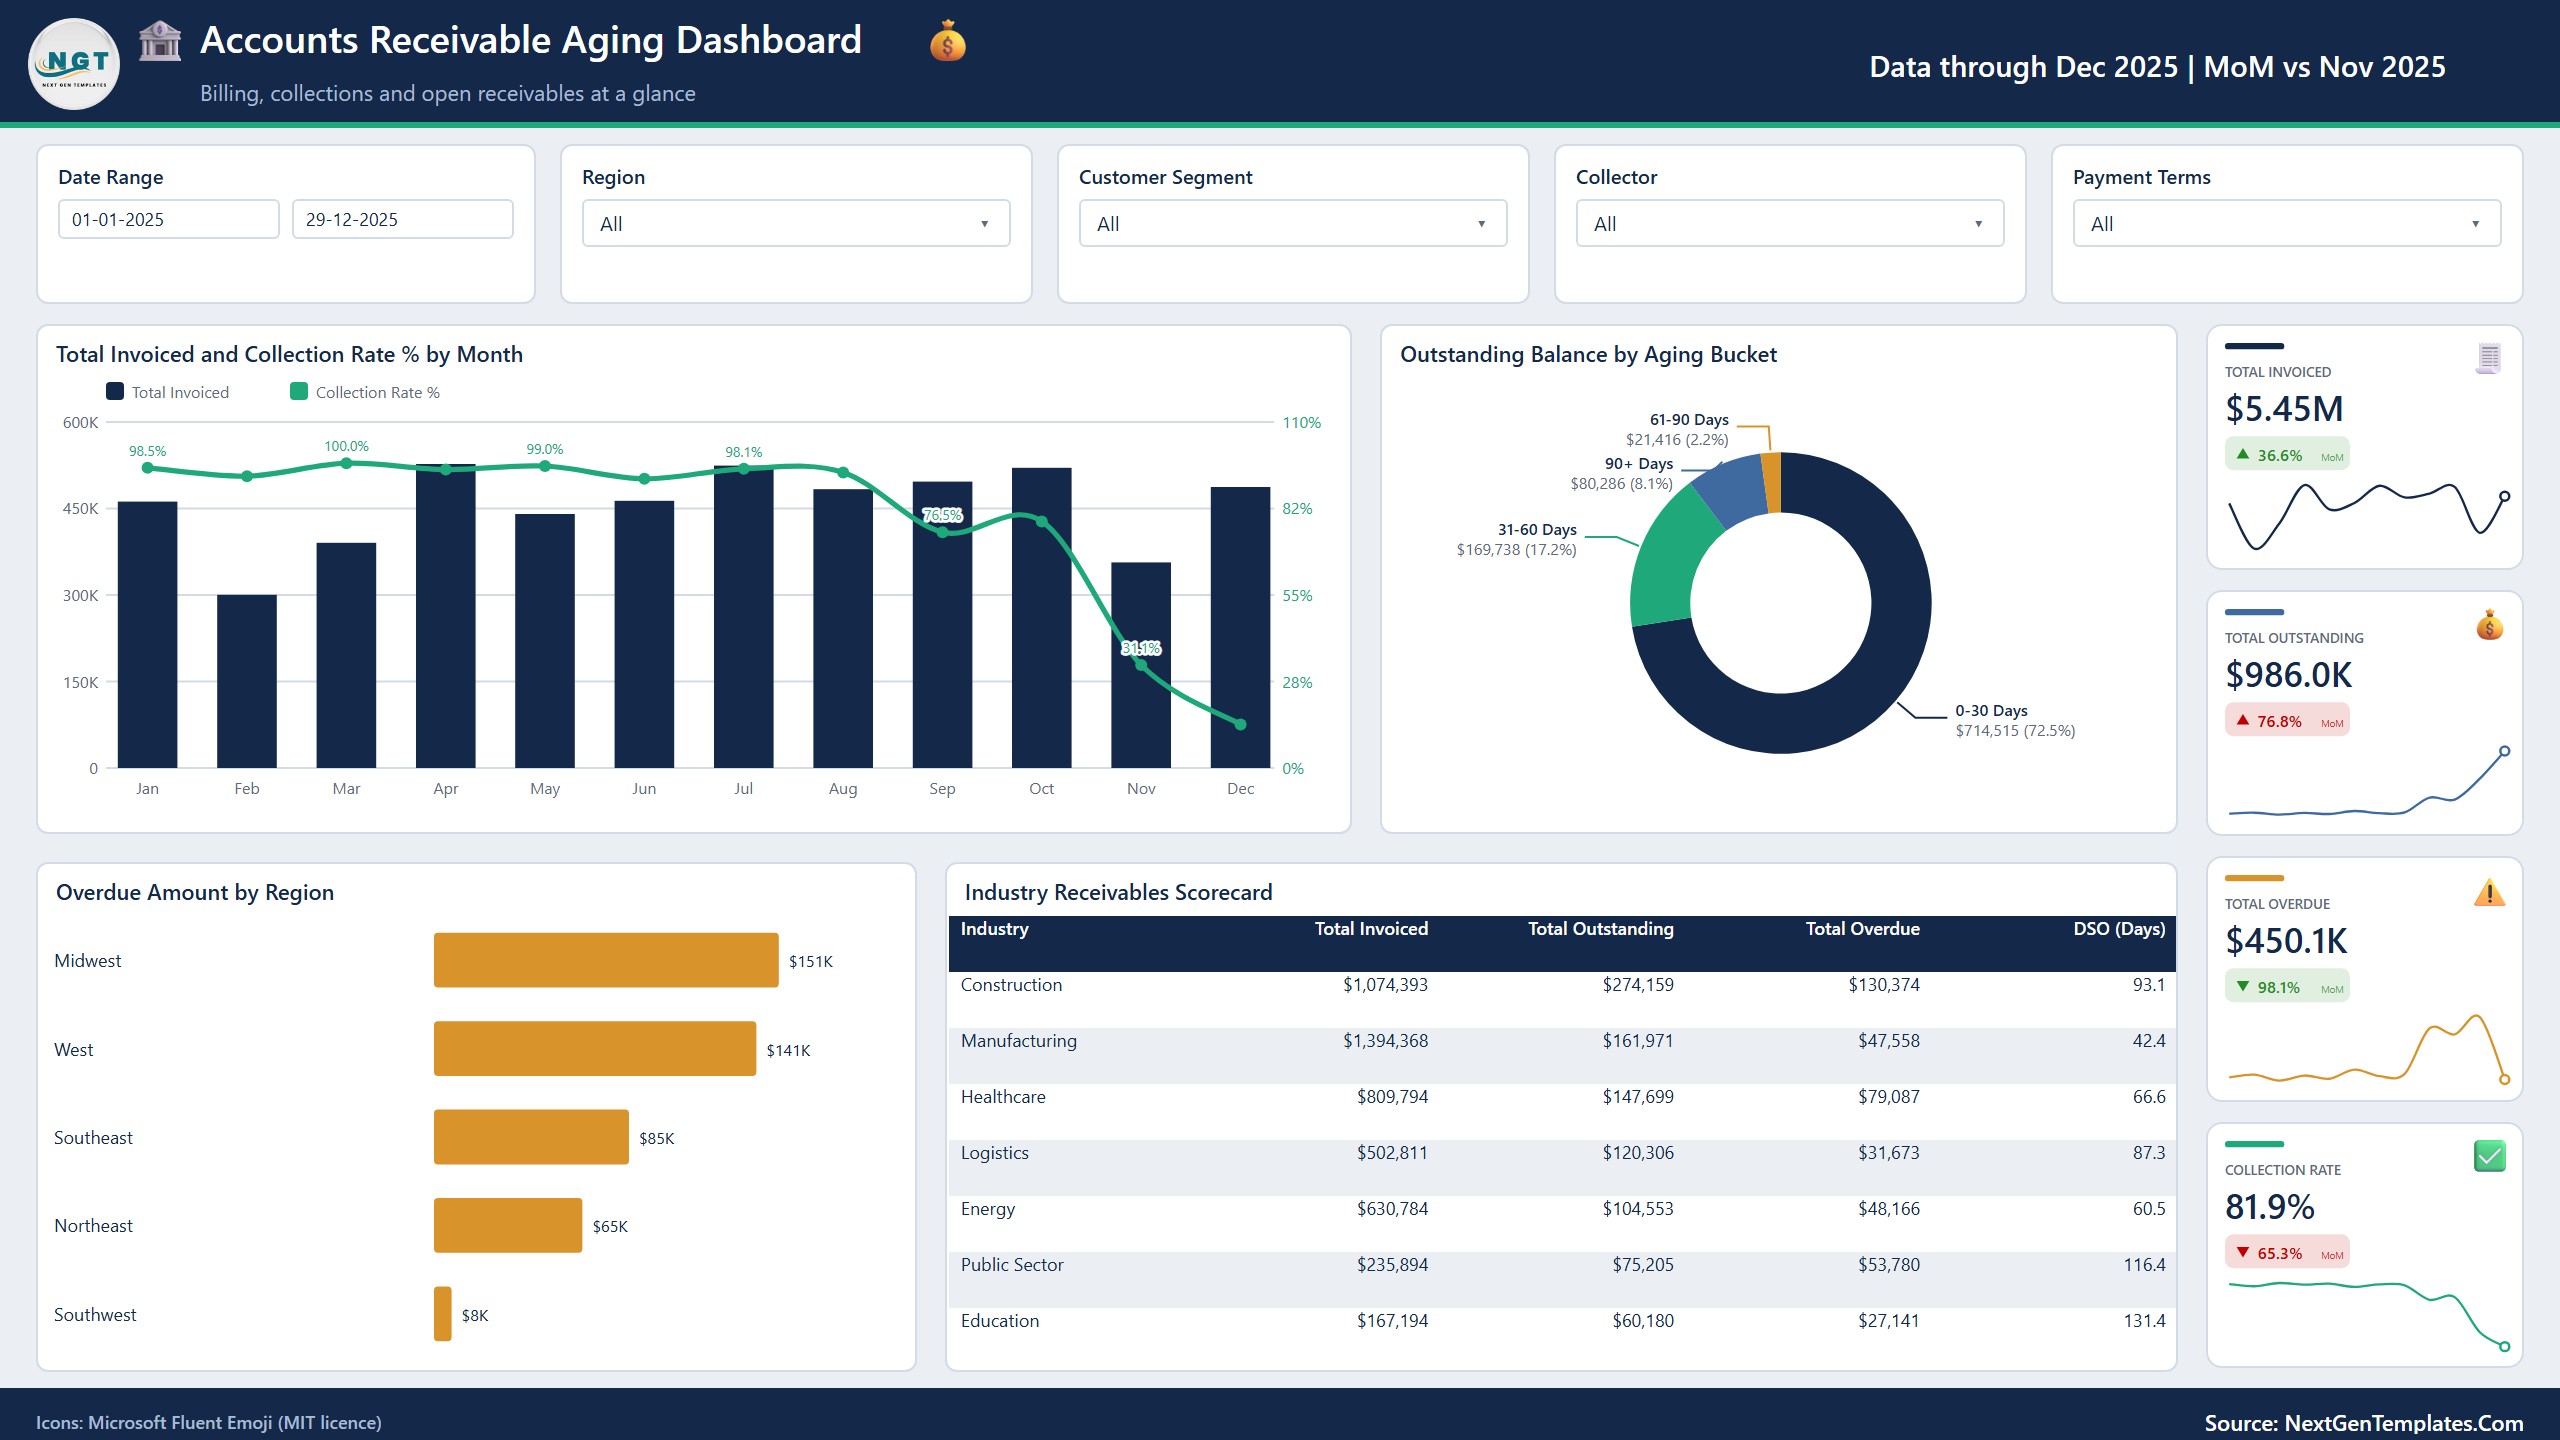
Aging Page
Outstanding by aging bucket (0-30, 31-60, 61-90 and 90+ days), an aging bucket summary with average days past due, outstanding by status and customer segment, and days past due by payment terms.
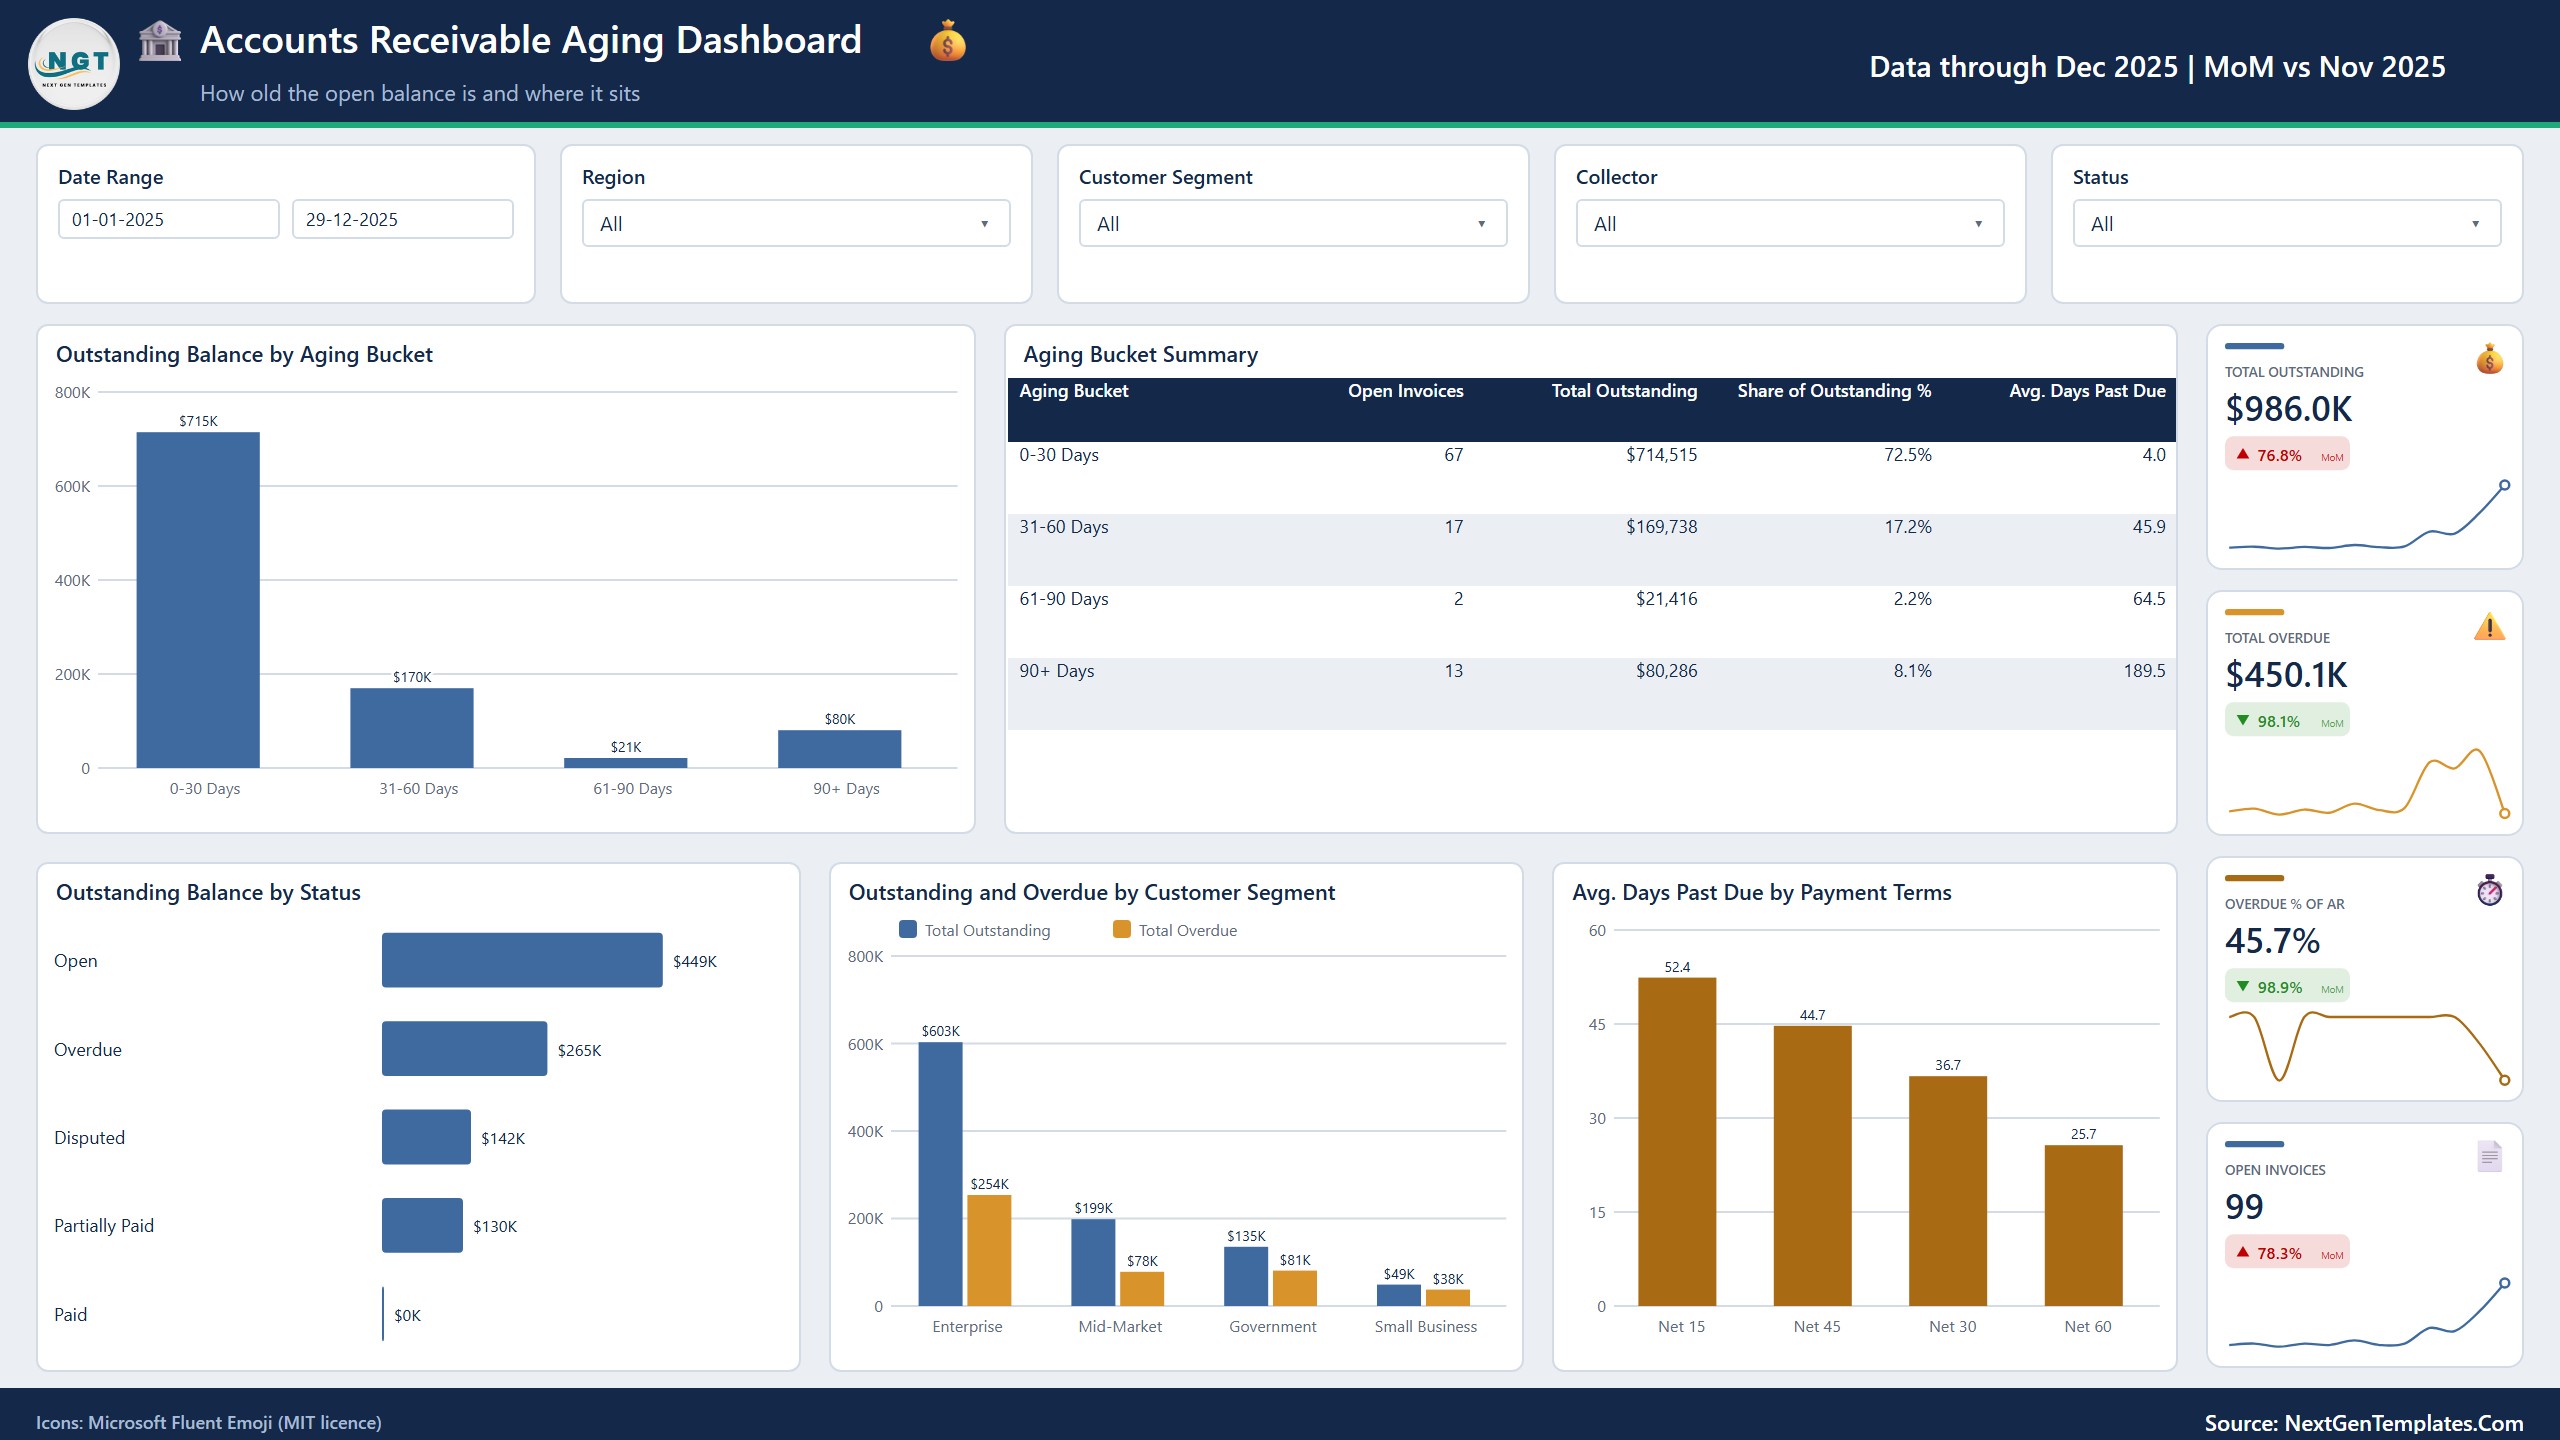
Customers Page
An overdue Pareto by customer, a customer receivables scorecard with DSO, and outstanding by customer segment.
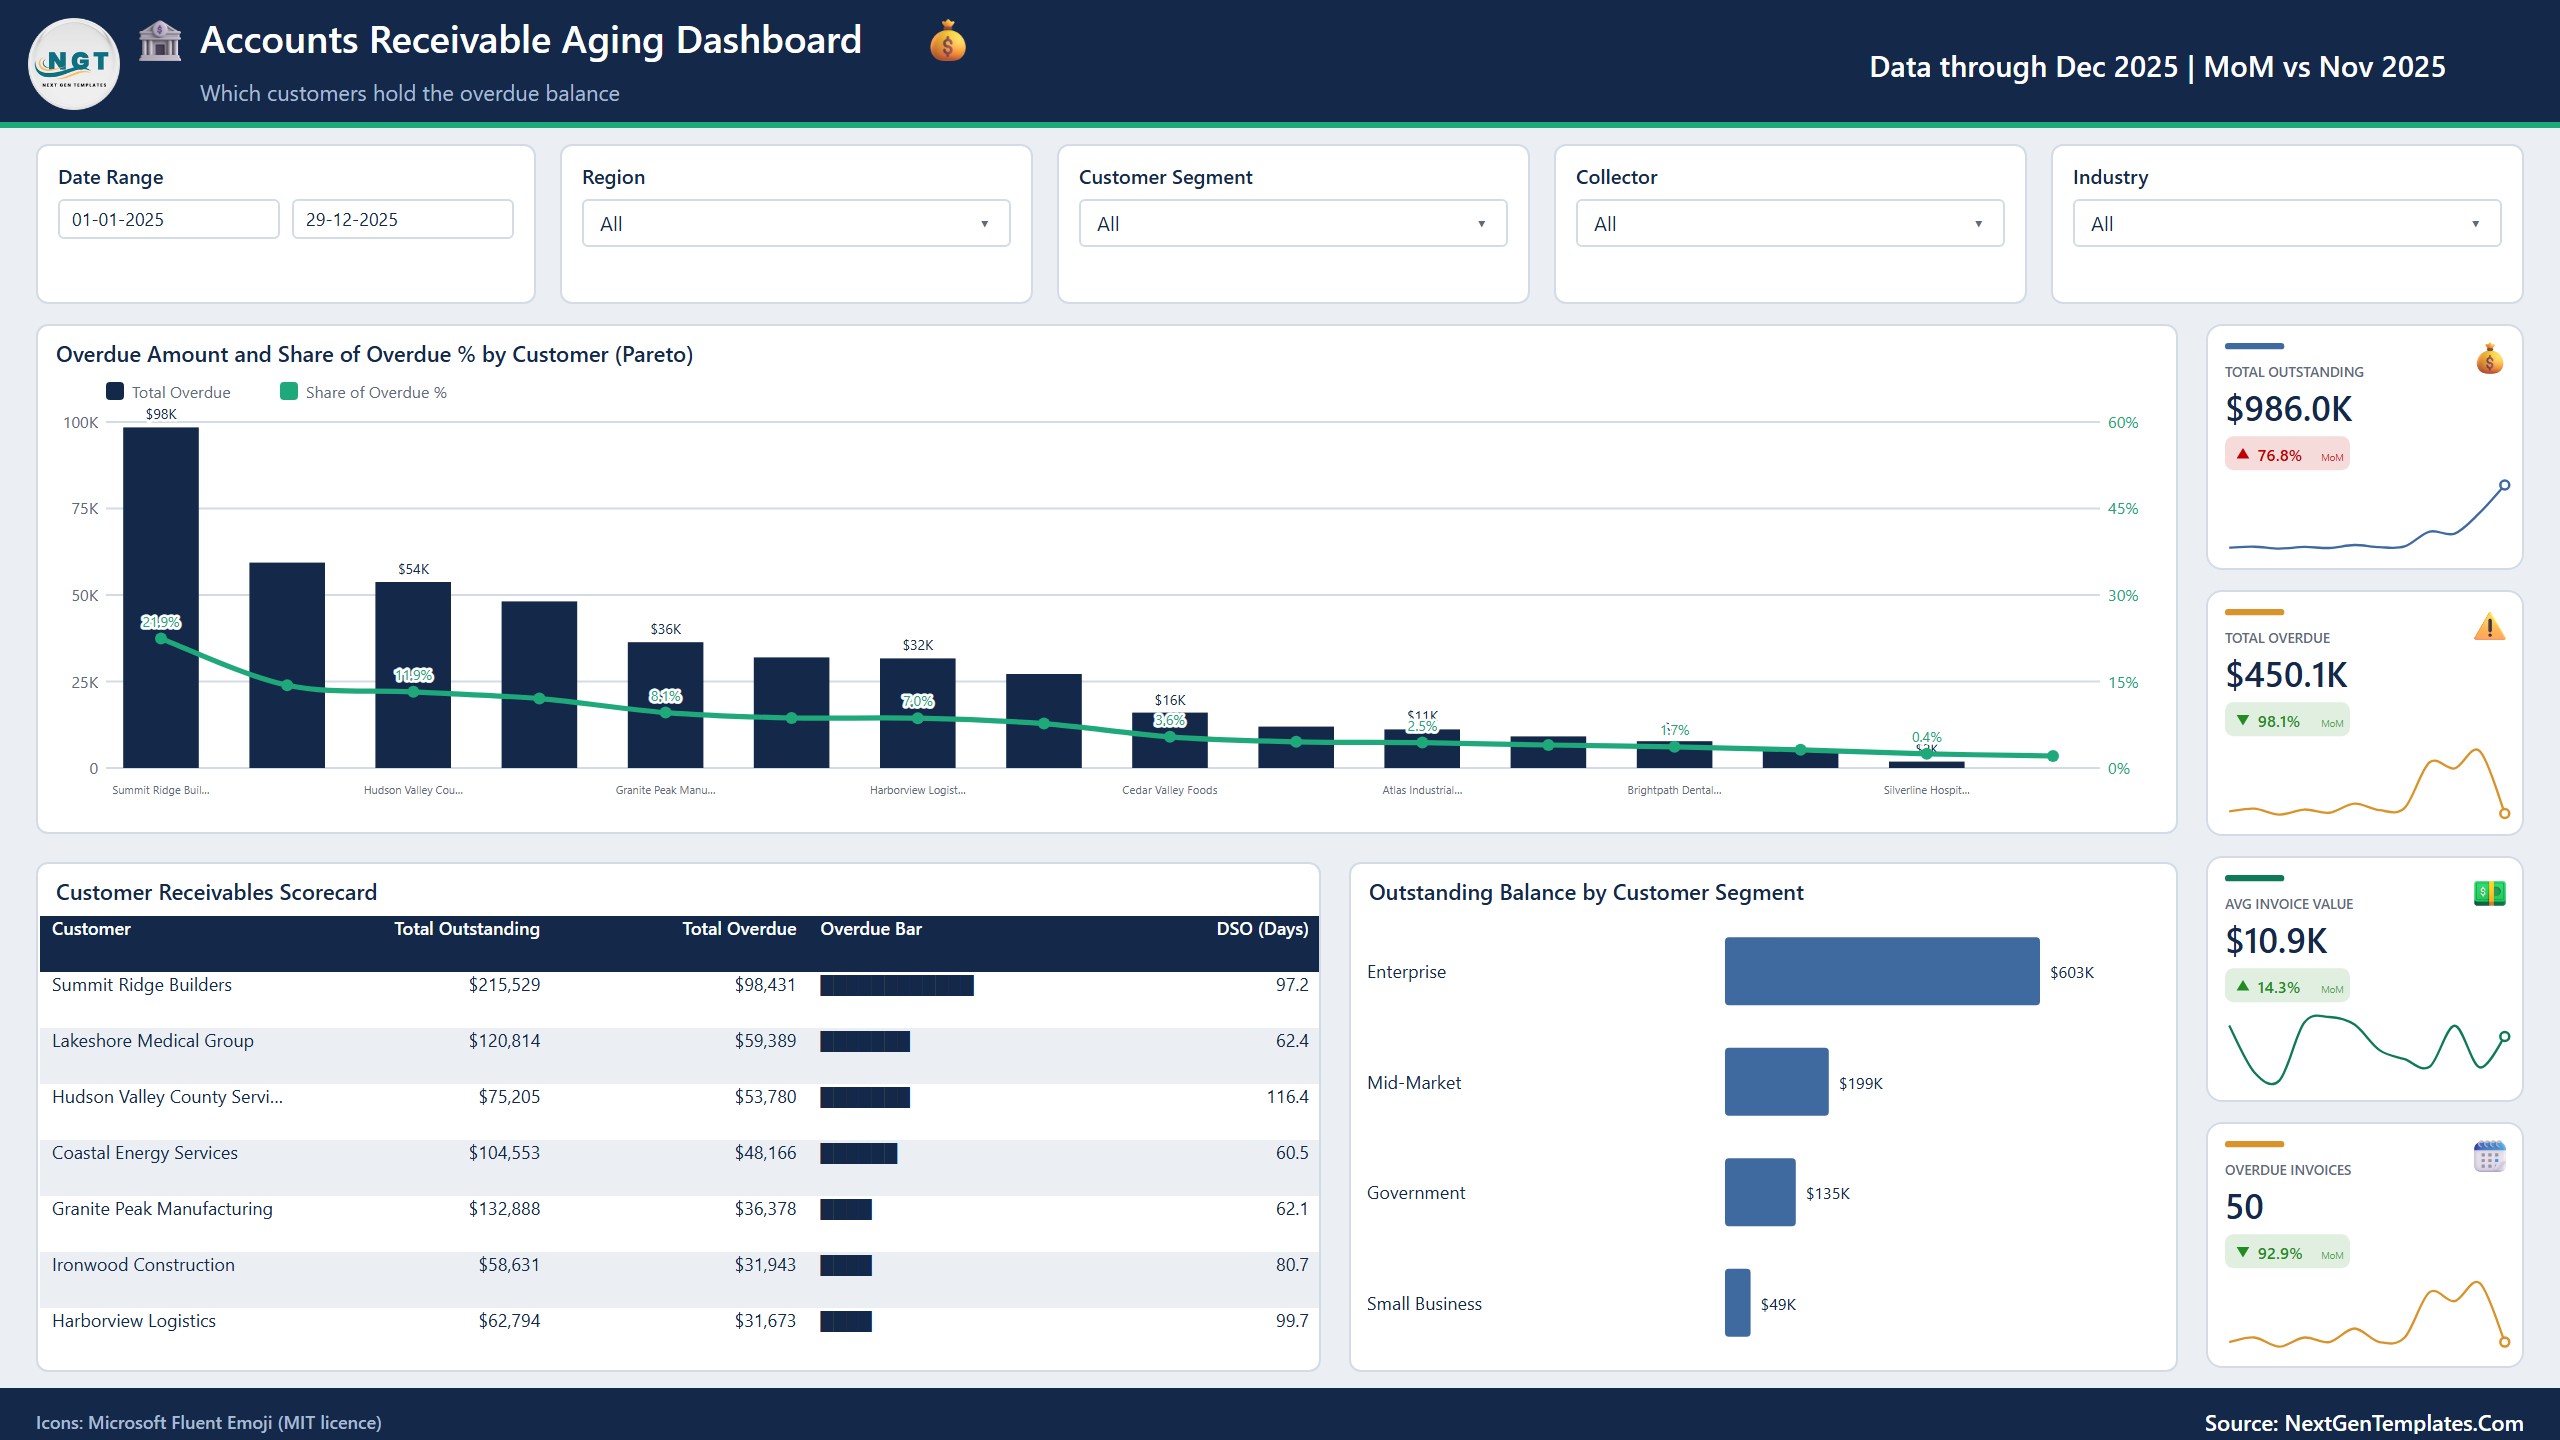
Collectors Page
Collected amount and collection rate, collection calls, a collector scorecard and overdue by collector.
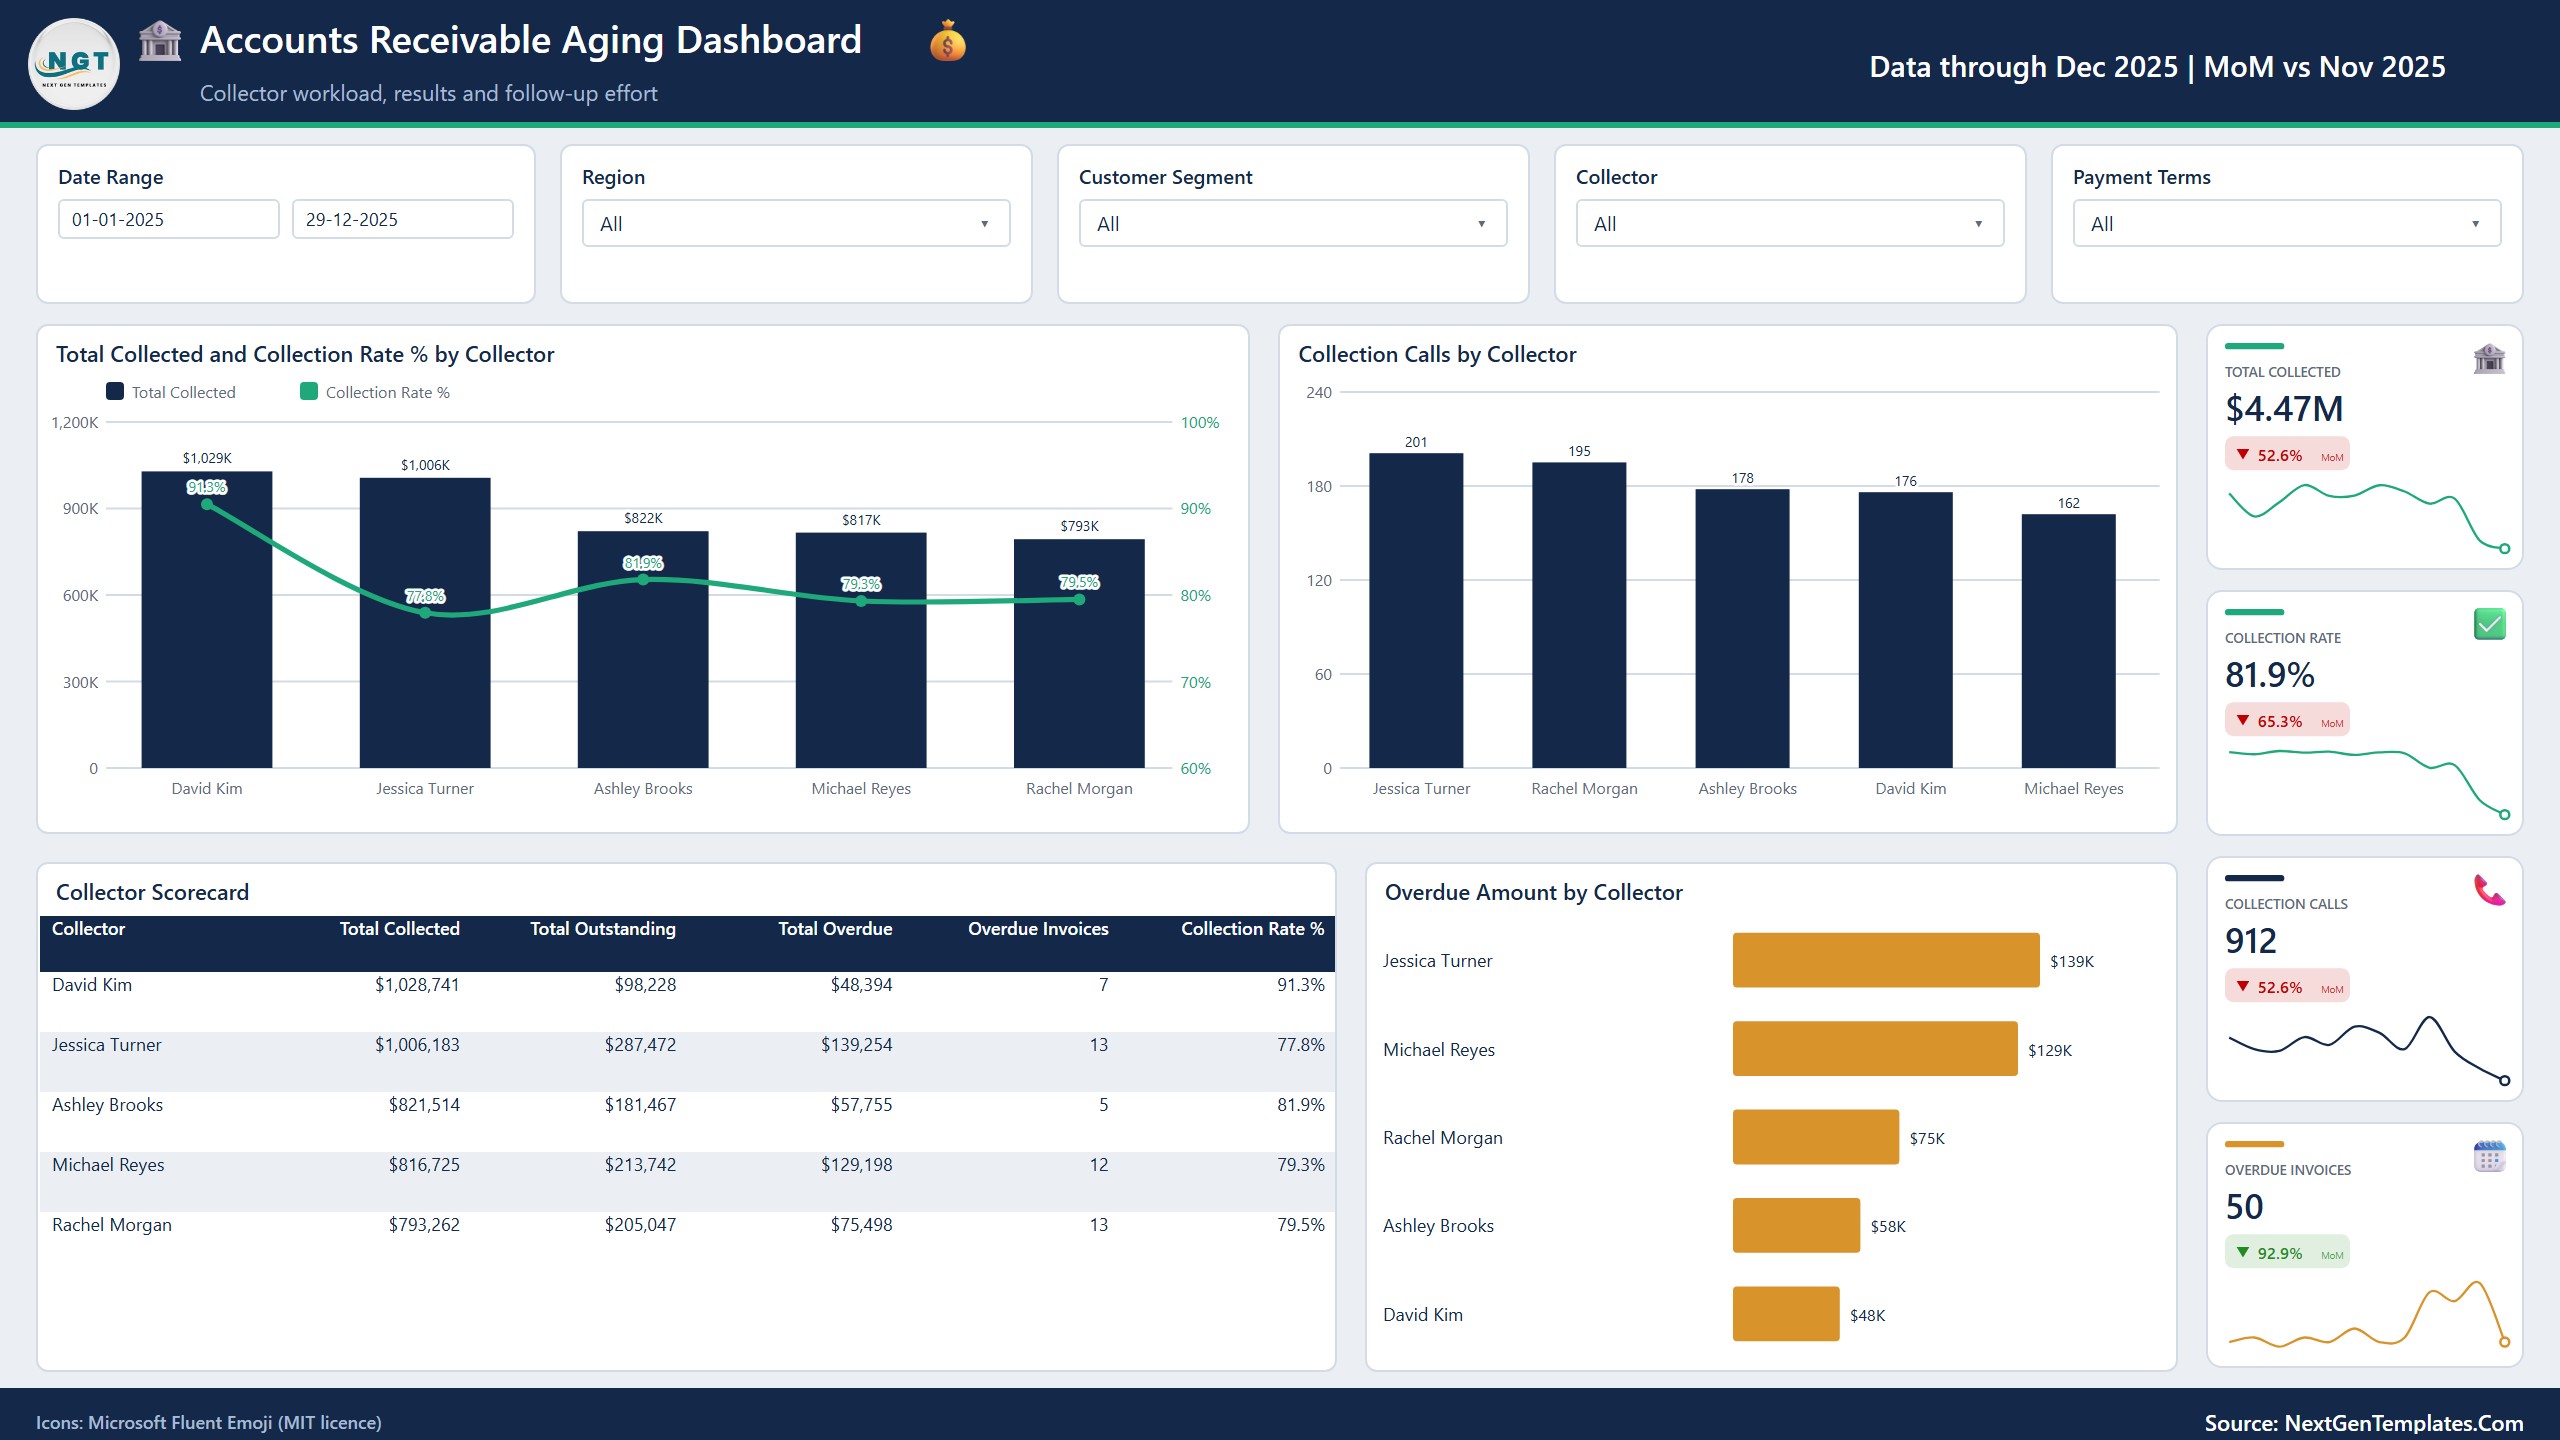
Trend Page
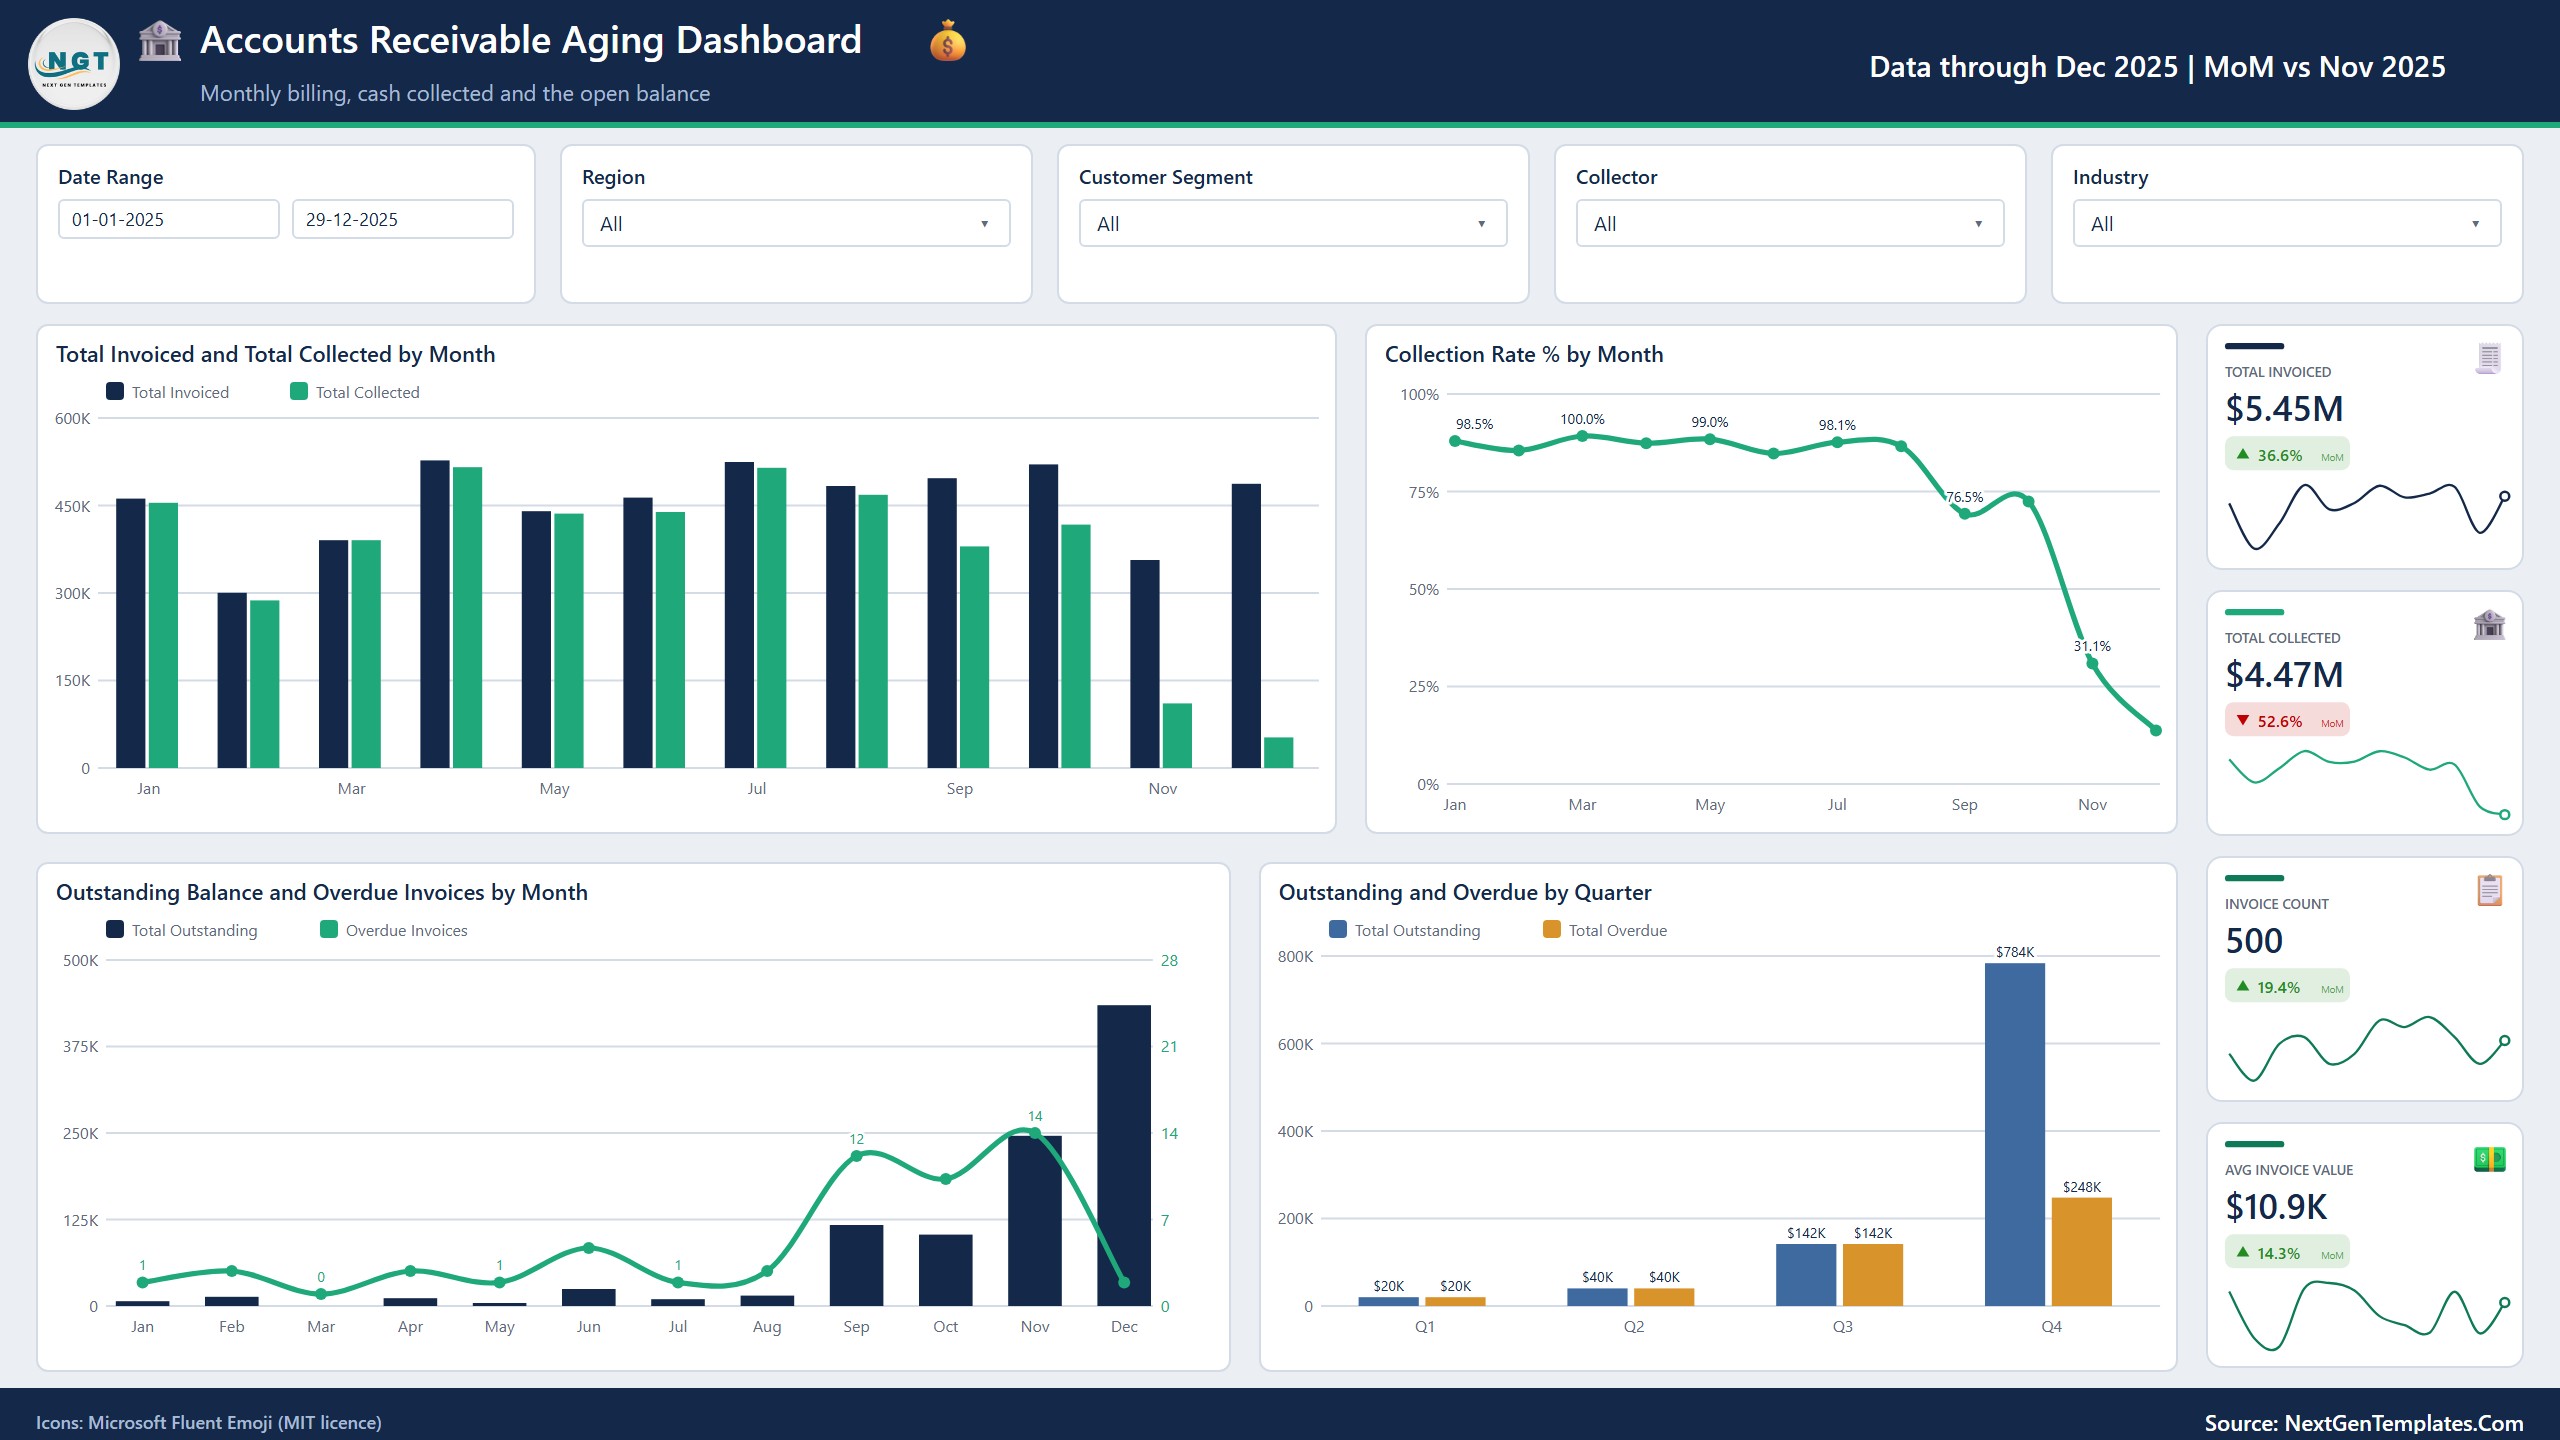
Invoiced versus collected by month, collection rate by month, and outstanding and overdue invoices by month and by quarter.
How It Works
The Excel data file holds one row per invoice, with the outstanding balance, aging bucket and overdue amount for each. Five synced filters (date range, region, customer segment, collector and a page-specific filter) apply across the pages. Right-click a customer, bucket or month and choose Drill through to open a Details page with every invoice behind the number. Two tooltip pages show aging bucket and month details when you hover.
Pros and Limits
- One report for outstanding, overdue, DSO and collection rate
- Drill-through from any number to the invoices behind it
- No subscription; open the .pbix in the free Power BI Desktop
- It is not a live connector to accounting software, so you add data and refresh yourself
- The 500 sample invoices are fictional
Who Should Use It
Credit controllers and finance managers can open the Aging page every Monday and see which buckets grew. Collections teams can use the Collectors page to compare calls made with the collection rate each person achieves. Business owners who invoice on credit can use the Overview cards to see, in a few seconds, how much of the billed amount has actually been collected.
How to Read an Aging Report
Start with the 90+ day bucket, because the oldest invoices are the hardest to collect. Then look at the Customers page: the Pareto shows whether a few customers hold most of the overdue balance. If they do, a handful of phone calls will move the number. If the overdue amount is spread across many customers, look at payment terms on the Aging page and at the collection rate by month on the Trend page to see whether the problem is getting better or worse.
Frequently Asked Questions
Does it connect to my accounting software?
No. It is an add-data-and-refresh template. Add your invoices to the Excel data file that comes in the ZIP, click Refresh in Power BI, and every card and chart updates. There is no live link to QuickBooks, Xero or any other system.
Do I need Power BI Pro?
No. Open the .pbix file in Power BI Desktop, which is free. Publishing to the Power BI service is optional and is your choice.
What are the aging buckets?
Outstanding balances are grouped into 0-30, 31-60, 61-90 and 90+ days past due, using each invoice’s due date and status.
How does the drill-through work?
Right-click a customer, bucket or month in a visual and choose Drill through to open the Details page with every invoice behind that number.
What are the two tooltip pages?
Hover a bar in the aging bucket chart or a month in the trend charts and a small report page appears with the aging bucket or month details.
Is the sample data real?
No. The 500 invoices in the Excel file are fictional. Replace them with your own invoices and click Refresh.
Can I keep real customer data in it?
Yes, but a Power BI file is only as private as where you store and share it. Keep your copy somewhere access-controlled and share it with named people only.
Get the Accounts Receivable Aging Dashboard in Power BI
Get the dashboard here: Accounts Receivable Aging Dashboard in Power BI. If you prefer a workbook, try the Accounts Receivable Aging Dashboard in Excel.