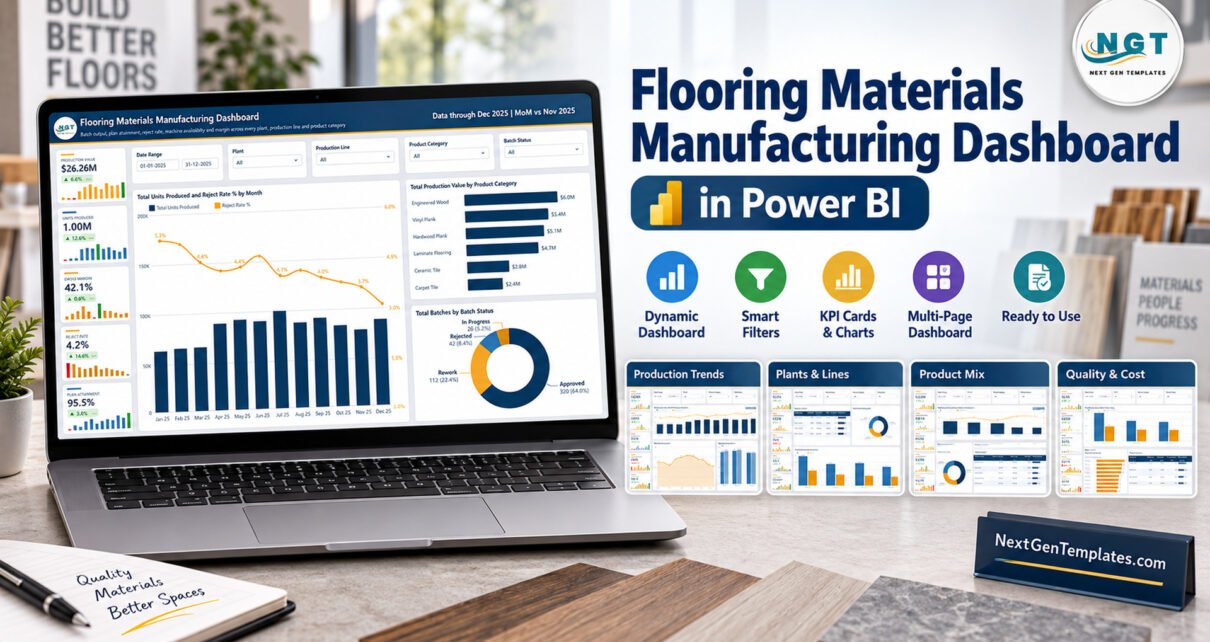
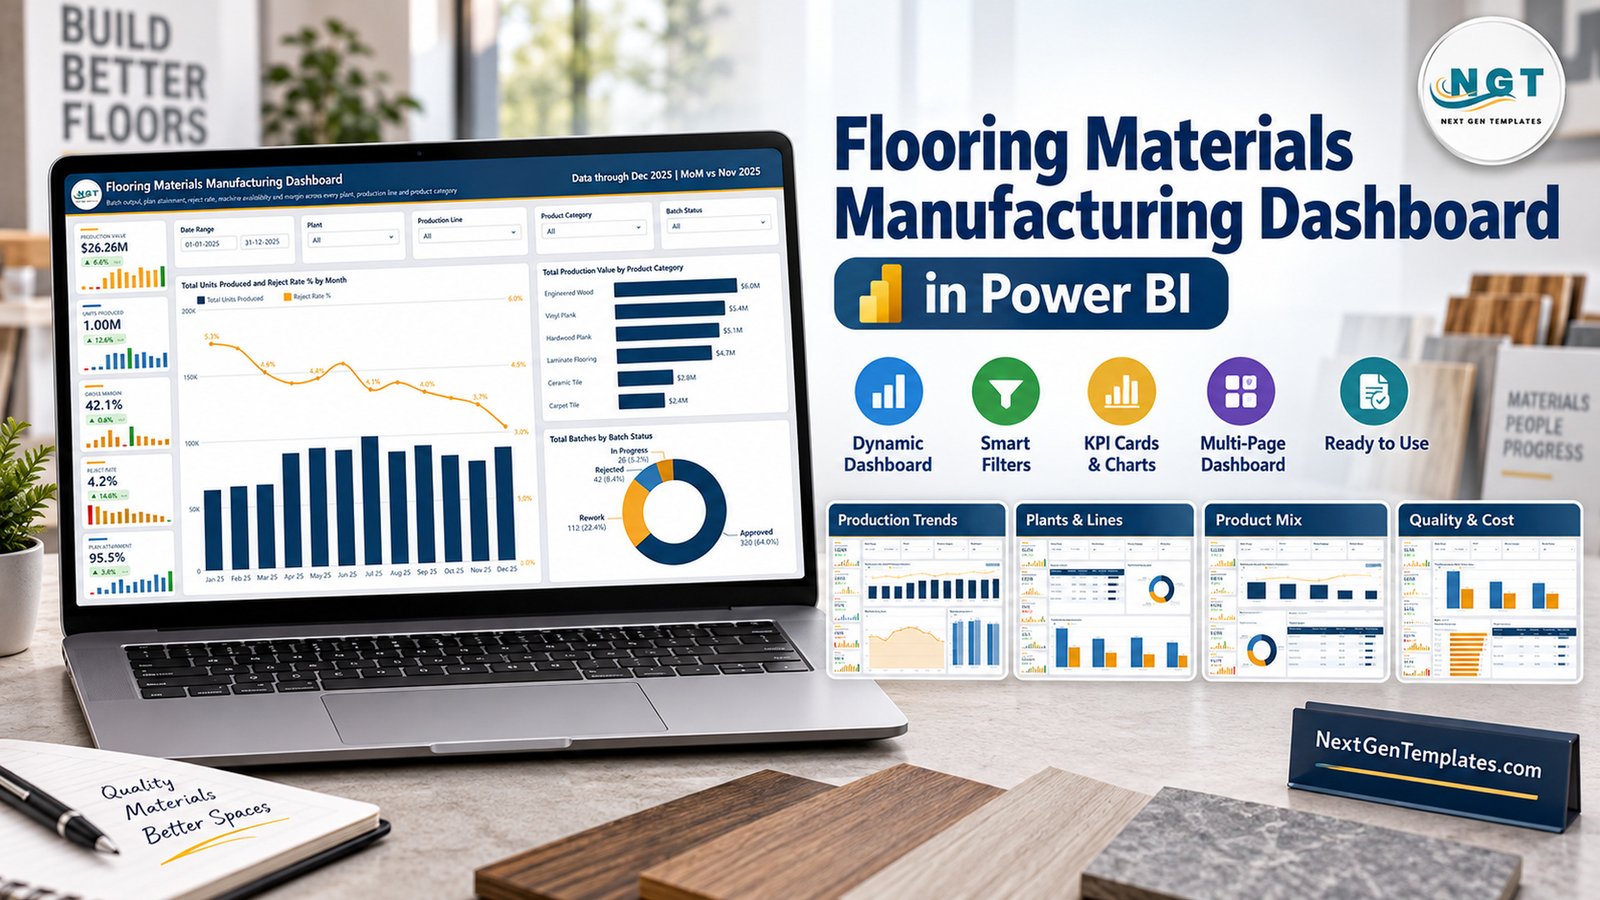
The Flooring Materials Manufacturing Dashboard in Power BI reports 16 distinct manufacturing KPIs across five interactive report pages, built from 12 charts, 3 scorecard tables and 5 slicers per page. Its sample model covers a full 2025 calendar year: 500 production batches, 1.00M units produced against a 1.05M plan, $26.26M of production value and a 4.2% reject rate across 4 plants, 4 production lines and 6 flooring product categories.
Most flooring and tile plants already have the numbers. What they usually lack is a single place where batch output, plan attainment, machine availability, reject rate and gross margin sit side by side — so the Monday production meeting stops being four people reading four different spreadsheets. This report is that layer, and it opens in the free Power BI Desktop rather than behind a per-seat analytics licence.
Key Features of the Flooring Materials Manufacturing Dashboard in Power BI
- 16 KPIs across 25 card slots. Production Value, Units Produced, Planned Units, Plan Attainment, Gross Margin, Reject Rate, Batch Approval Rate, Quality Score, Machine Availability, Downtime Hours, Units per Machine Hr, Batches Run, Value per Unit, Cost per Unit, Production Cost and Raw Material Cost — every card carrying a month-on-month delta and a 12-month sparkline.
- Five slicers on every page. Date Range, Plant, Production Line and Product Category repeat throughout; each page adds one contextual slicer — Batch Status, Shift, Supervisor or Material Grade.
- Four plants and four named lines. Riverton, Lakeside, Brookfield and Northgate, split across Line A – Pressing, Line B – Coating, Line C – Extrusion and Line D – Finishing.
- Six product categories and three material grades. Engineered Wood, Vinyl Plank, Hardwood Plank, Laminate Flooring, Ceramic Tile and Carpet Tile, each graded Standard, Premium or Commercial.
- Three scorecard tables. Production Line, Product Category and Plant Quality scorecards, each with an in-row data bar so the weakest performer is visible at a glance.
- An open model. The .pbix ships with its measures intact alongside a sample
Data.xlsx, so plants, lines, categories and grades can be renamed or extended without rebuilding a visual.
Dashboard Pages Explanation
Page 1: Flooring Materials Manufacturing Dashboard (Overview)
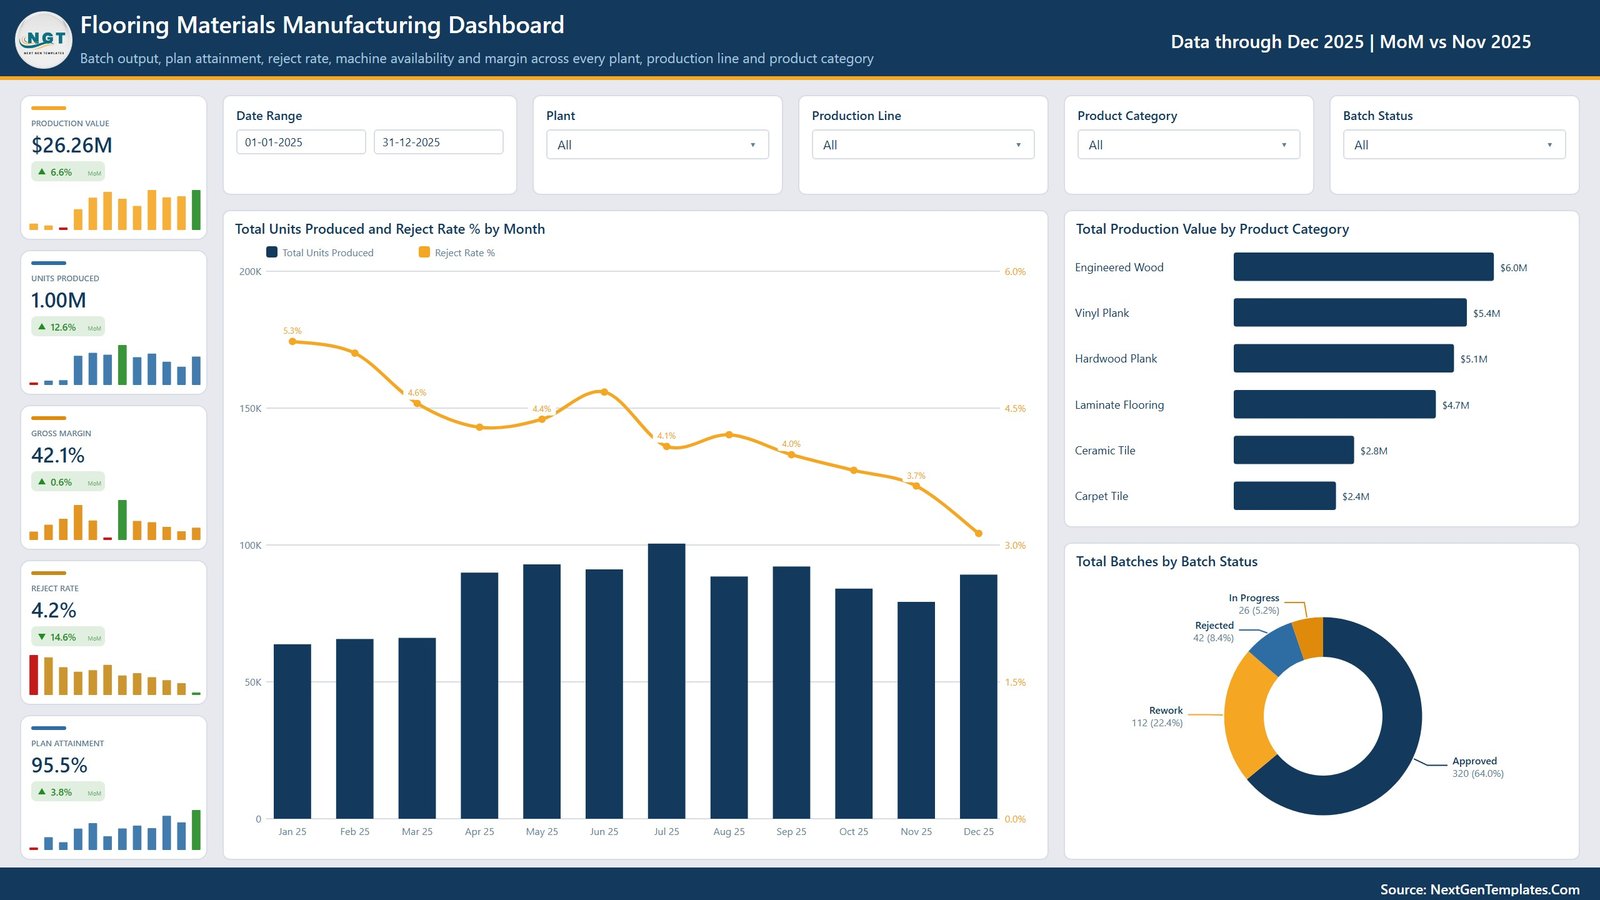
The landing page reports Production Value ($26.26M), Units Produced (1.00M), Gross Margin (42.1%), Reject Rate (4.2%) and Plan Attainment (95.5%), each measured month-on-month against November 2025. Its charts are Total Units Produced and Reject Rate % by Month, Total Production Value by Product Category, and Total Batches by Batch Status, which splits the 500 sample batches into 320 Approved, 112 Rework, 42 Rejected and 26 In Progress.
Page 2: Production Trends
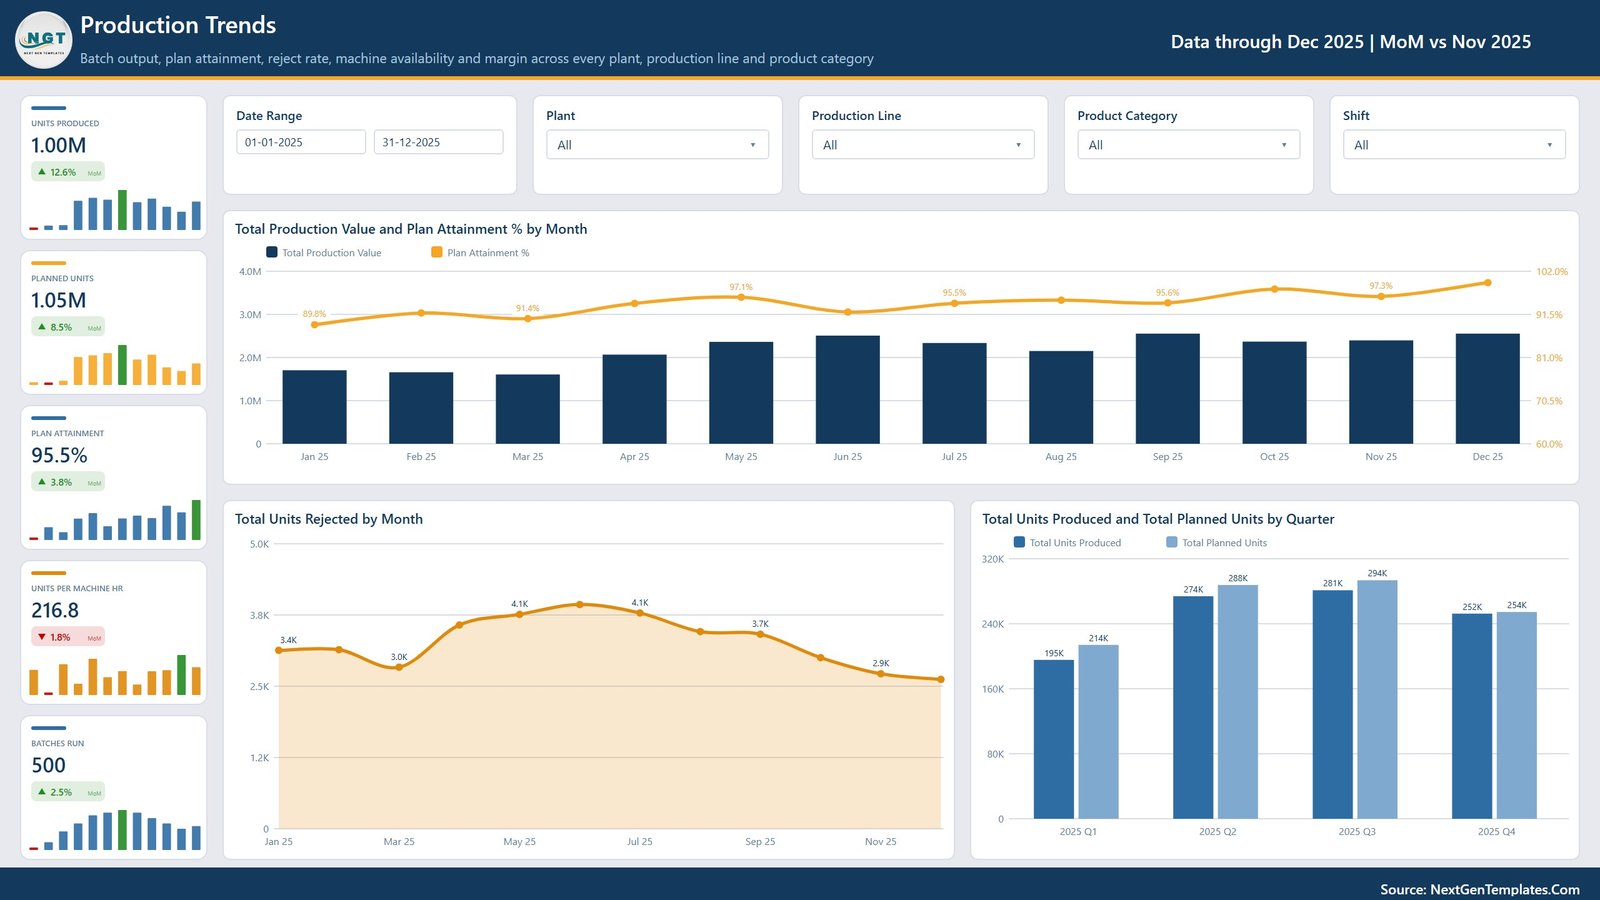
This page sets output against plan. It carries Units Produced, Planned Units (1.05M), Plan Attainment, Units per Machine Hr (216.8) and Batches Run (500), with a Shift slicer. Charts are Total Production Value and Plan Attainment % by Month, Total Units Rejected by Month, and Total Units Produced and Total Planned Units by Quarter — where the sample year opens at 195K against a 214K plan in Q1 and closes at 252K against 254K in Q4.
Page 3: Plants and Lines
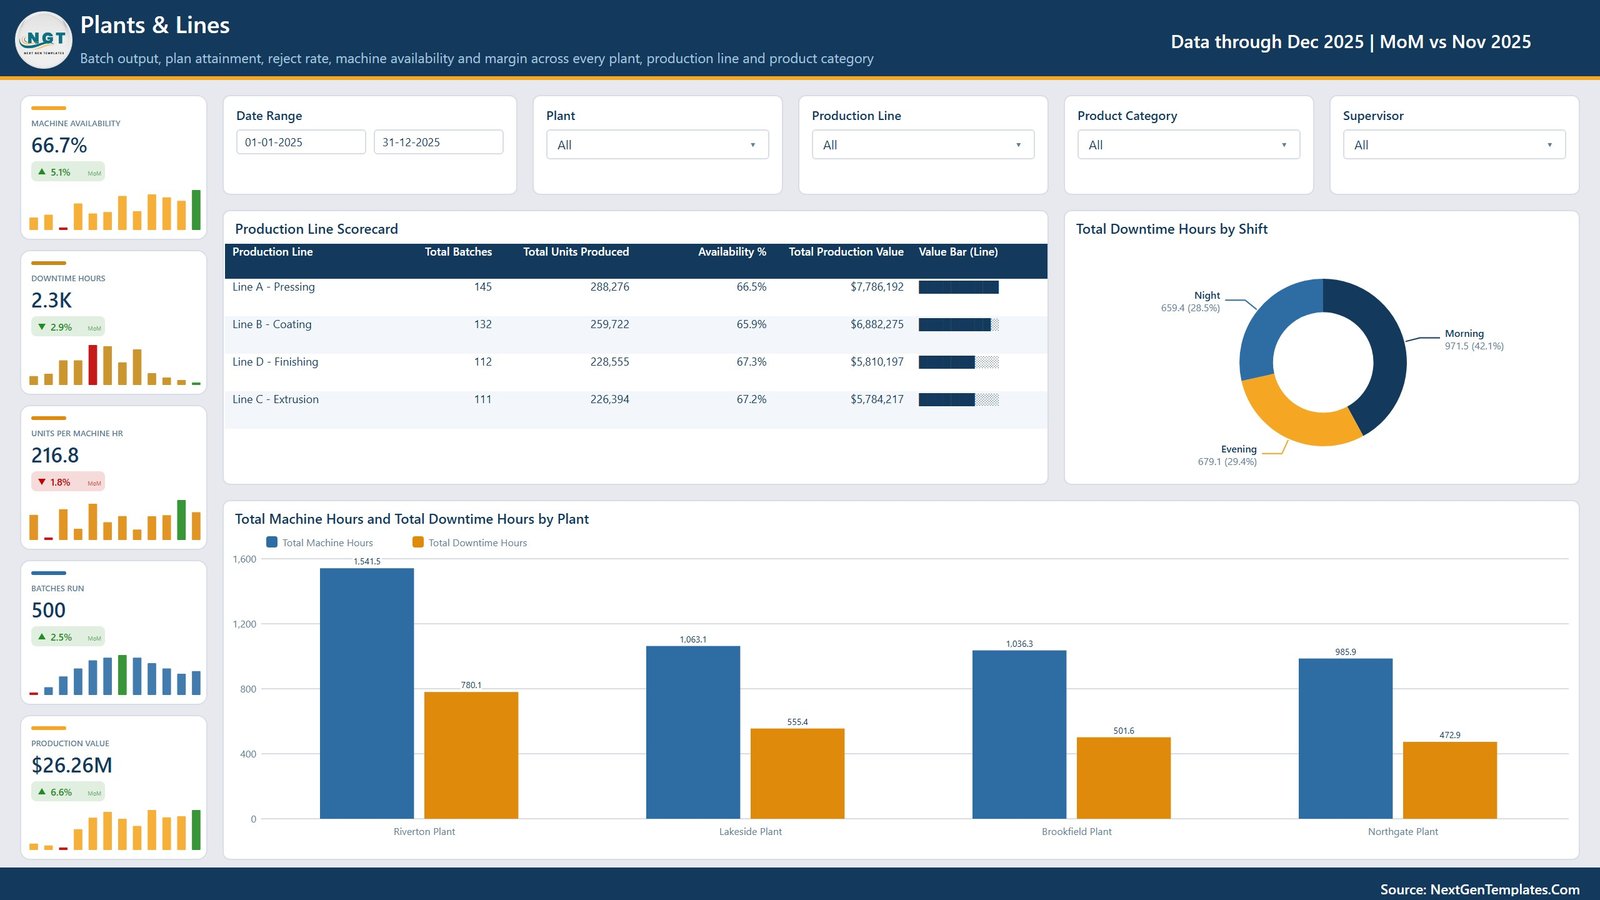
The asset page reports Machine Availability (66.7%), Downtime Hours (2.3K), Units per Machine Hr, Batches Run and Production Value, with a Supervisor slicer. It holds the Production Line Scorecard — batches, units, availability % and production value for all four lines — plus Total Downtime Hours by Shift and Total Machine Hours and Total Downtime Hours by Plant, where Riverton carries 1,541.5 machine hours against 780.1 hours of downtime.
Page 4: Product Mix
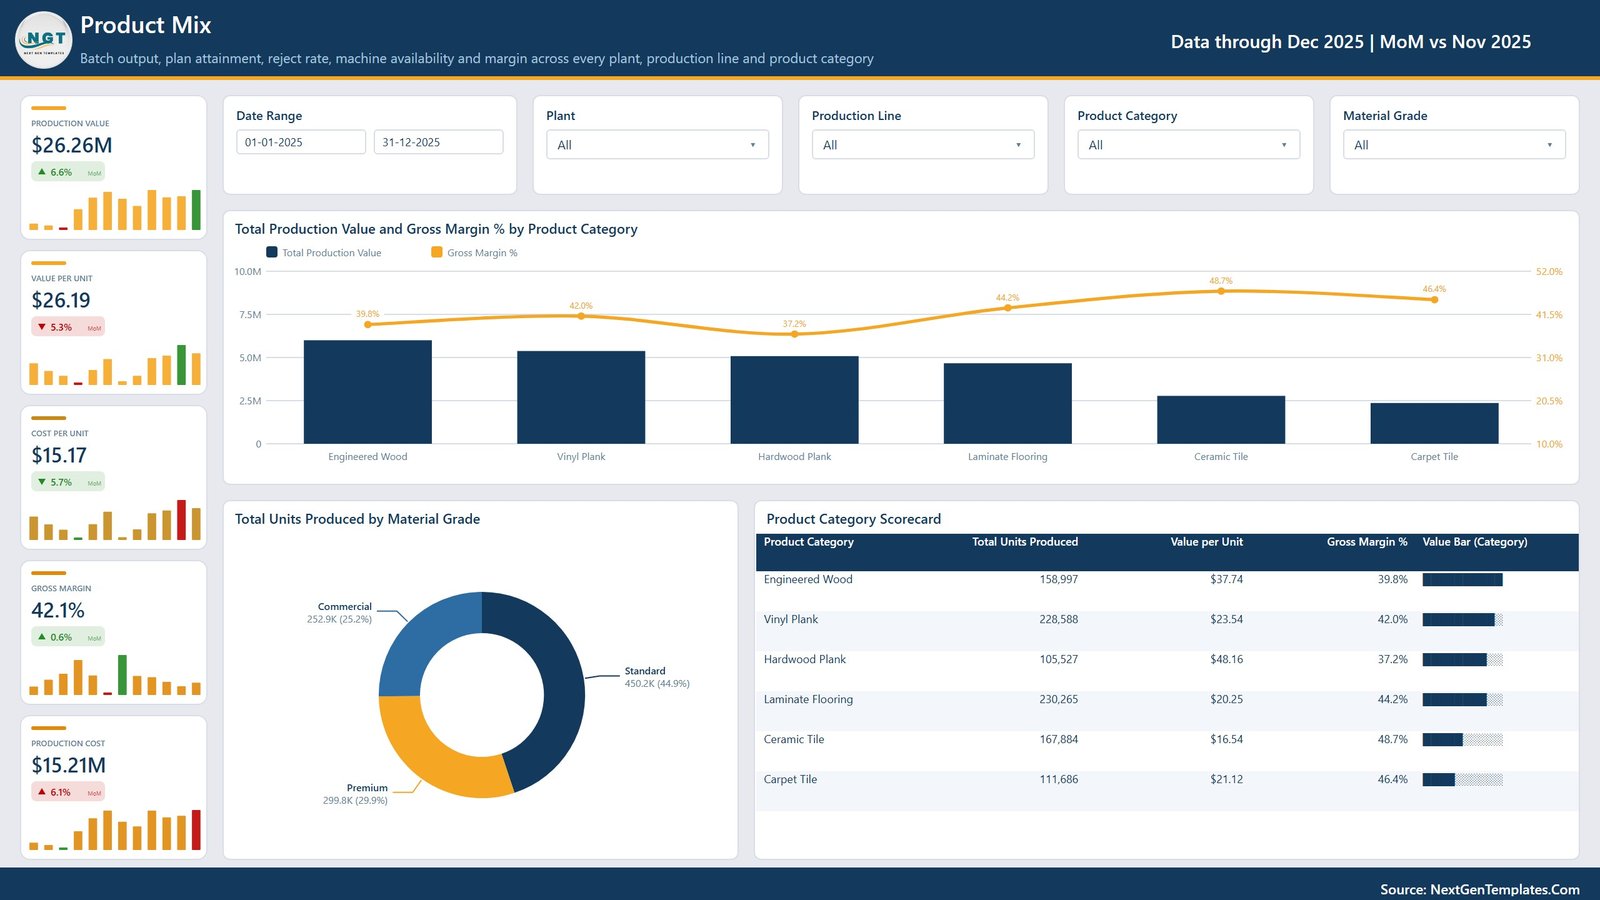
The margin page pairs Production Value with Value per Unit ($26.19), Cost per Unit ($15.17), Gross Margin and Production Cost ($15.21M), sliced by Material Grade. Charts are Total Production Value and Gross Margin % by Product Category, Total Units Produced by Material Grade, and a Product Category Scorecard — where Ceramic Tile returns the best margin at 48.7% while Hardwood Plank sits lowest at 37.2% despite carrying the highest value per unit at $48.16.
Page 5: Quality and Cost
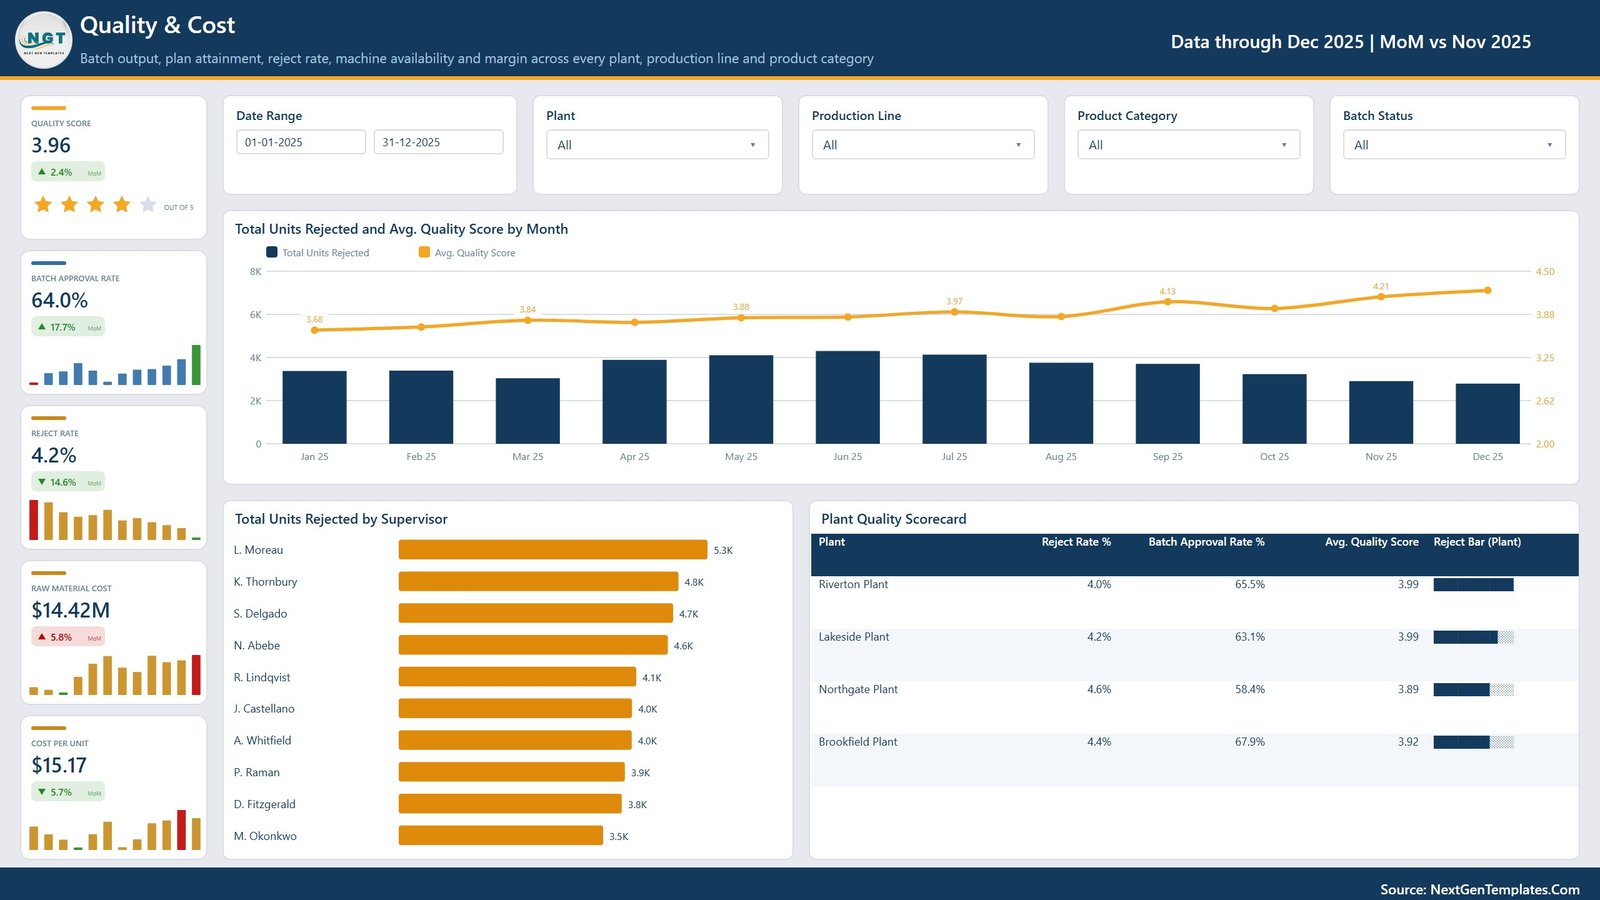
The quality page reports an Avg. Quality Score of 3.96 out of 5 on a star card, Batch Approval Rate (64.0%), Reject Rate, Raw Material Cost ($14.42M) and Cost per Unit. Charts are Total Units Rejected and Avg. Quality Score by Month, Total Units Rejected by Supervisor across ten named supervisors, and a Plant Quality Scorecard that puts Northgate at both the worst reject rate (4.6%) and the lowest batch approval rate (58.4%).
Flooring Materials Manufacturing Dashboard in Power BI vs. Tableau / Qlik vs. Paid MES Analytics — Feature Comparison
| Feature | This Power BI Template | Tableau / Qlik Sense | Paid MES Analytics (Tulip, Sight Machine) |
|---|---|---|---|
| Cost | $17.99 one-time ✅ | $70-115 / user / month | $1,000-10,000+ / site / month |
| Platform | Power BI Desktop, free ✅ | Paid desktop plus server licence | Vendor cloud, annual contract |
| Setup time | Under 15 minutes ✅ | Days to build from scratch | Weeks of implementation |
| Report pages included | 5 pages, 15 visuals, ready built ✅ | Blank canvas | Vendor templates, locked |
| Editable measures and visuals | Fully open ✅ | Open, but you build it | Vendor controlled |
| Per-user fees as the team grows | None ✅ | Per named user | Per seat plus per machine |
| Live shop-floor data capture | No — you supply the export | No — connector only | Yes ✅ |
| Mobile viewing | Power BI mobile app, with a Pro workspace | Vendor mobile app | Vendor mobile app |
| Year-1 cost at 5 users | $17.99 ✅ | $4,200-6,900 | $12,000-120,000 |
For a flooring plant that wants plant, line and margin reporting this week without signing an MES contract, this template sits in the sweet spot — buy the reporting layer and keep the data capture you already have.
Who Should Use This Template
Perfect for:
- Production and plant managers at flooring, tile and building-materials manufacturers running 1-10 sites
- Operations analysts who already export batch data to Excel or CSV and want a reporting layer over it
- Quality managers tracking reject rate, batch approval and quality score by plant and by supervisor
- Power BI learners looking for a finished, realistic manufacturing model to take apart
Not a fit if:
- You need live machine telemetry, OEE from PLC tags or real-time andon — this file reports on data you give it
- You need a regulated quality-management system of record for ISO or CE batch release
- You work Mac-only or browser-only — authoring needs Power BI Desktop, which is Windows-only
- You would rather have a workbook, in which case the Excel edition of this flooring dashboard is the better fit
Real-World Use Cases
Marcus, plant manager at a four-site laminate and vinyl manufacturer. He opens the Plants and Lines page before the Monday production meeting, reads the Production Line Scorecard to see which line lost availability, and drops the Total Machine Hours and Total Downtime Hours by Plant chart straight into his deck — replacing two hours of spreadsheet rebuilding every week.
Priya, quality lead at a ceramic and carpet tile producer. She filters the Quality and Cost page to one plant and one supervisor, watches Reject Rate against Avg. Quality Score month by month, and uses the Plant Quality Scorecard to decide where the next round of operator training goes.
Daniel, commercial analyst at a hardwood and engineered-wood group. He works from the Product Mix page, comparing Value per Unit against Gross Margin % across six categories, and used it to show his board that Ceramic Tile delivers the strongest margin at 48.7% even though Hardwood Plank carries the highest price per unit.
Advantages of This Power BI Manufacturing Dashboard
- No licence wall. The report opens, filters and refreshes in Power BI Desktop, which Microsoft provides free. A Pro licence only matters if you publish to a shared workspace.
- Cost predictability. One payment replaces a per-seat analytics subscription that would otherwise scale with every supervisor you add to the distribution list.
- Speed to first report. Because the pages, measures and slicers already exist, the work is mapping your export to the supplied columns rather than designing a report from a blank canvas.
- Consistency across sites. Every plant is measured with the same definition of availability, reject rate and plan attainment, which removes the usual argument about whose spreadsheet is right.
- A model worth studying. The DAX measures are readable and editable, so it doubles as a teaching file for an analyst learning the tool.
Opportunities for Improvement
Worth being straight about the limits. The file ships with fictional sample data and connects to no MES, ERP or SCADA system out of the box — it reads a flat data file, so any live integration is work you do. It is a reporting and analysis tool, not a production-control or quality-management system of record, and nothing in it releases a batch or holds a lot.
Machine availability here is derived from the machine-hour and downtime-hour columns you supply rather than calculated from equipment signals, so it is only as good as the downtime logging behind it. There is no built-in OEE tile combining availability, performance and quality into one figure, and the quality score is a supplied rating rather than a computed index. Plants with mature shop-floor telemetry will likely want to extend the model rather than use it as delivered.
Best Practices
- Keep the column headers in
Data.xlsxexactly as supplied when you paste in your own export — the measures reference them by name. - Load a full 12 months before judging a trend; the sparklines and month-on-month deltas are designed for a complete year.
- Agree one definition of downtime across plants before the first refresh, or the availability comparison on page 3 will mislead.
- Rename plants, lines, categories and grades in the data rather than in the visuals, so nothing needs rebuilding later.
- Publish to a workspace and schedule a refresh if more than two or three people need the numbers weekly.
Explore Relevant Templates
- Flooring Materials Manufacturing Dashboard in Excel — the same flooring-plant subject built as a workbook rather than a .pbix.
- Digital Twins in Manufacturing Dashboard in Power BI — for plants moving past batch reporting into asset simulation.
- Glass Installation KPI Dashboard in Power BI — a neighbouring building-materials report aimed at installation teams.
- Ceramic Tiles Production Dashboard in Excel — a closely related production report for tile manufacturers.
Frequently Asked Questions
What KPIs does this flooring manufacturing dashboard track?
It reports 16 distinct KPIs across 25 card slots: Production Value, Units Produced, Planned Units, Plan Attainment, Gross Margin, Reject Rate, Batch Approval Rate, Quality Score, Machine Availability, Downtime Hours, Units per Machine Hr, Batches Run, Value per Unit, Cost per Unit, Production Cost and Raw Material Cost, each with a month-on-month delta.
Do I need a paid Power BI licence?
No. The Flooring Materials Manufacturing Dashboard in Power BI opens and refreshes in Power BI Desktop, which Microsoft gives away free. A Power BI Pro licence is only required to publish the report to a shared workspace or to view it in the mobile app.
How long does setup take?
Under 15 minutes. The .pbix opens with sample data already loaded so all five pages render immediately. Using your own numbers means pasting your batch export into the supplied Data.xlsx, repointing the query in Transform data, and pressing Refresh.
Does it connect to an MES or ERP system?
Not out of the box. It reads a flat data file rather than a live system, and it ships with fictional sample data. If your MES or ERP exports batch, machine-hour and cost data to Excel or CSV, you can map those columns and refresh — but no connector is included.
How does it compare with a paid MES analytics platform?
Platforms such as Tulip or Sight Machine capture live machine data and charge thousands per site per month. This template captures nothing; it reports on data you already collect, for one payment. That suits plants whose data-capture problem is solved and whose reporting problem is not.
Can I add another plant, line or product category?
Yes. Plants, production lines, product categories, material grades, shifts and supervisors are all data values rather than hard-coded visuals, so a fifth plant or a seventh category is a matter of adding rows to Data.xlsx and refreshing.
About the Author
Built by PK — Microsoft Certified Professional with 15+ years of Excel, Google Sheets and Power BI experience. Founder of NextGenTemplates, reaching 300K+ subscribers across YouTube channels. Every template is hand-built and tested before release.
Conclusion
If your flooring or tile plant already collects batch, machine-hour and cost data but nobody can see it in one place, the Flooring Materials Manufacturing Dashboard in Power BI turns that export into five pages of reporting in an afternoon — without a per-seat analytics contract and without pretending to be the MES you may or may not need later.
👉 Click here to Purchase the Flooring Materials Manufacturing Dashboard
Instant download · One-time payment · No subscription
🎥 For step-by-step video tutorials, visit Youtube.com/@PKAnExcelExpert
Last updated: September 2026