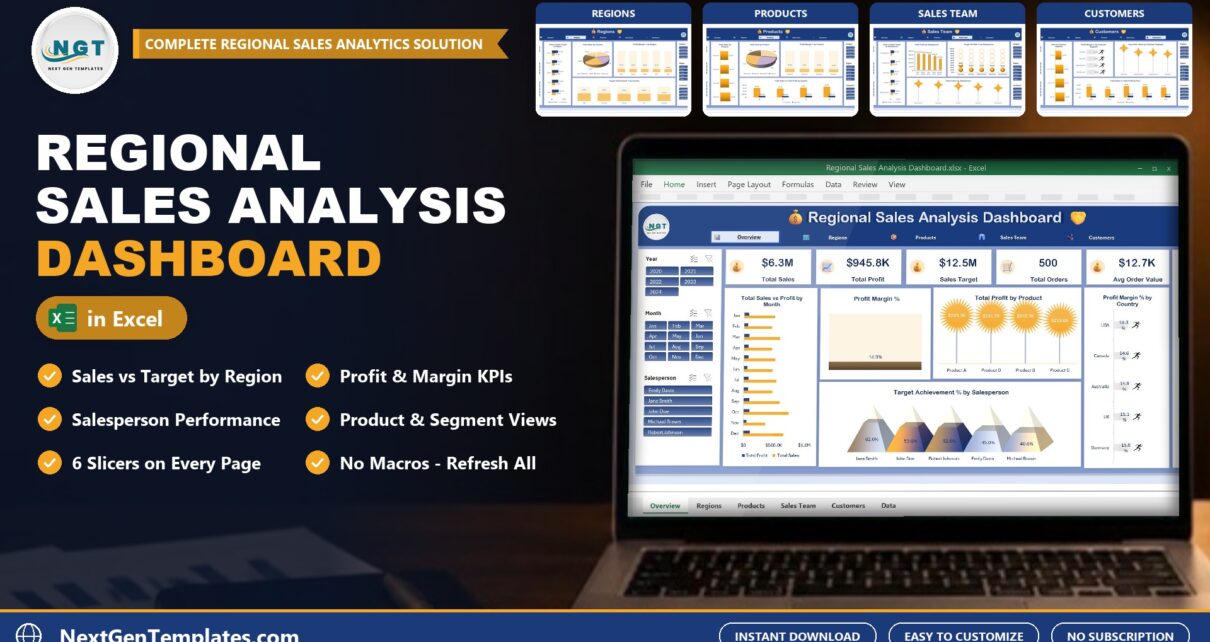
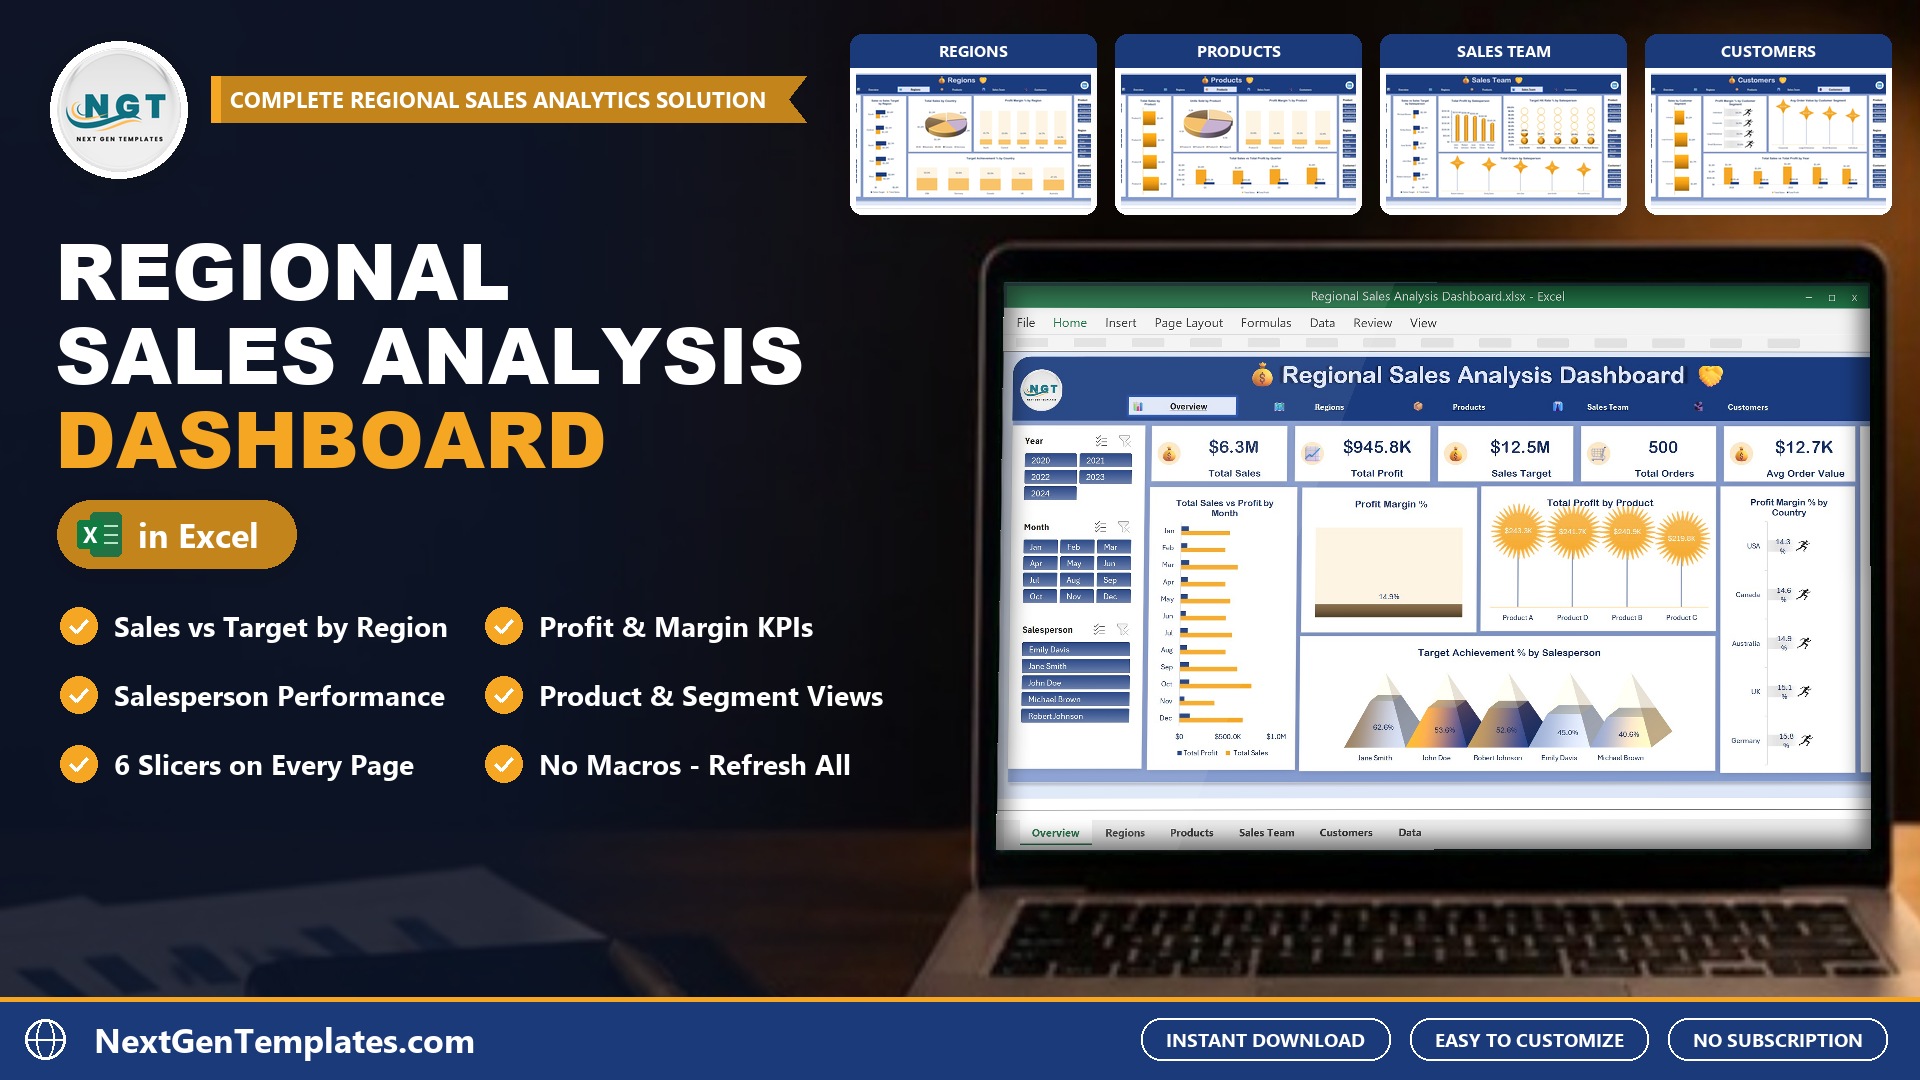
Sales numbers are easy to collect and hard to read. The Regional Sales Analysis Dashboard in Excel takes a plain list of sales records and shows which regions, products and salespeople are hitting their targets, how much profit each one makes and where the gaps are. It runs in Excel alone, with no Power BI and no macros.
What Is a Regional Sales Analysis Dashboard?
A regional sales analysis dashboard compares sales, profit and targets across regions, countries, products, salespeople and customer segments on one screen. This one is an Excel workbook built on pivot tables, charts and slicers. You add your sales rows on the Data sheet, click Refresh All, and the Overview, Regions, Products, Sales Team and Customers pages update.
Inside the Dashboard
Overview Page
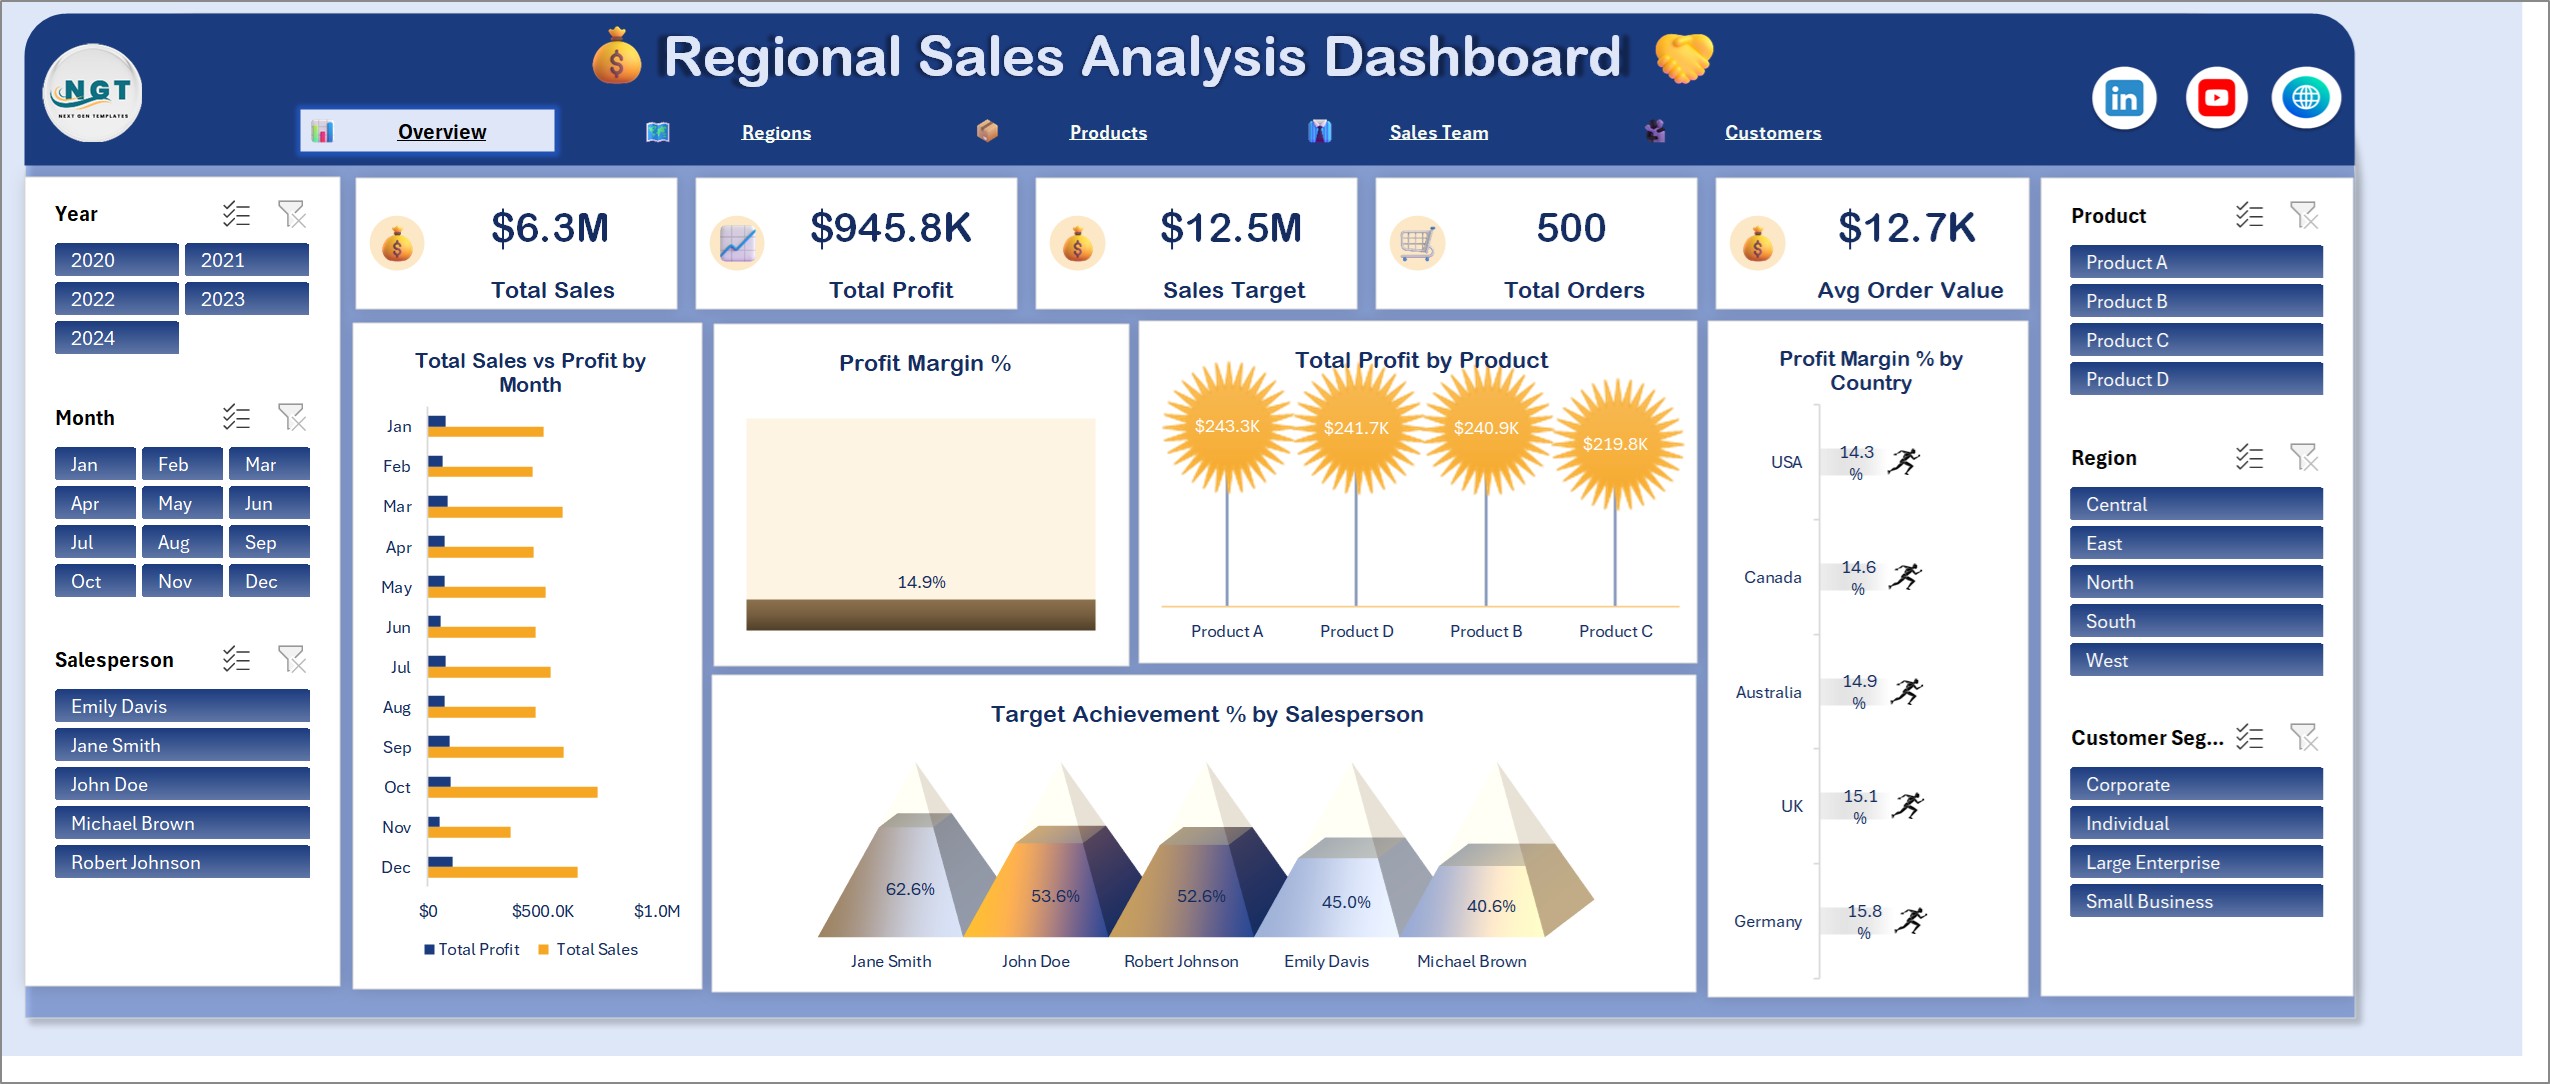
Five KPI cards for Total Sales, Total Profit, Sales Target, Total Orders and Avg Order Value sit across the top. Below them are total sales vs profit by month, overall profit margin %, total profit by product, profit margin % by country and target achievement % by salesperson.
Regions Page
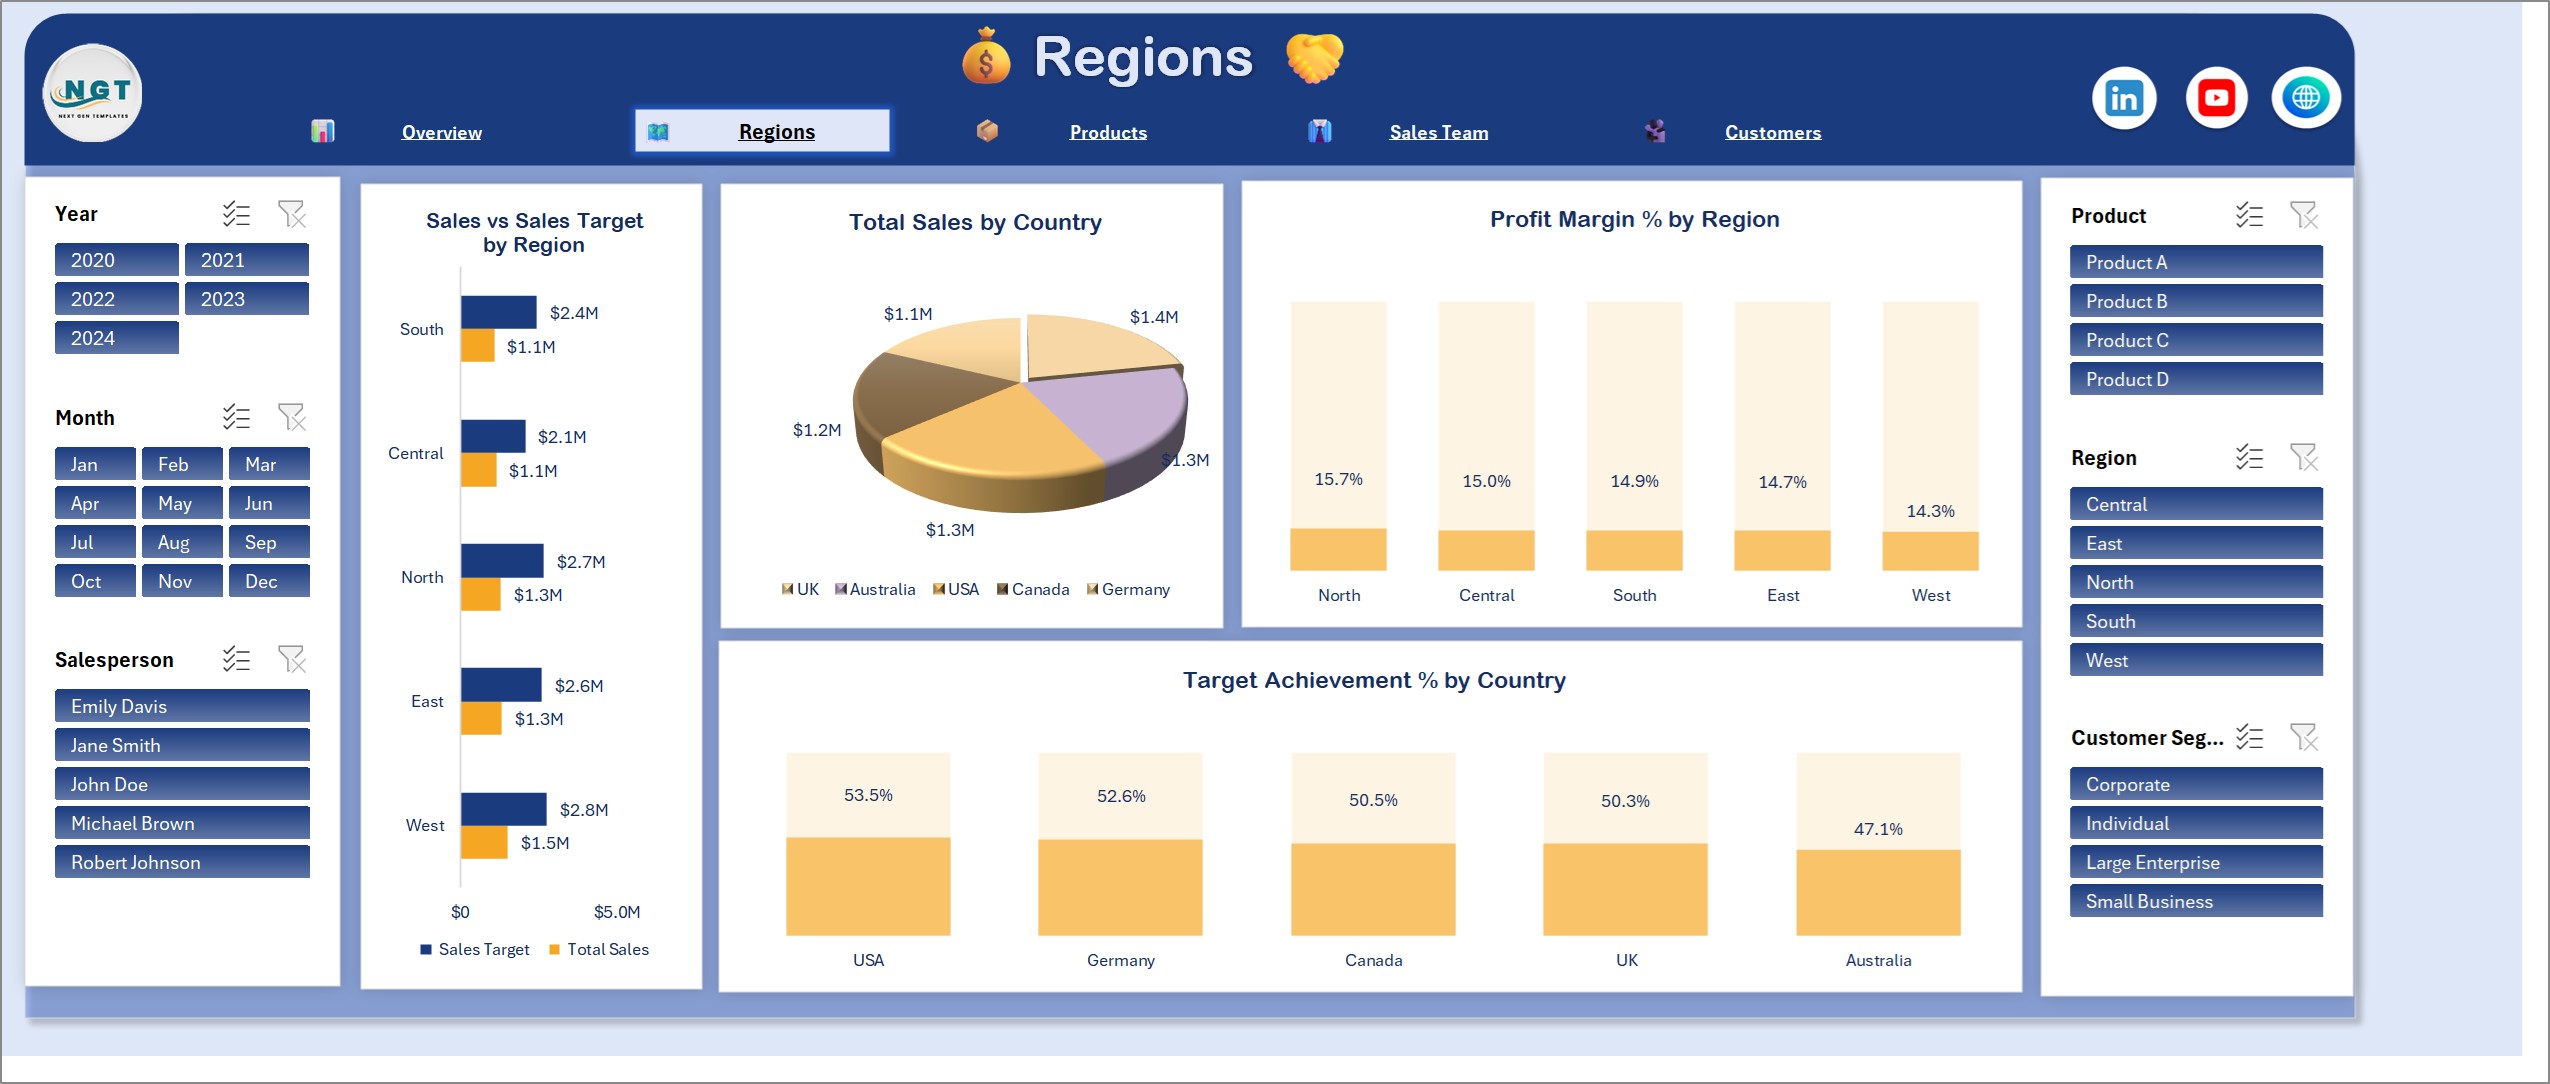
Sales vs sales target by region, total sales by country, profit margin % by region and target achievement % by country.
Products Page
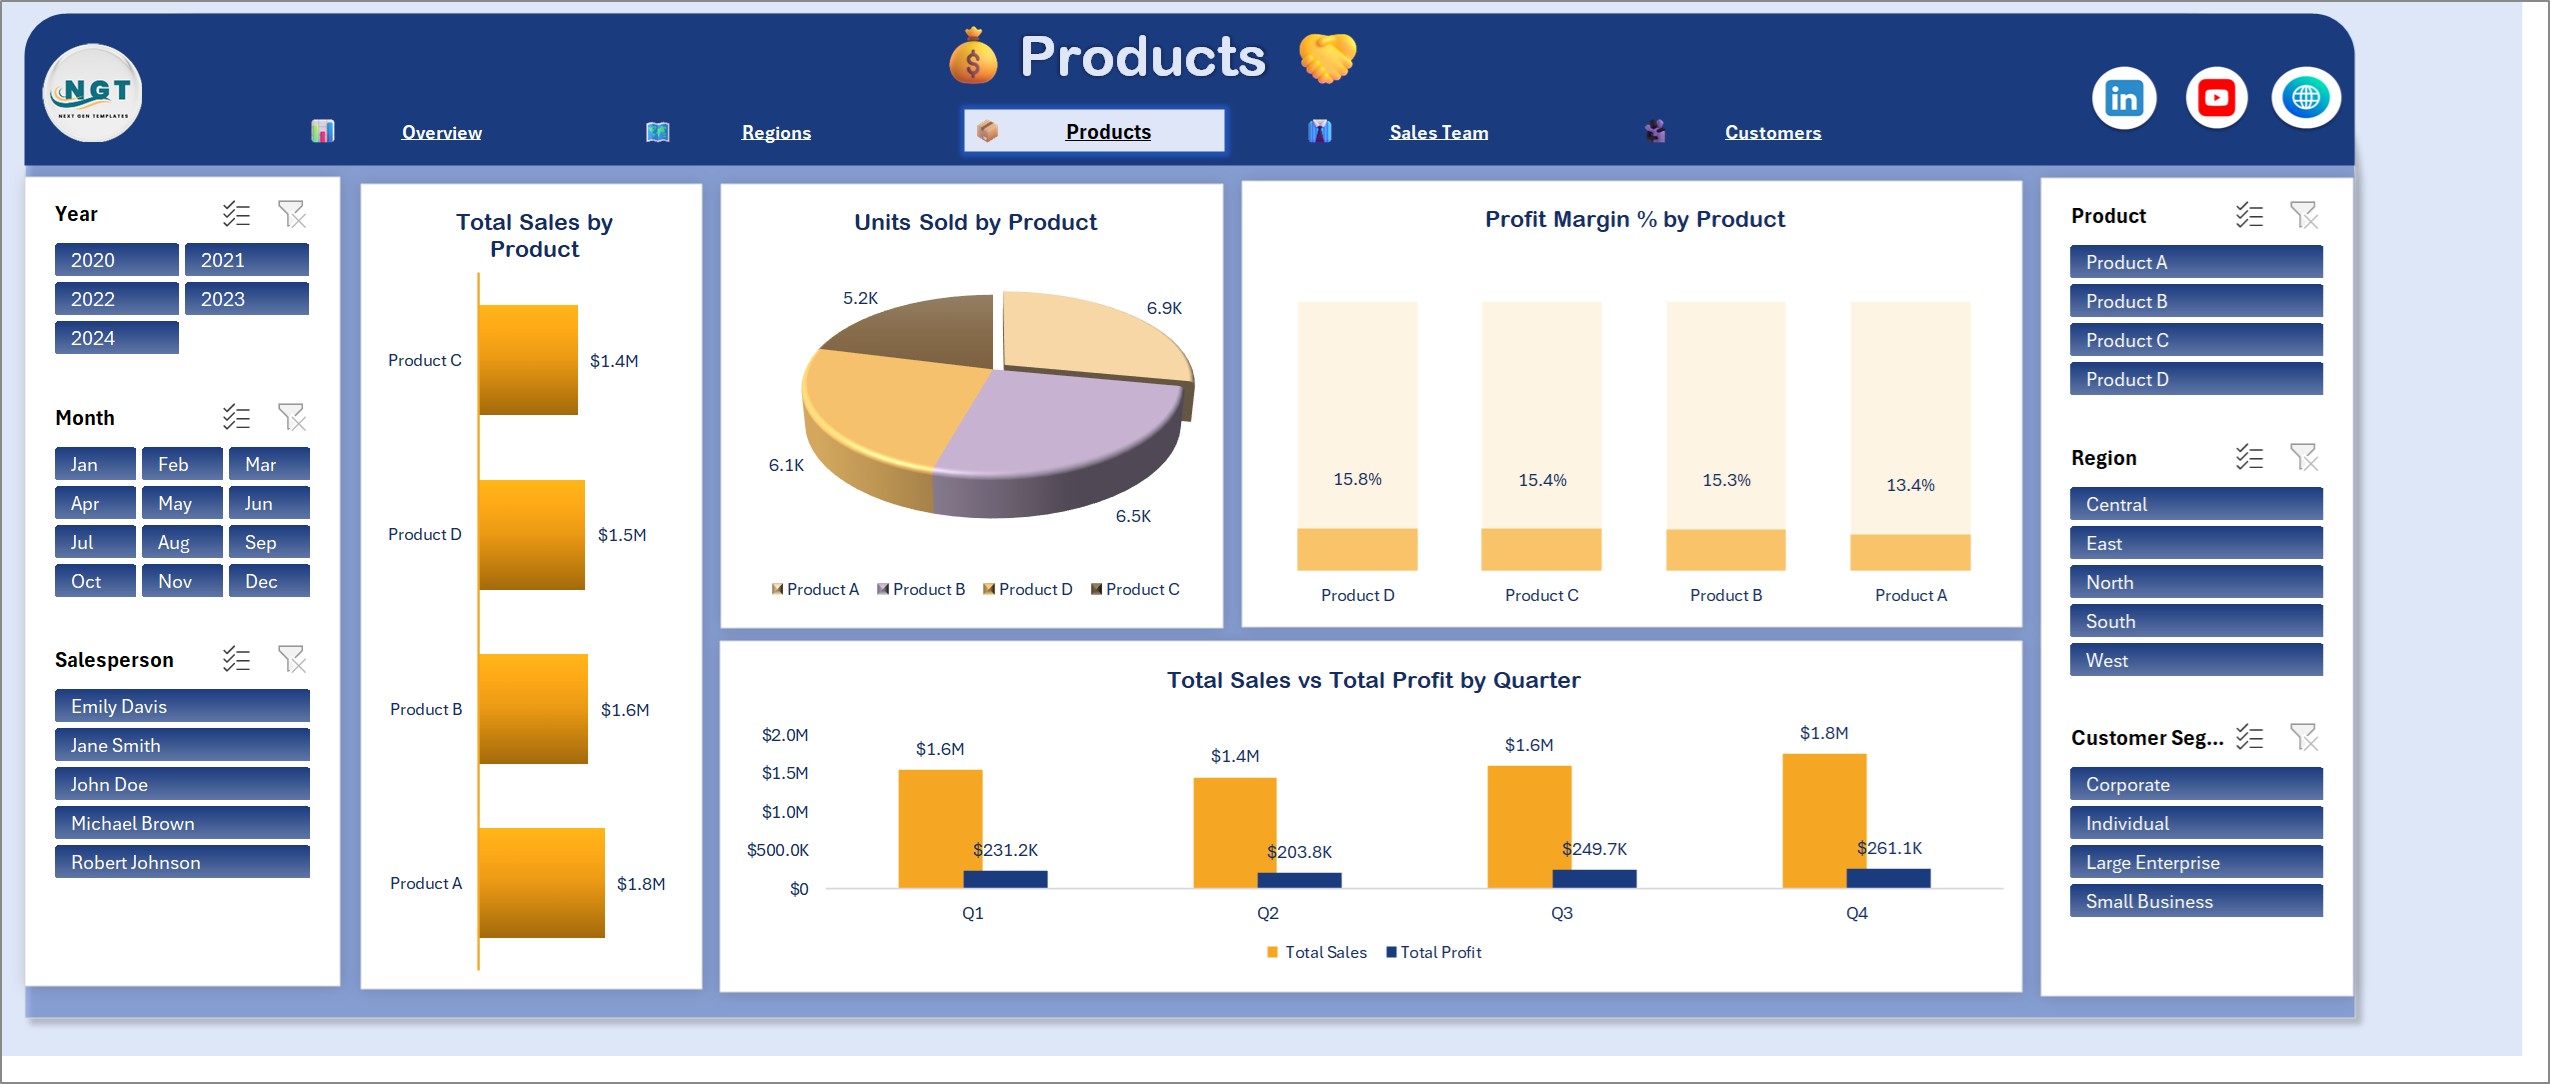
Total sales by product, units sold by product, profit margin % by product and total sales vs total profit by quarter.
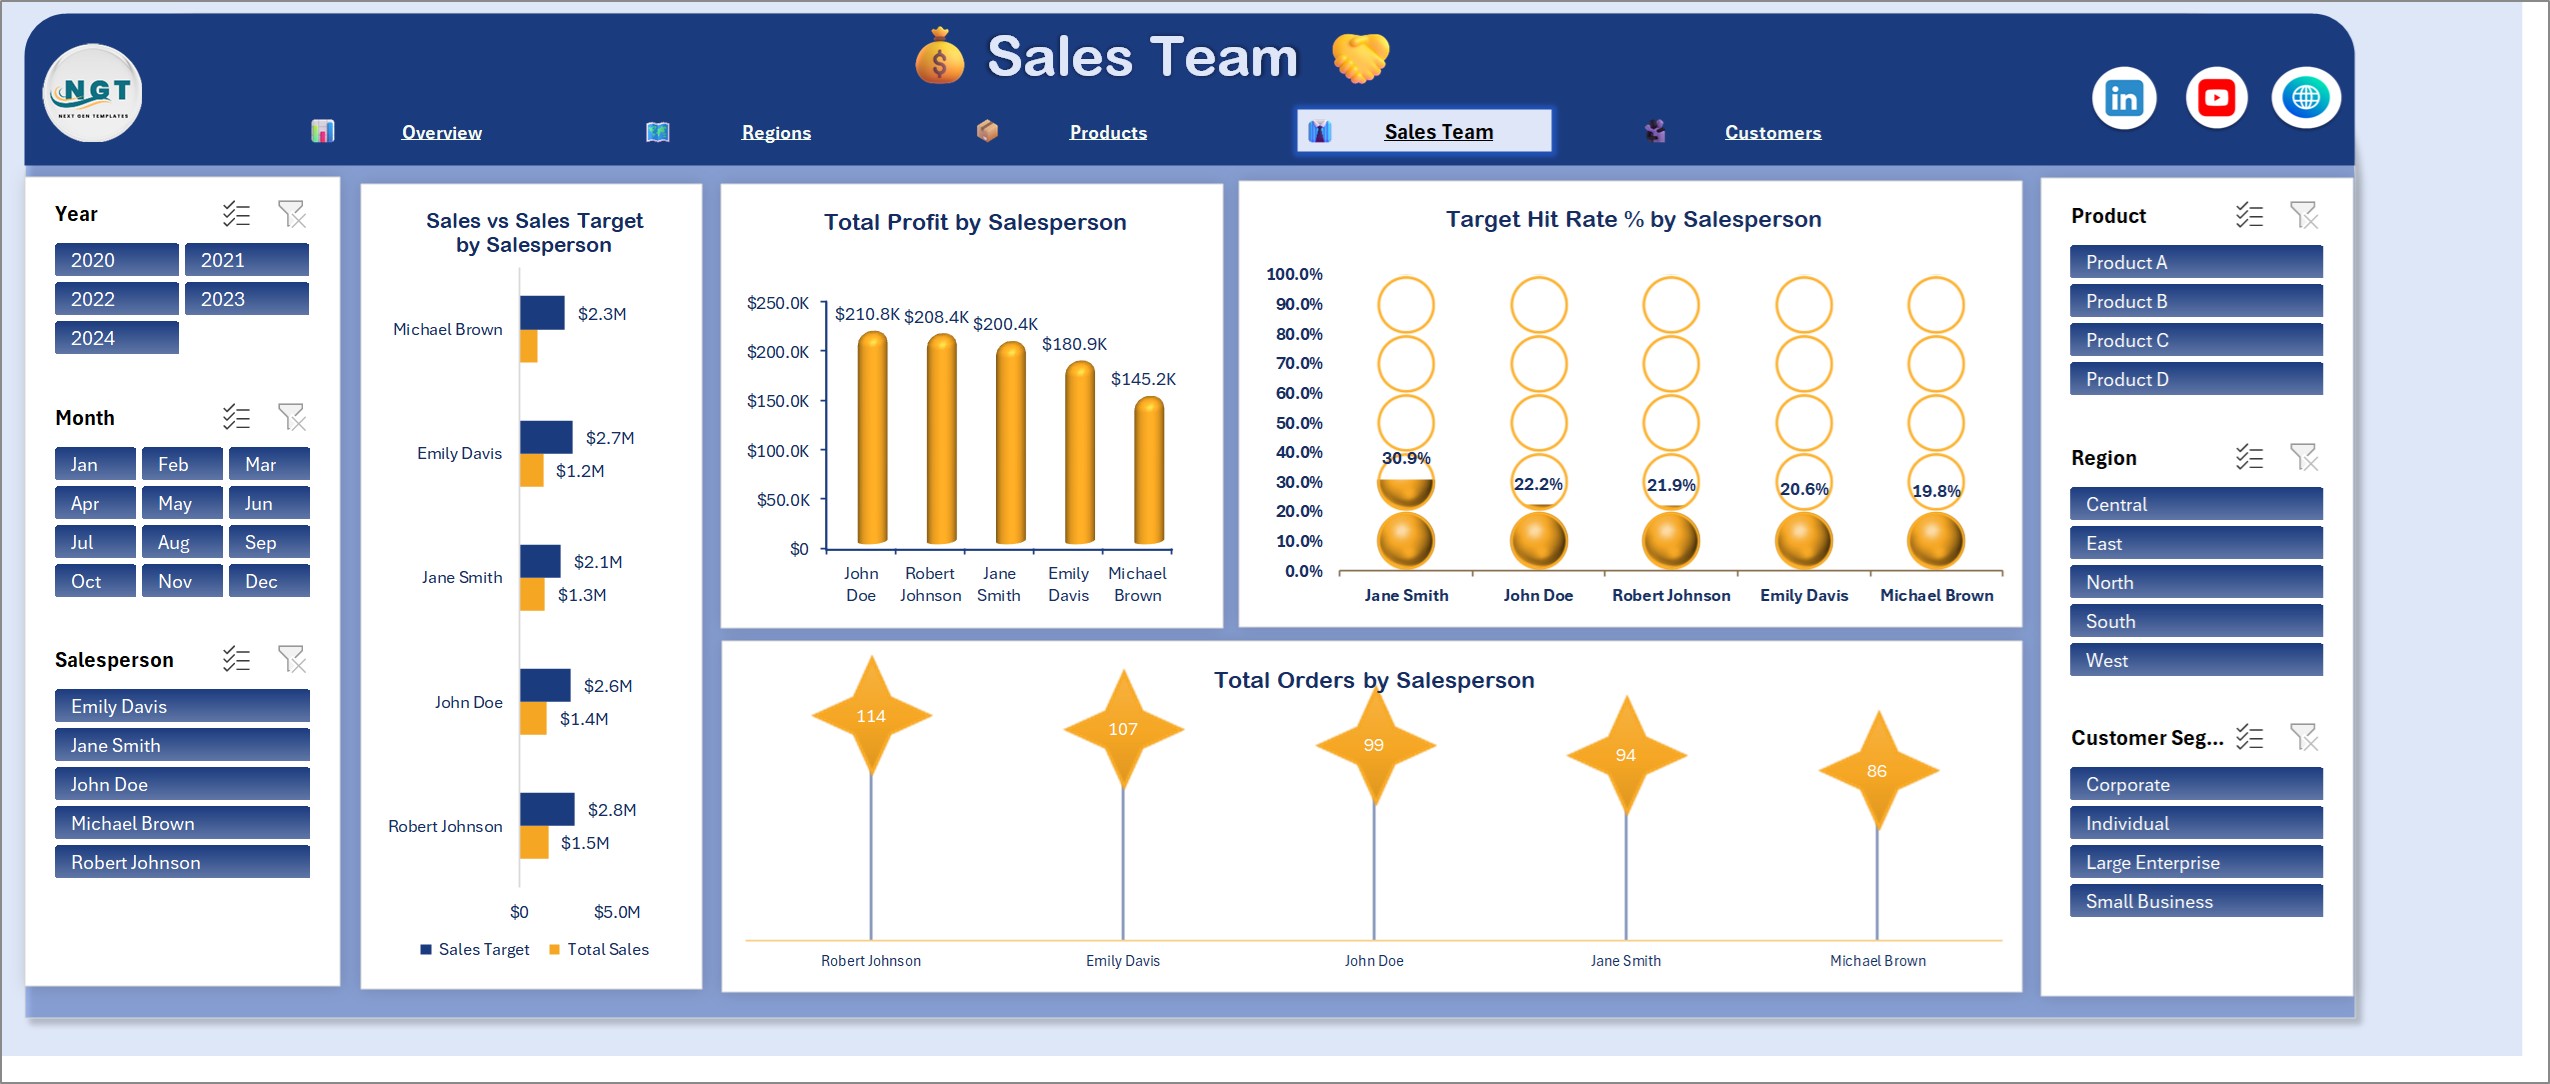
Sales Team Page
Sales vs sales target by salesperson, total profit by salesperson, target hit rate % by salesperson and total orders by salesperson.
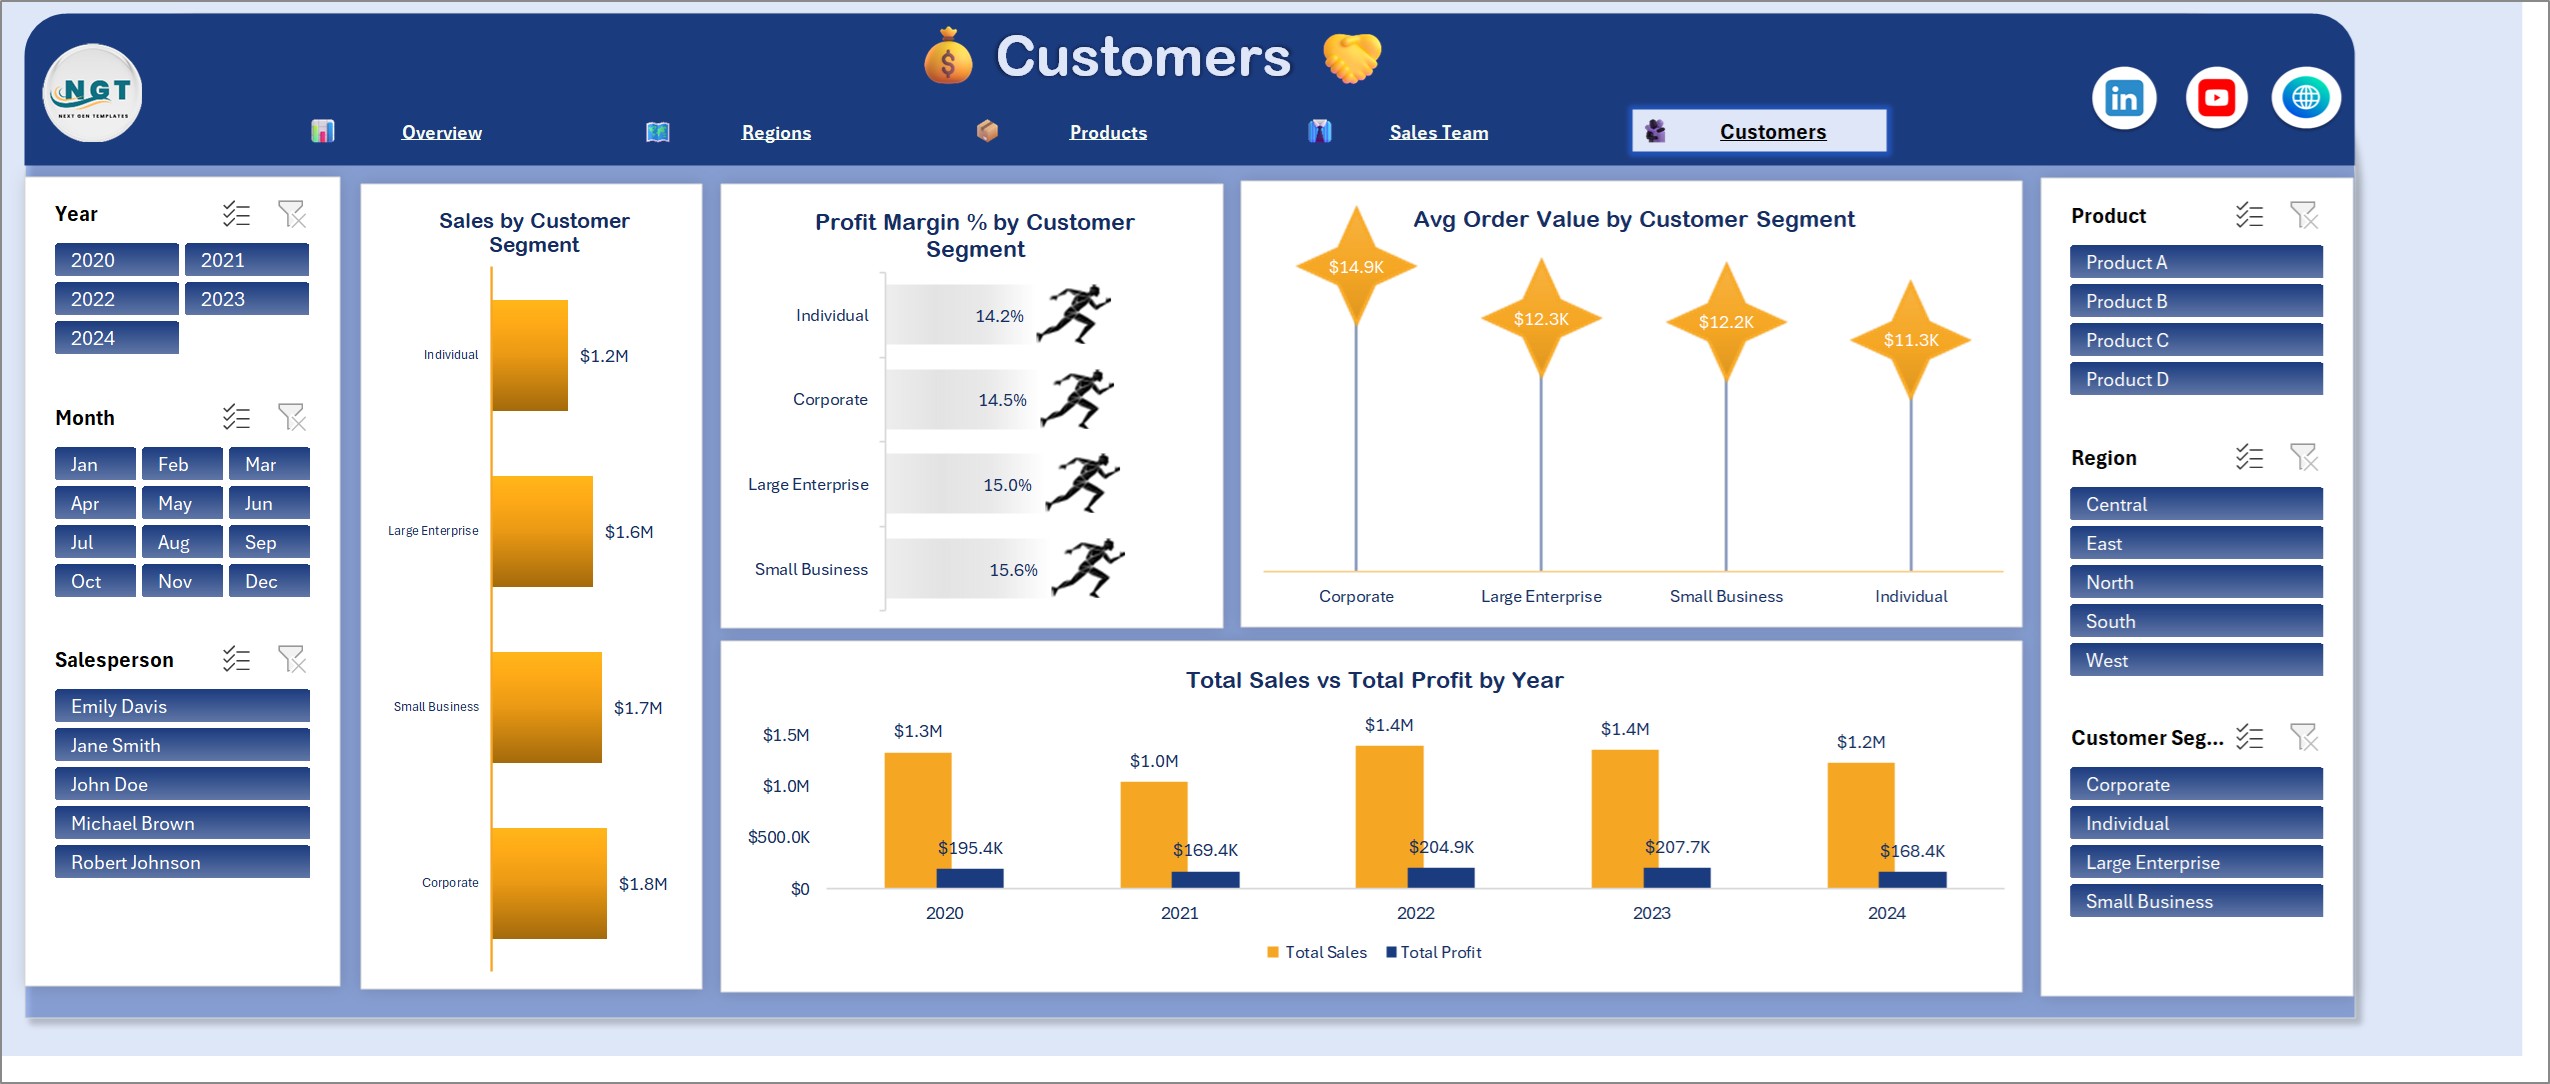
Customers Page
Sales by customer segment, profit margin % by customer segment, avg order value by customer segment and total sales vs total profit by year.
How It Works
The Data sheet holds one row per sale: region, salesperson, product, sale date, quantity sold, unit price, sales target, profit, customer segment and country. Formula columns work out total sales, target variance, whether the target was met, and the month, year and quarter. Every pivot table reads the whole data table, so new rows are picked up when you click Refresh All. Six slicers (Year, Month, Salesperson, Product, Region and Customer Segment) filter all five pages at once. If you want to learn how pivot tables and slicers are wired together like this, see the free E-commerce Sales Dashboard in Excel with PivotTables and Slicers tutorial.
Pros and Limits
- Sales, profit, targets and margins on one set of linked pages
- Works in plain Excel: no Power BI, no macros, no add-ins
- Slicers that filter every page together
- It is not a live connector to a CRM or ERP, so you add data and refresh yourself
- The 500 sample sales records are fictional
Who Should Use It
Sales managers can open the Sales Team page each week and see who is ahead of target and who needs support. Regional heads can use the Regions page to compare countries side by side. Business owners can read the Overview cards in a few seconds to see total sales against target and the profit margin behind it. It also suits teams that work in Excel and do not use Power BI.
How to Read Sales Against Target
Start with Target Achievement % on the Overview page. It is total sales divided by sales target for whatever is in view, so filter by region or salesperson to see who is pulling the number down. Then check Target Hit Rate % on the Sales Team page: it shows the share of individual orders that met their own target. A salesperson with a high achievement % but a low hit rate is relying on a few large deals; a high hit rate means steady performance. Finally, compare profit margin % by product and segment, because a sale that hits target at a thin margin may not be the sale you want more of.
Frequently Asked Questions
Do I need Power BI?
No. Everything runs in Microsoft Excel with pivot tables, charts and slicers. If your team does use Power BI, there is a separate Power BI version of this dashboard built on the same data.
Does it need macros or add-ins?
No. It uses formulas, pivot tables, charts and slicers only, so there is nothing to enable beyond opening the file.
Which Excel version do I need?
Desktop Excel for Windows, Excel 2016 or later, or Microsoft 365. The slicers and pivot tables do not work fully in Excel for the web.
Can I add more rows than the sample data?
Yes. Add rows at the bottom of the data table and click Refresh All. The pivot tables read the whole table, so nothing needs to be re-pointed.
Is the sample data real?
No. The 500 sales records on the Data sheet are fictional. Replace them with your own and refresh.
Get the Regional Sales Analysis Dashboard in Excel
Get the dashboard here: Regional Sales Analysis Dashboard in Excel. If your team works in Power BI, try the Regional Sales Analysis Dashboard in Power BI.