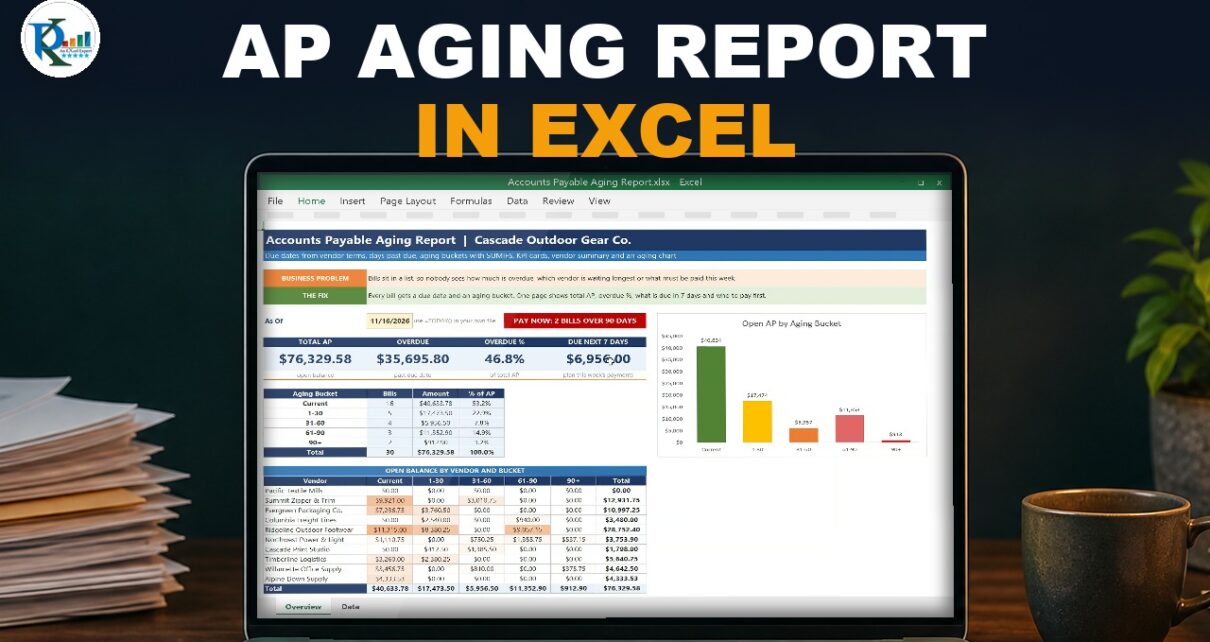
Short answer: an accounts payable aging report in Excel needs five things: a due date from the vendor terms, a balance, days past due, an aging bucket and a few SUMIFS summaries. This tutorial builds all of them step by step, so you can see on one page how much you owe, how much is overdue and which bills to pay first.
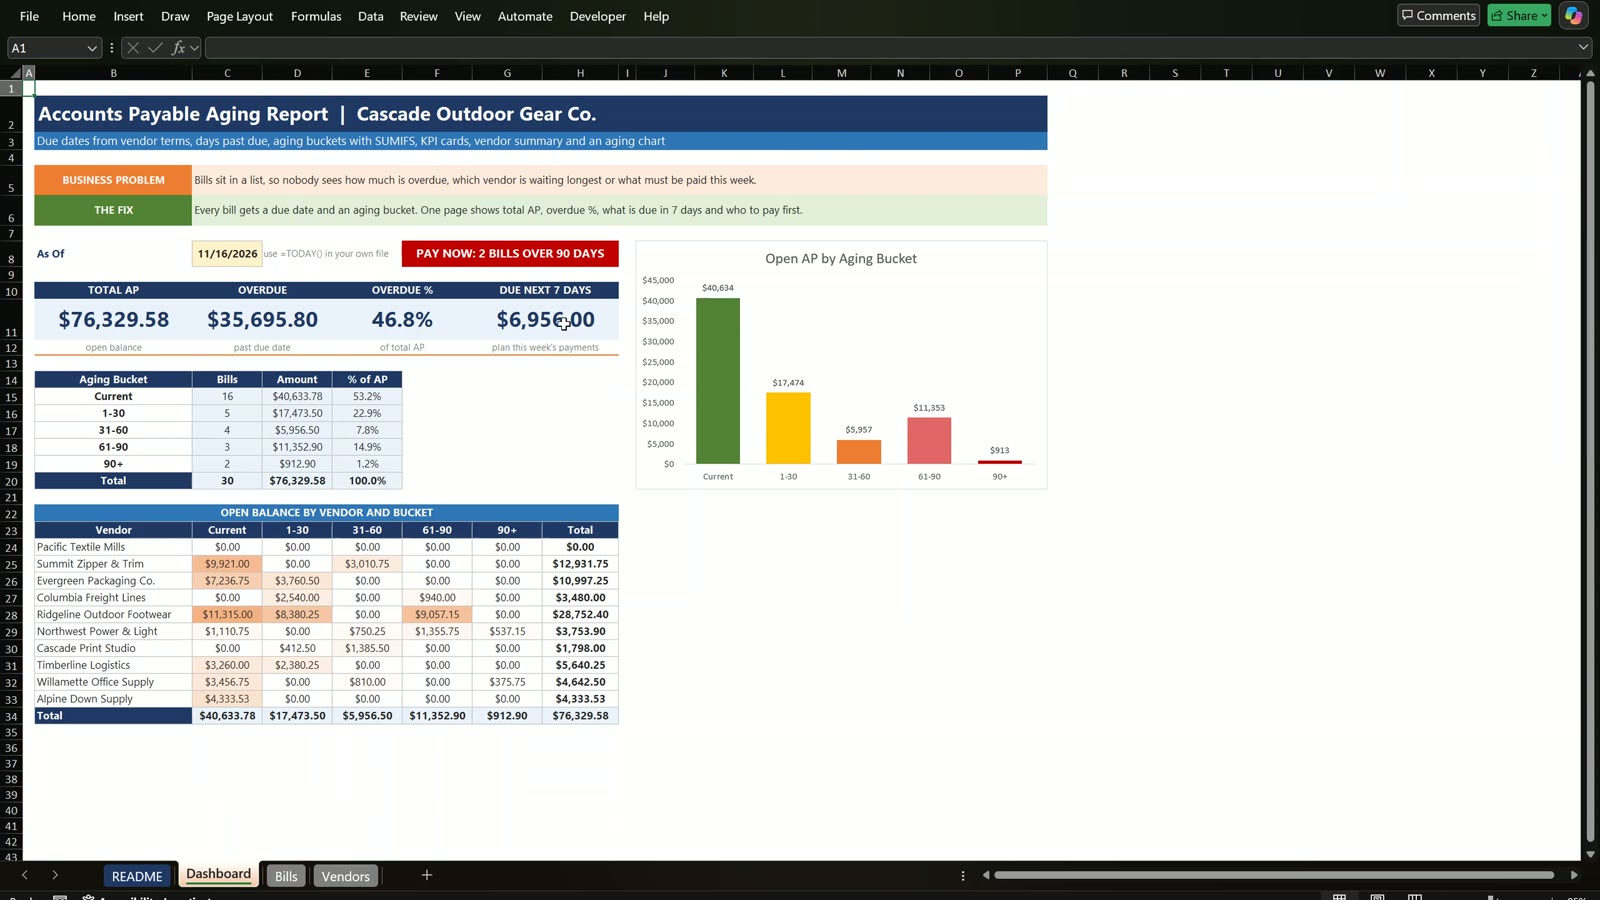
The example is Cascade Outdoor Gear Co., a fictional outdoor clothing and gear brand in Portland, Oregon, with 10 vendors on Net 15, 30, 45 and 60 terms and 64 bills. Total accounts payable is $76,329.58, of which $35,695.80 (46.8%) is overdue and $6,956.00 is due in the next 7 days.
Watch the video tutorial
Video overview
The video starts with the finished report, then builds it from a start file that holds only the bill register and the vendor terms. You add the new table columns, colour the buckets, build the KPI cards, fill the aging table and the vendor summary, add a 90+ alert badge and a chart, and finally record two payments to watch the whole report update. It is a build-along, so there is no free practice file; the ready-made version is linked below.
Get the ready-to-use Accounts Payable Aging Dashboard
All features, charts and vendor summary already built
What you will build
- Payment terms per bill with XLOOKUP from the vendor table
- Due date and balance for every bill
- Days past due that never go negative, and paid bills that are never late
- Aging buckets Current, 1-30, 31-60, 61-90, 90+ and Paid
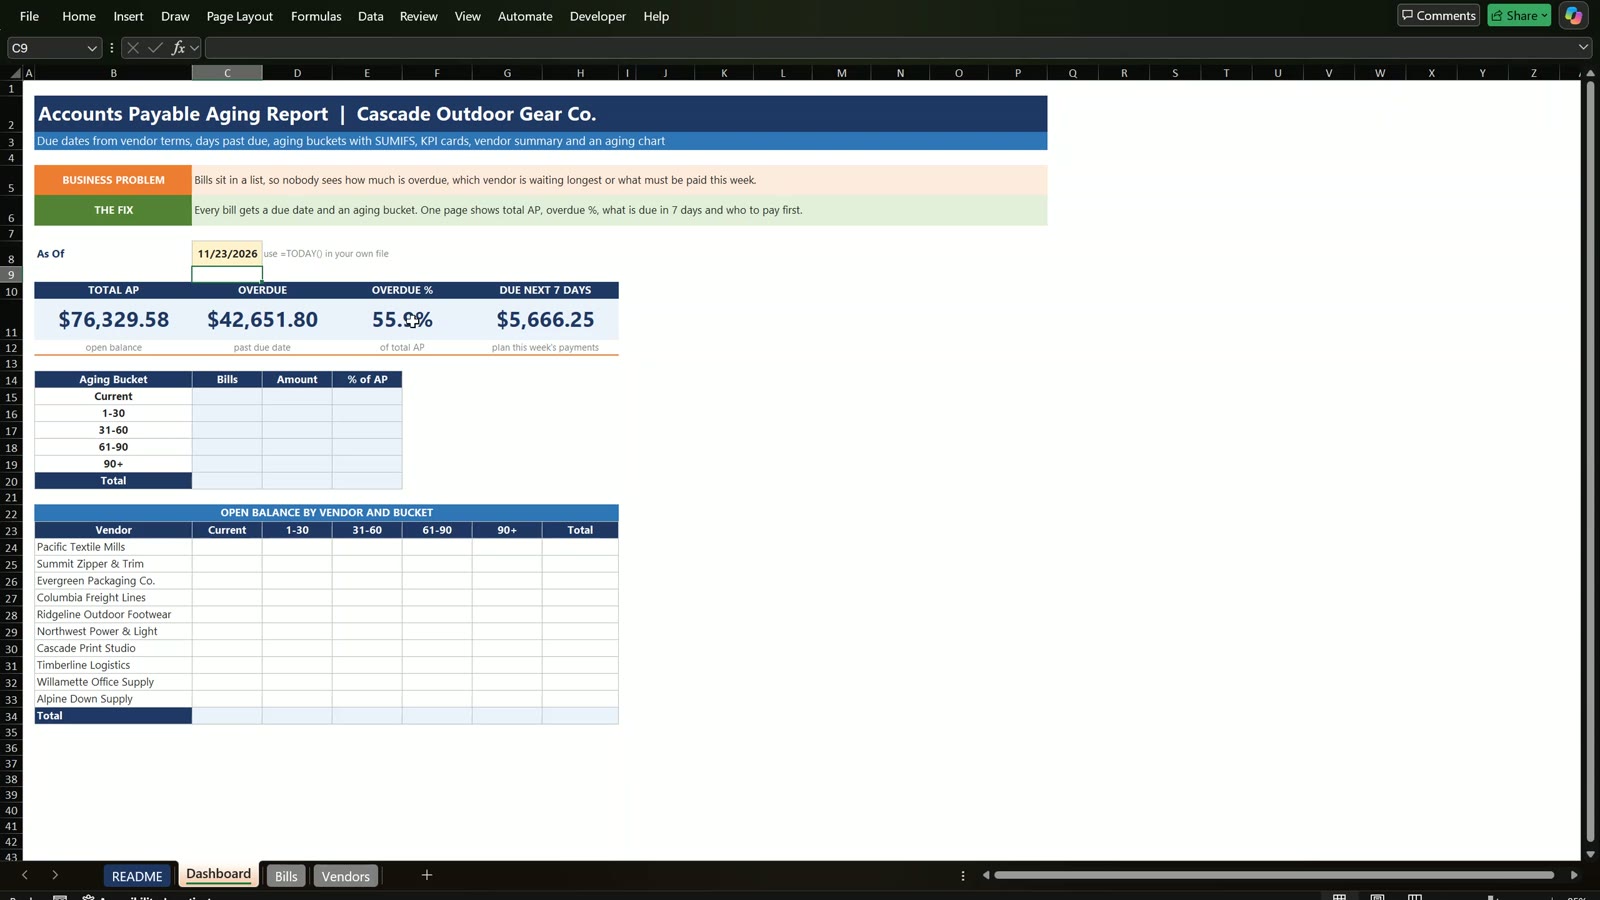
- KPI cards: total AP, overdue, overdue % and due in the next 7 days
- An aging table and a vendor by bucket summary
- A red or green alert badge and an aging chart
The start file: bills, vendors and terms
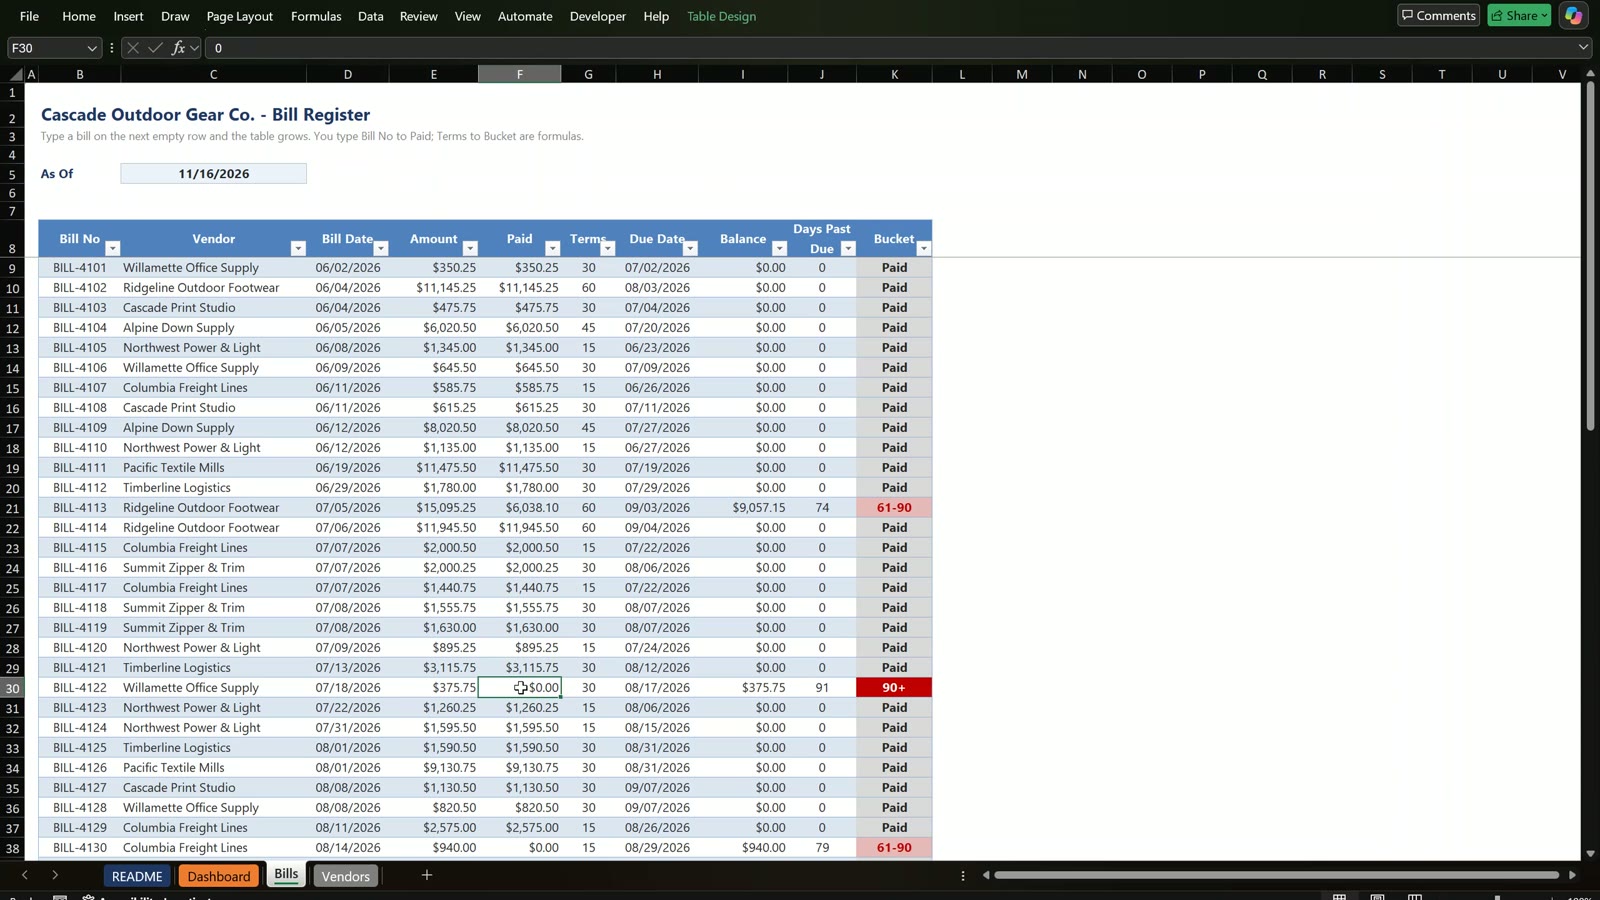
The start file has a bill register (an Excel table called tblBills) and a vendor table (tblVendors) with the terms. A bill date is not a due date: the vendor terms decide when you must pay, so the first job is to bring the terms into the bill list.
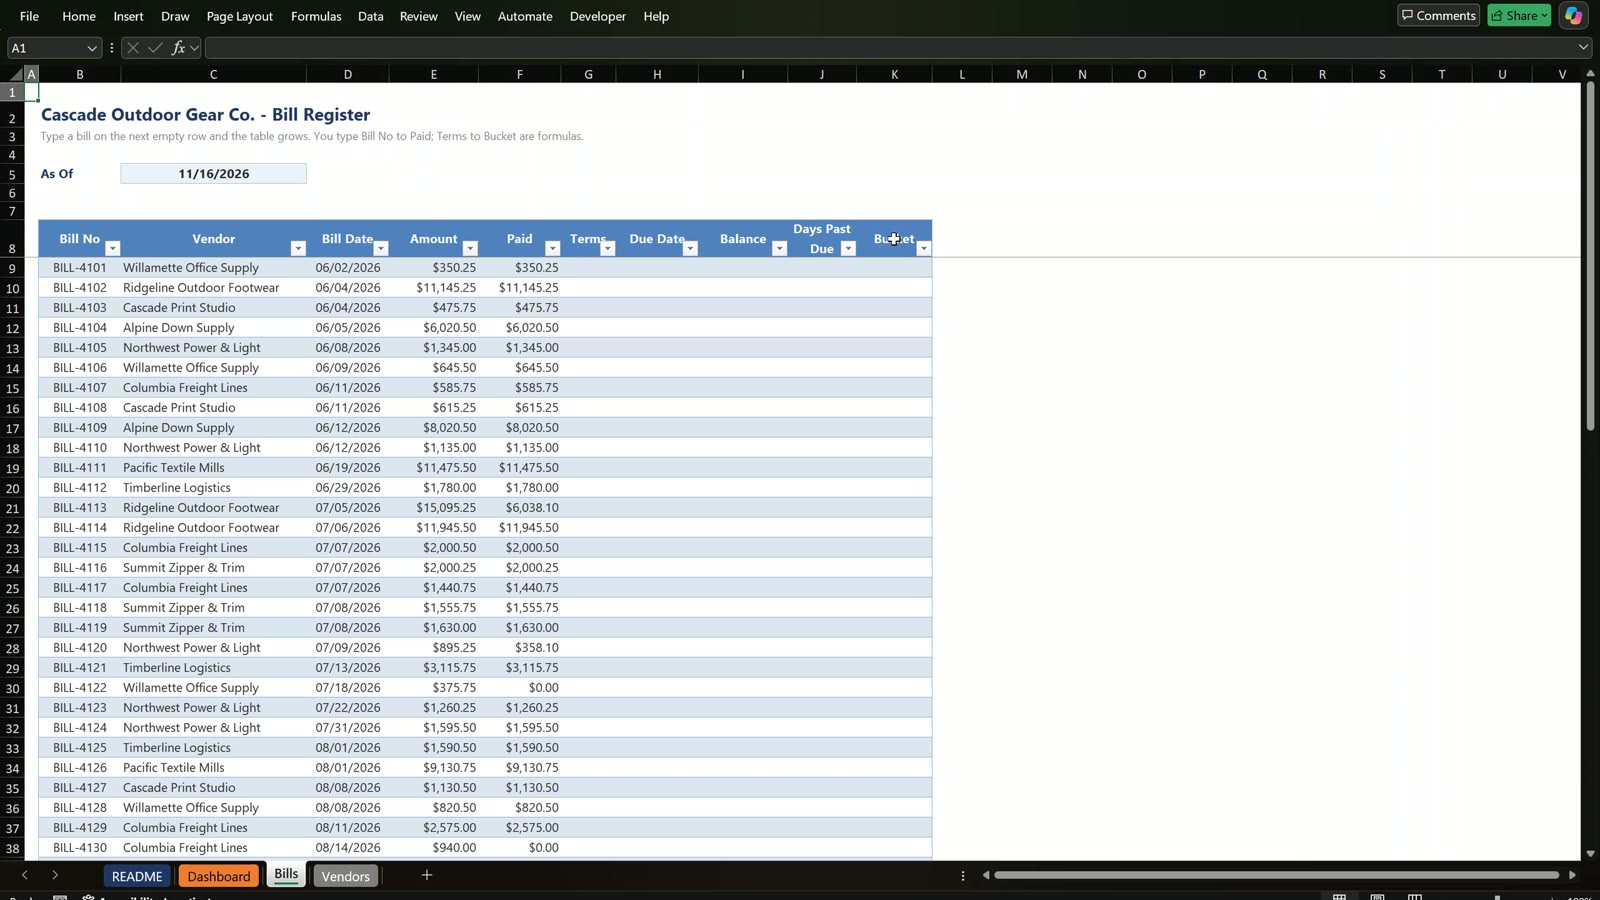
Step 1: Terms, due date, balance and days past due
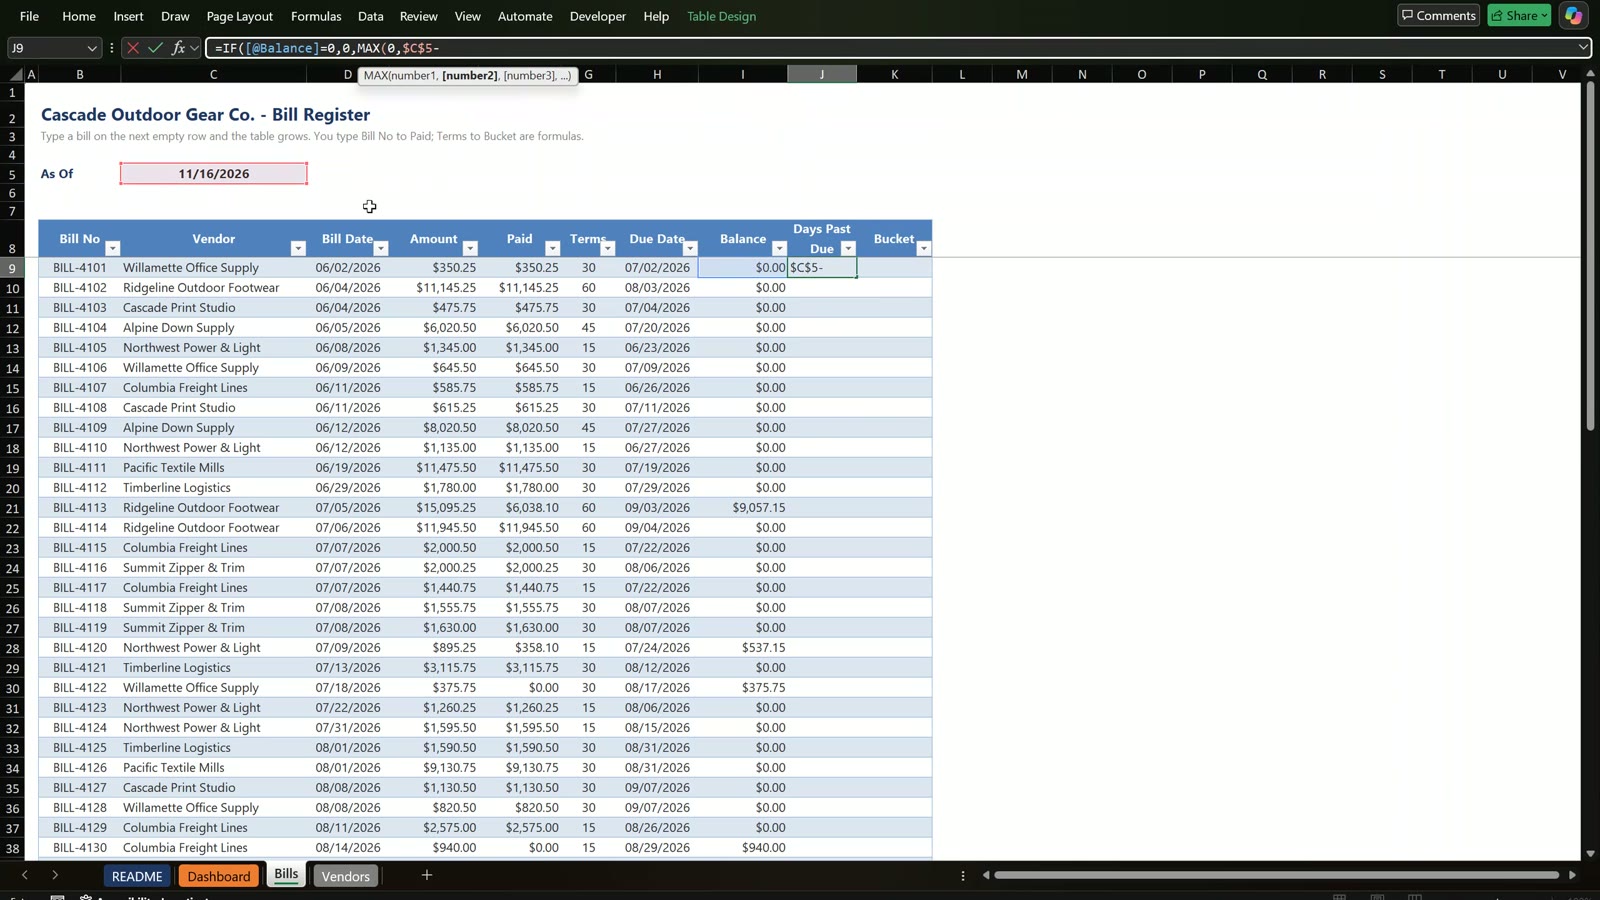
Type each formula in the first row of the table and Excel fills it down.
Terms:
=XLOOKUP([@Vendor],tblVendors[Vendor],tblVendors[Terms])
Due date:
=[@[Bill Date]]+[@Terms]
Balance:
=[@Amount]-[@Paid]
Days past due:
=IF([@Balance]=0,0,MAX(0,$C$5-[@[Due Date]]))
MAX(0, …) stops negative days for bills that are not due yet, and the balance test makes sure a paid bill is never late. Check one row: BILL-4113 from Ridgeline has a balance of $9,057.15, was due on 09/03/2026 and is 74 days past due.
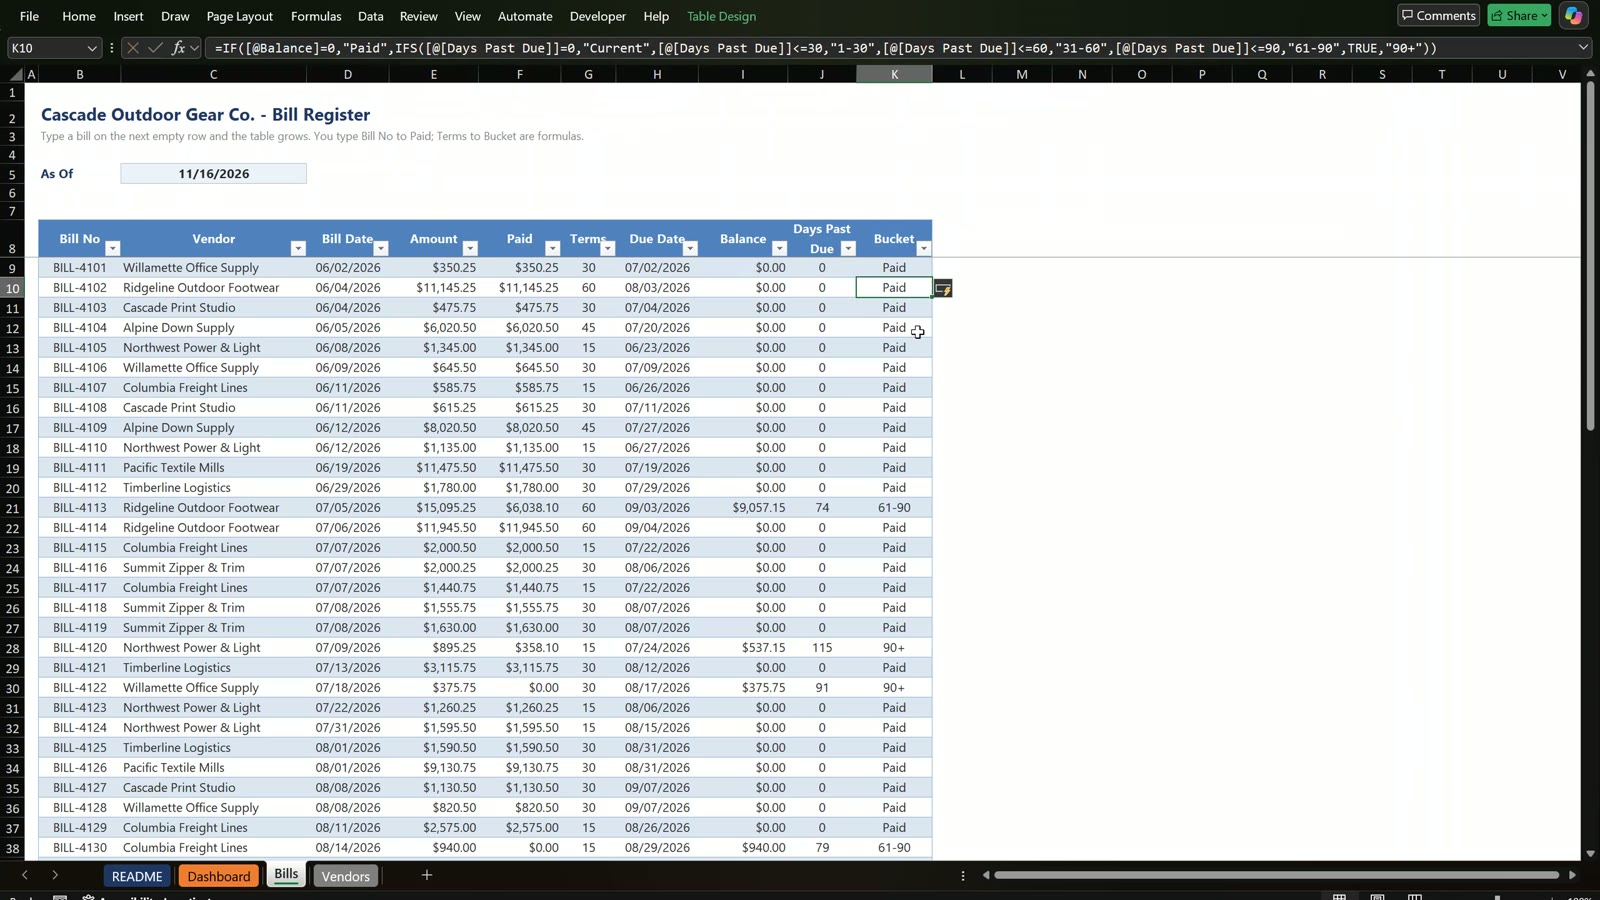
Step 1b: Aging buckets with IFS
=IF([@Balance]=0,"Paid",IFS([@[Days Past Due]]=0,"Current",[@[Days Past Due]]<=30,"1-30",[@[Days Past Due]]<=60,"31-60",[@[Days Past Due]]<=90,"61-90",TRUE,"90+"))
The balance is checked first so that a paid bill says Paid and not 90+. IFS then walks the conditions from left to right and stops at the first match.
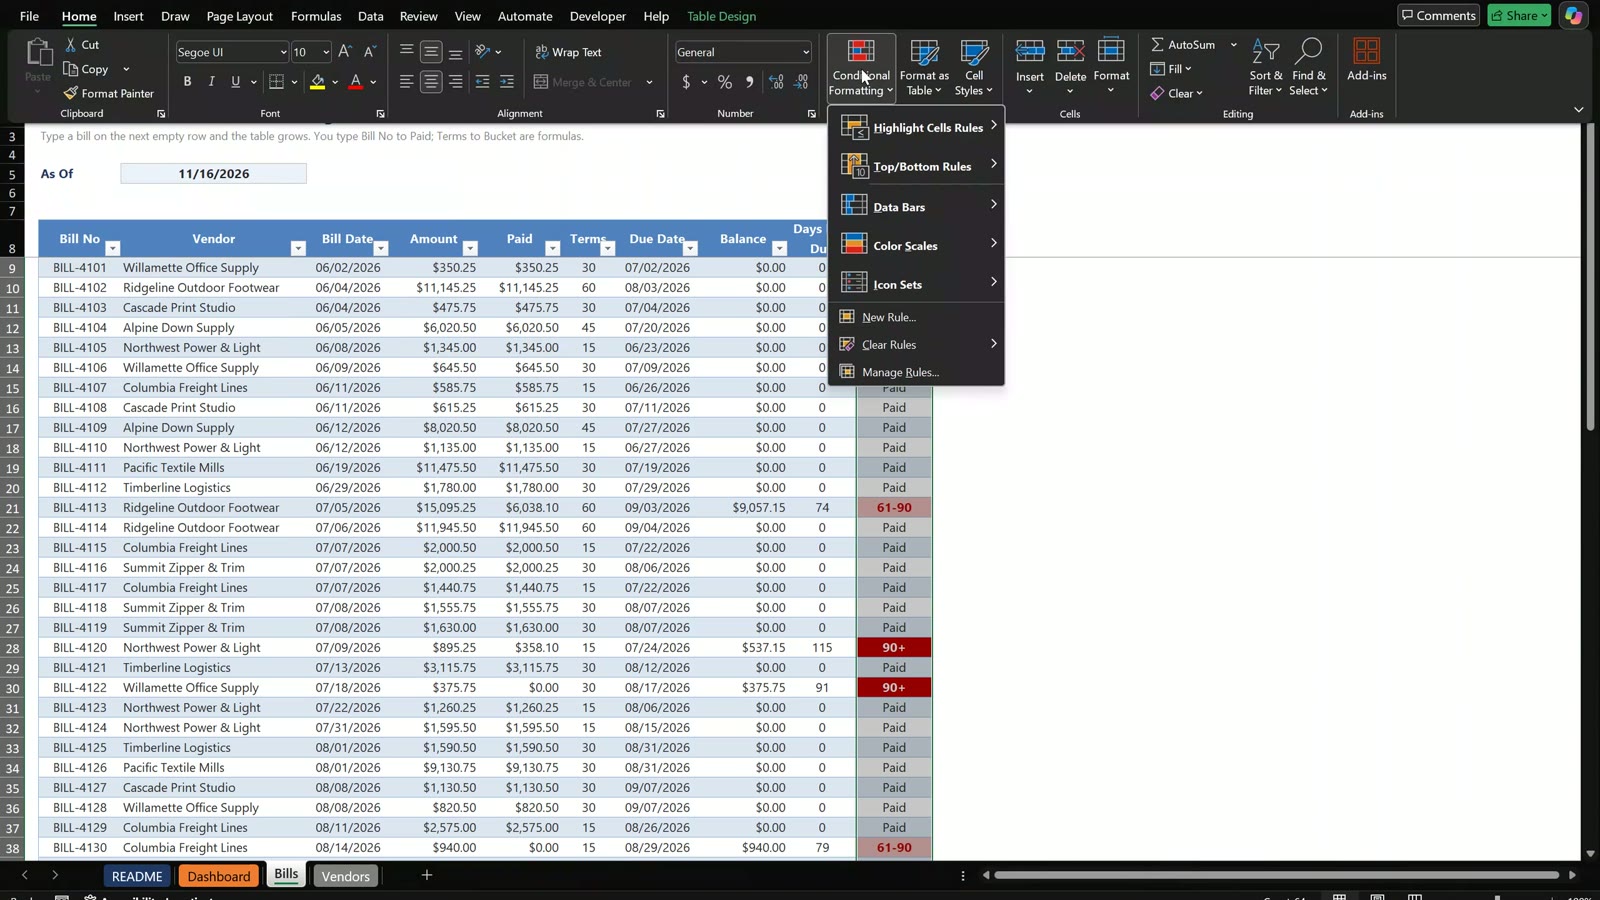
Step 2: Colour the buckets
Select the bucket column, choose New Rule, use a formula and add one rule per bucket, for example:
=$K9="90+"
Red with white text for 90+, salmon for 61-90, peach for 31-60, light yellow for 1-30, light green for Current and grey for Paid.
Step 3: KPI cards with SUMIFS
The four cards on the dashboard sheet:
=SUM(tblBills[Balance])
=SUMIFS(tblBills[Balance],tblBills[Days Past Due],">0")
=C11/B11
=SUMIFS(tblBills[Balance],tblBills[Due Date],">="&C8,tblBills[Due Date],"<="&C8+7)
When a criterion comes from a cell or a calculation, put the operator in quotes and join it with an ampersand. The results are $76,329.58 total AP, $35,695.80 overdue, 46.8% overdue and $6,956.00 due in the next 7 days.
Step 4: The aging table
=COUNTIFS(tblBills[Bucket],$B15)
=SUMIFS(tblBills[Balance],tblBills[Bucket],$B15)
=D15/$D$20
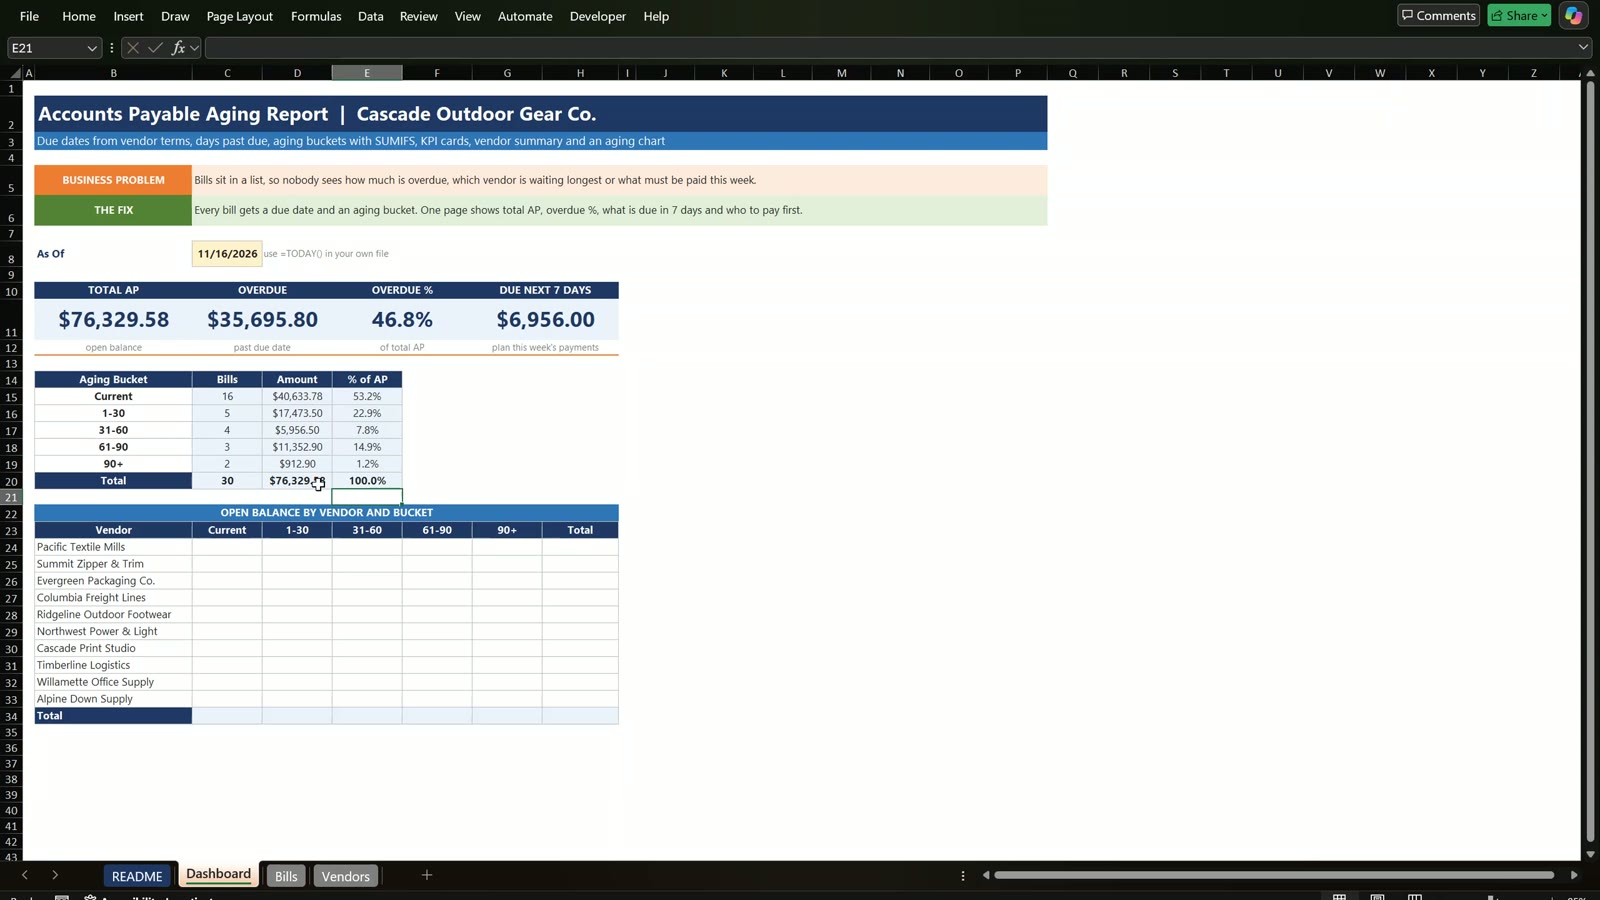
This gives Current 16 bills $40,633.78 (53.2%), 1-30 5 bills $17,473.50, 31-60 4 bills $5,956.50, 61-90 3 bills $11,352.90 and 90+ 2 bills $912.90, 30 open bills in total.
Step 5: Vendor by bucket summary with one formula
=SUMIFS(tblBills[Balance],tblBills[Vendor],$B24,tblBills[Bucket],C$23)
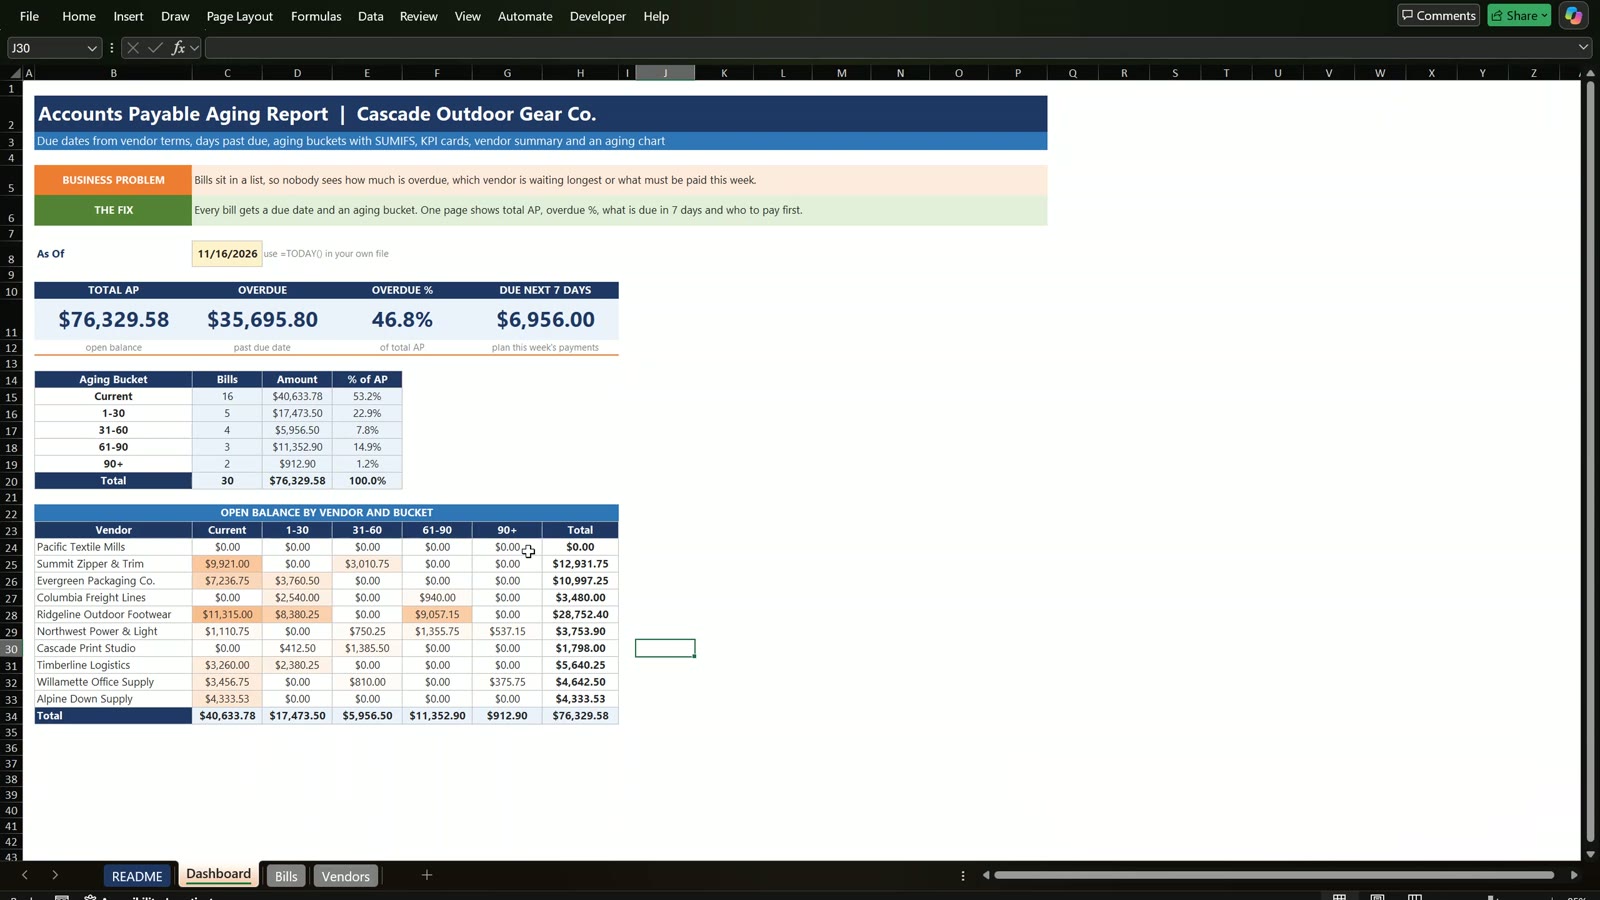
The dollar sign before B locks the column of the vendor names and the dollar sign before 23 locks the row of the bucket names, so one formula filled right and down builds the whole matrix. Add a colour scale to see where the overdue money sits: Ridgeline Outdoor Footwear owes $28,752.40, of which $17,437.40 is overdue.
Step 6: The 90+ alert badge and the aging chart
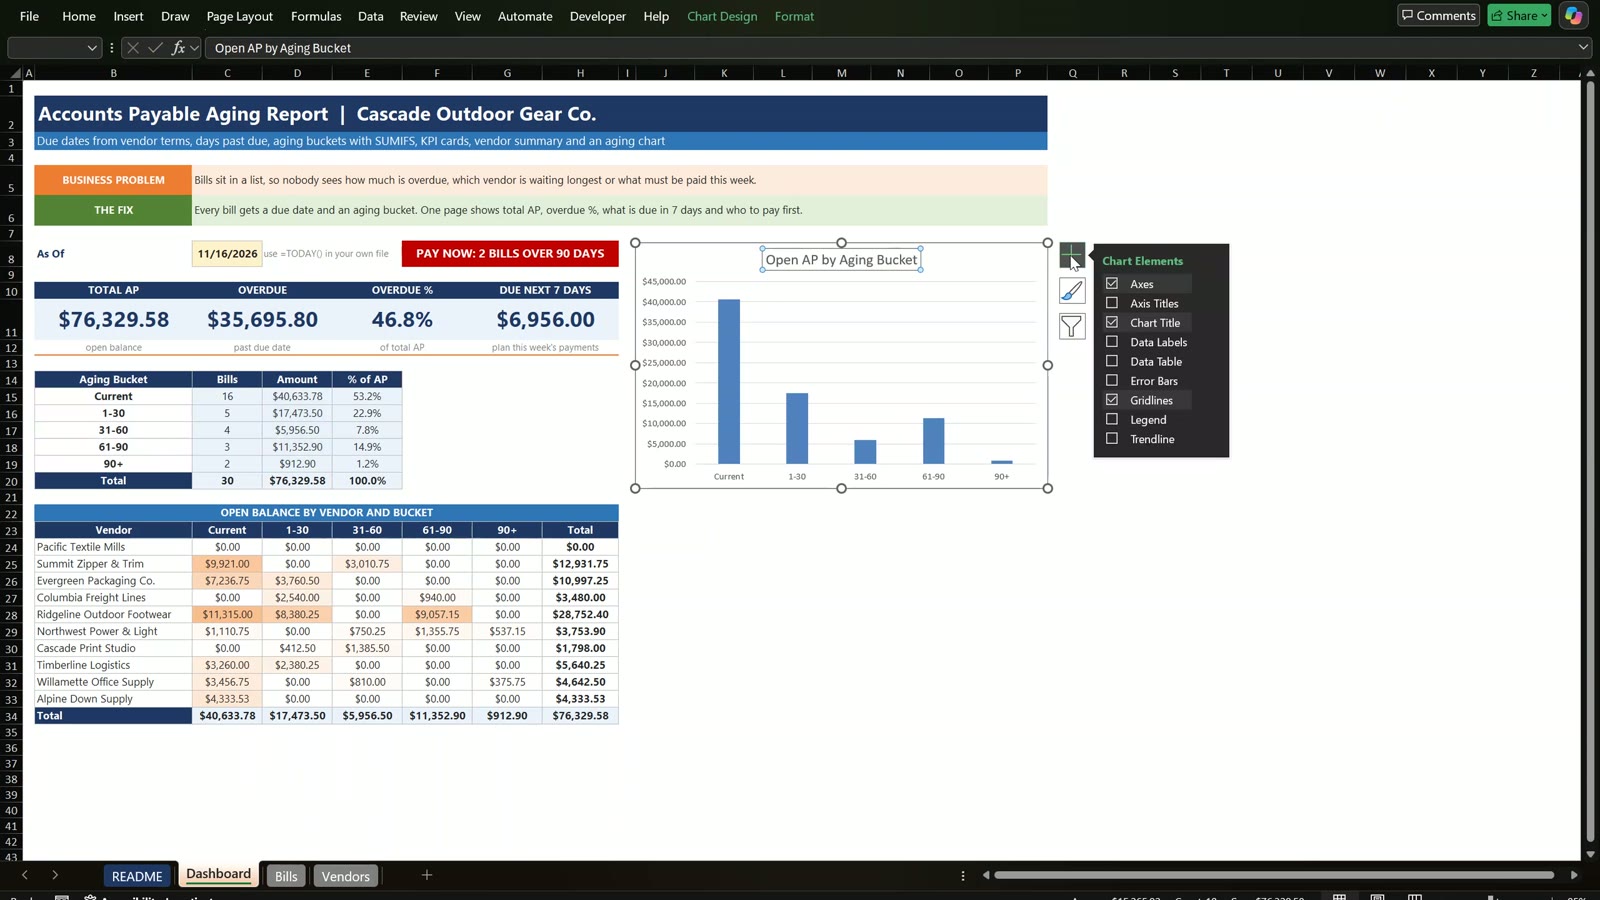
=IF(C19>0,"PAY NOW: "&C19&" BILLS OVER 90 DAYS","NO BILLS OVER 90 DAYS")
Two conditional formatting rules colour the badge: red when the text starts with PAY and green when it starts with NO. Then insert a clustered column chart from the bucket names and the amounts, remove the legend and add data labels.
Pay the oldest bills and watch the report update
Record full payments for the two oldest bills in the Paid column. The 90+ bucket drops to zero bills, total AP falls to $75,416.68, overdue to $34,782.90 (46.1%) and the badge turns green: NO BILLS OVER 90 DAYS.
Go further
If you would rather start from a finished file, the Accounts Payable Aging Dashboard in Excel has all of this built with extra features. To learn how to build dashboards like this with pivot tables, charts and slicers, see the Excel Pivot Tables & Dashboards course on the Next Gen Templates Academy.
Related tutorials: Inventory Management System in Excel VBA, Business Subscription Tracker in Excel and Gantt Chart in Excel 2026.
Get the ready-to-use Accounts Payable Aging Dashboard
All features, charts and vendor summary already built
Frequently asked questions
What is an accounts payable aging report?
It lists every unpaid vendor bill and groups it by how long it is past its due date, usually Current, 1-30, 31-60, 61-90 and 90+ days. It shows what you owe, how much is overdue and which vendors to pay first.
How do I calculate days past due in Excel?
First work out the due date as bill date plus the payment terms, then use the As Of date minus the due date, wrapped in MAX(0, …) so bills that are not due yet show zero instead of a negative number. A bill with a balance of zero is Paid and never late.
Why use IFS for the aging buckets?
IFS checks the conditions from left to right and returns the first match. Check the balance first so a paid bill says Paid, then 0 days is Current, up to 30 is 1-30, and so on up to 90+.
How do I fill the vendor by bucket table with one formula?
Use SUMIFS with the vendor in a column-locked reference and the bucket in a row-locked reference, then fill it right and down. The mixed references are the whole trick.
Is there a free practice file?
No. This is a build-along: you build the report from the bill register shown in the video. The finished, ready-to-use version is the Accounts Payable Aging Dashboard in Excel from Next Gen Templates.
By PK, Excel trainer and creator of Next Gen Templates.