In today’s fast-paced healthcare environment, staying compliant with regulatory standards is not just important—it’s essential. Healthcare providers need to ensure that they meet various regulatory guidelines to maintain patient safety, data security, and service quality. But tracking regulatory adherence manually can be overwhelming. That’s where a Healthcare Regulatory Adherence KPI Dashboard in Excel comes into play.
This dashboard is a powerful, ready-to-use Excel tool designed to help healthcare professionals monitor, measure, and manage their regulatory KPIs efficiently. In this article, we’ll explore everything you need to know about this dashboard—from key features and advantages to best practices and common questions.
Click to Purchases Healthcare Regulatory Adherence KPI Dashboard in Excel
What Is a Healthcare Regulatory Adherence KPI Dashboard?
A Healthcare Regulatory Adherence KPI Dashboard is a visual tracking tool developed in Excel to help hospitals, clinics, and medical institutions monitor their compliance with healthcare regulations. It brings together multiple key performance indicators (KPIs) in one place, offering real-time insights and comparisons across timeframes.
This dashboard allows users to input monthly data for MTD (Month-to-Date), YTD (Year-to-Date), Targets, and Previous Year figures, making regulatory performance monitoring transparent and data-driven.
Key Features of the Dashboard
This ready-to-use Excel template contains 7 dynamic worksheets that make tracking simple and structured:
Home Sheet
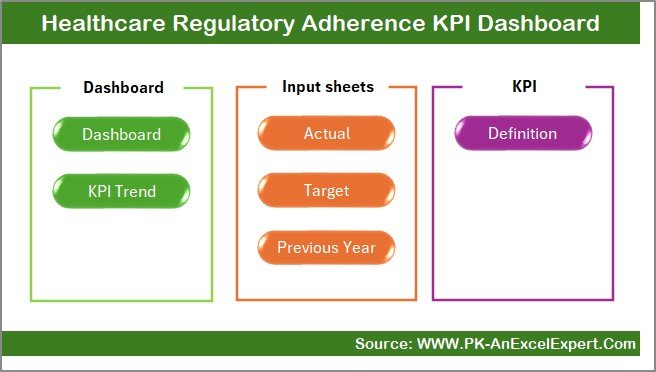
- Acts as a navigation index
- Includes 6 clickable buttons to quickly jump to other sheets
- Makes the dashboard user-friendly and well-organized
Dashboard Sheet Tab
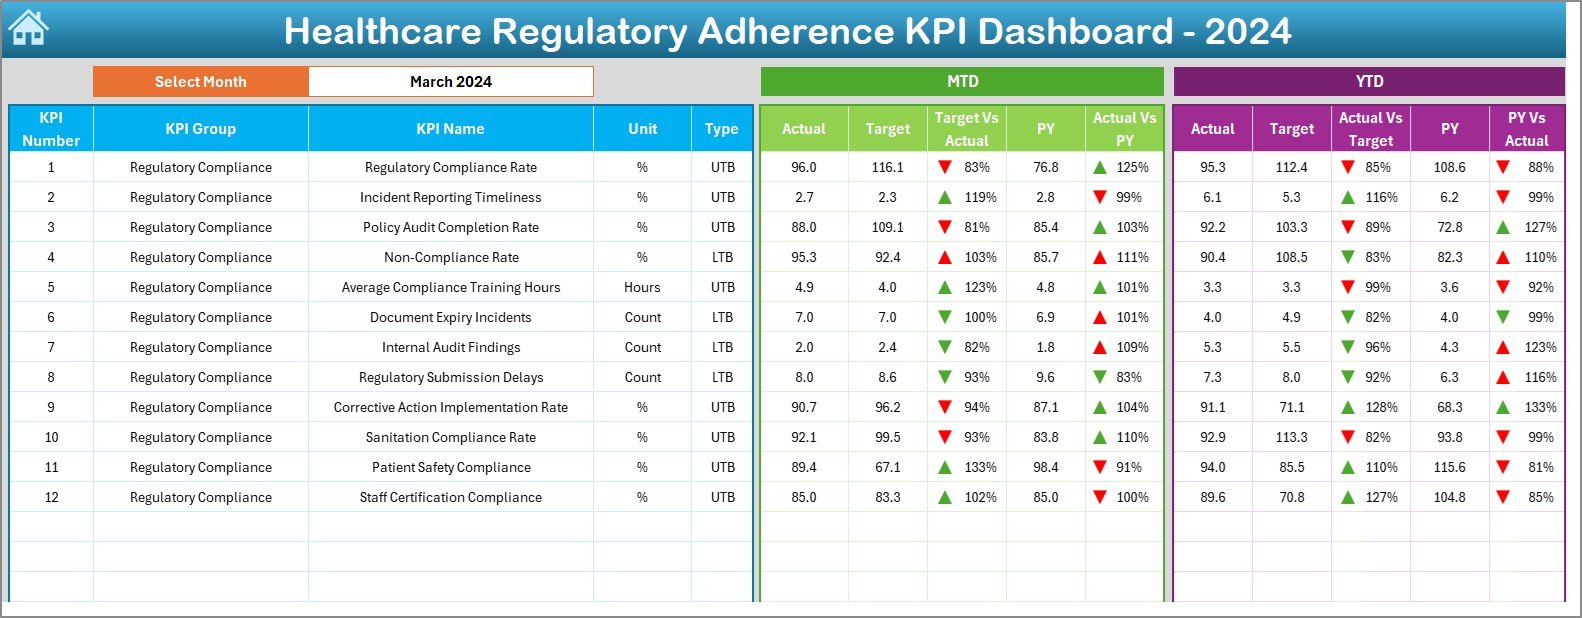
- The core of the dashboard
- Select any month from a drop-down menu in cell D3
- Automatically updates all KPI values for the selected month
Displays:
- MTD Actual, Target, and Previous Year Data
- Target vs Actual and PY vs Actual with Conditional Formatting (Up/Down Arrows)
- YTD Actual, Target, and Previous Year Data with the same comparisons
KPI Trend Sheet Tab
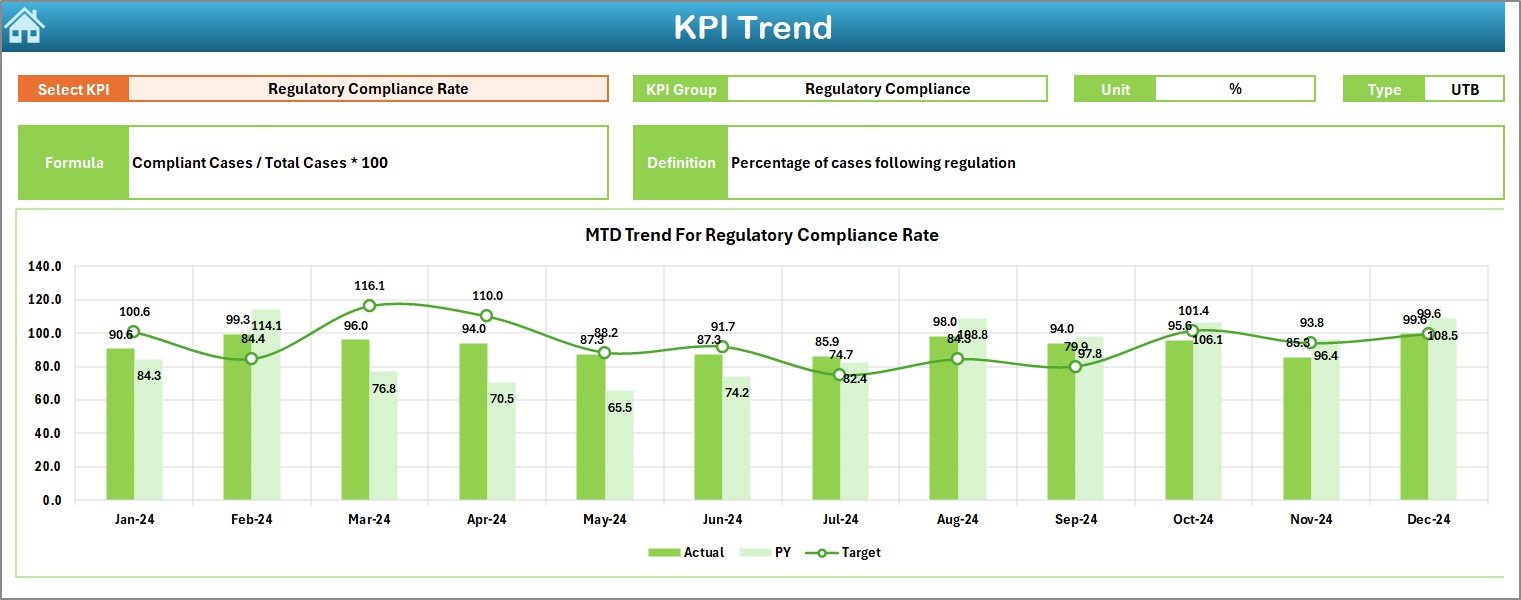
- Choose a KPI from the drop-down in cell C3
- Displays detailed KPI Group, Unit, Type (UTB/LTB), Formula, and Definition
- Shows trend charts for MTD and YTD against Target and Previous Year values
Actual Numbers Input Sheet
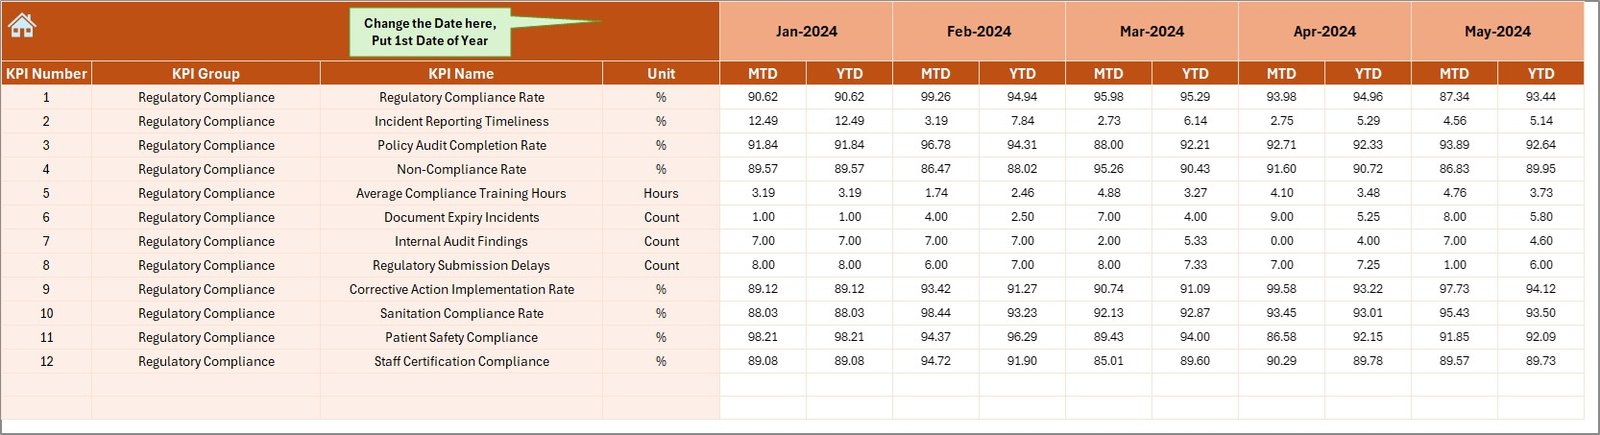
- Input actual KPI values here
- Enter MTD and YTD data for each month
- Use range E1 to set the starting month of the year
Target Sheet Tab
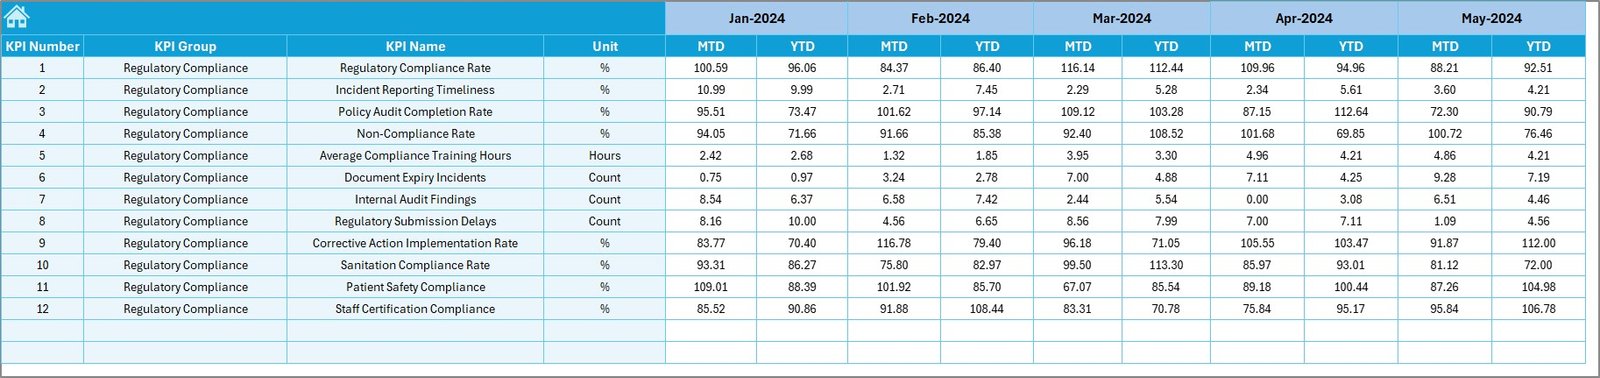
- Enter target values for MTD and YTD
- Update for each KPI monthly
Previous Year Number Sheet Tab
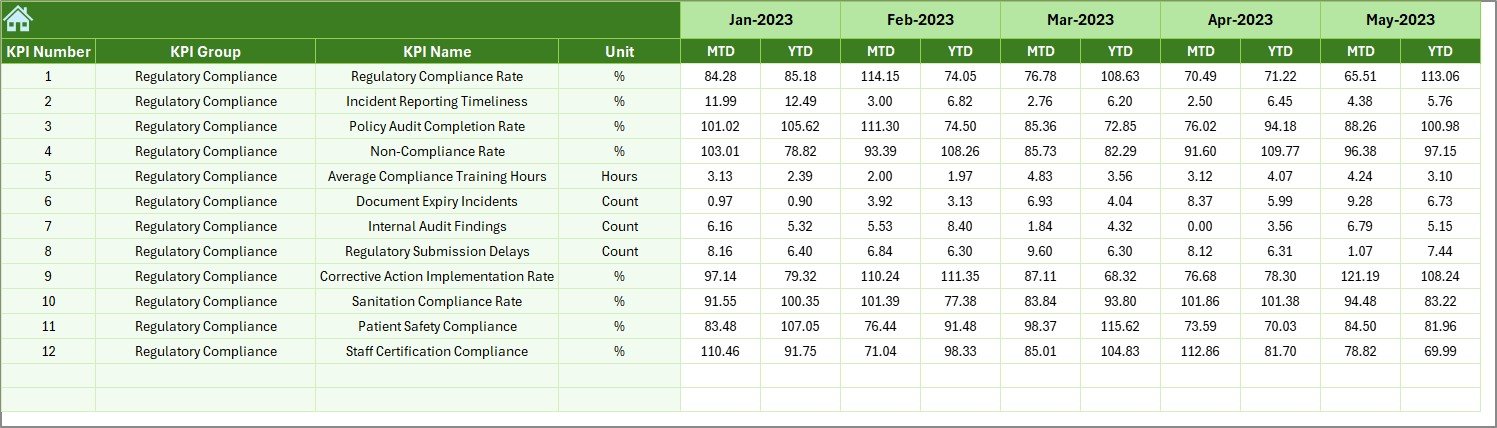
- Record previous year’s KPI values for comparisons
- Format is similar to the actual and target input sheets
KPI Definition Sheet Tab
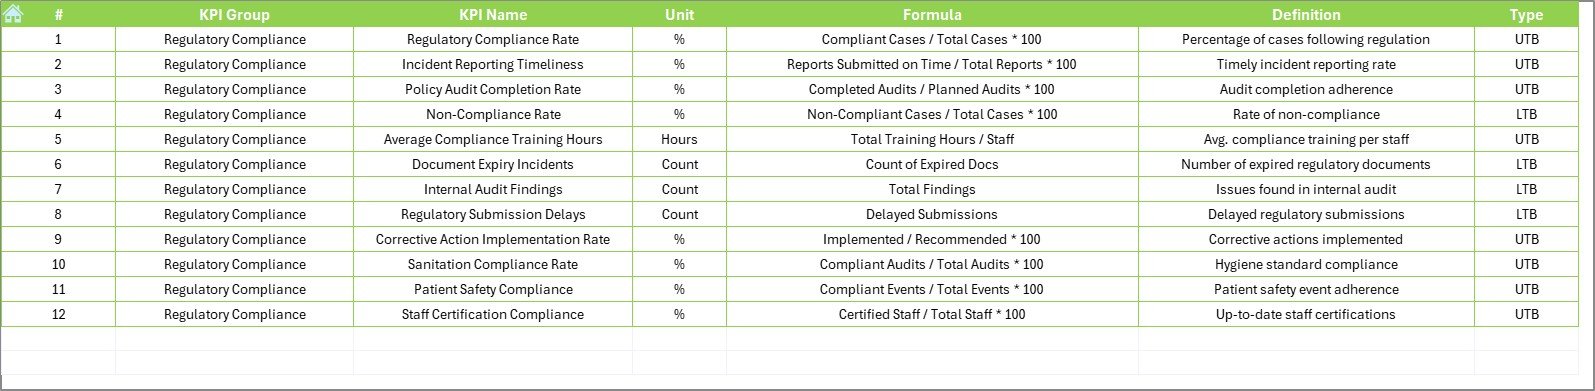
- List of all KPIs with relevant details
- Columns include: KPI Name, KPI Group, Unit, Formula, and Definition
Advantages of Using a Healthcare Regulatory Adherence KPI Dashboard
🔹 Real-Time Compliance Monitoring
Click to Purchases Healthcare Regulatory Adherence KPI Dashboard in Excel
You can see performance vs. compliance targets immediately for both MTD and YTD, helping you respond quickly to issues.
🔹 Easy to Use
The dashboard requires no advanced technical knowledge. Anyone familiar with Excel can use it comfortably.
🔹 Better Decision Making
Visual trends and comparisons provide data-driven insights to help leaders make informed decisions.
🔹 Enhances Accountability
With transparent data and assigned KPIs, team members know what to focus on.
🔹 Saves Time
Instead of compiling data from multiple systems, you get everything centralized in one Excel workbook.
Best Practices for Using the Dashboard
To make the most of your Healthcare Regulatory Adherence KPI Dashboard, follow these best practices:
✅ Set Clear KPI Targets
Define your MTD and YTD targets based on past performance, benchmarks, or regulatory guidelines.
✅ Keep the Data Updated Monthly
Make it a habit to input actual numbers at the beginning of each month for accuracy.
✅ Review Trends Regularly
Use the trend charts to identify early warning signs or patterns that require attention.
✅ Use Conditional Formatting Effectively
Pay attention to the up/down arrows that visually guide you about performance versus targets.
✅ Share with Stakeholders
Circulate the dashboard with department heads to maintain transparency and improve performance.
Sample KPIs You Can Track
Here are some key KPIs that are commonly tracked in the Regulatory Adherence Dashboard:
- Patient Data Accuracy Rate (UTB) – % of correct records
- Compliance Training Completion (UTB) – % of staff trained
- HIPAA Violation Incidents (LTB) – Number of breaches
- Documentation Timeliness (UTB) – % on-time completion
- Audit Findings (LTB) – Number of findings per audit
- Patient Consent Compliance (UTB) – % of consents captured
- Clinical Protocol Adherence (UTB) – % of cases following protocol
- Record Retention Rate (UTB) – % of records stored as required
Each KPI should have clear units, formulas, and definitions as provided in the KPI Definition Sheet.
How to Customize the Dashboard
1. Add or Remove KPIs
Modify the KPI Definition and Input sheets to suit your organization’s specific regulatory goals.
2. Change KPI Categories
Group KPIs into categories like “Patient Safety,” “Documentation,” or “Privacy Compliance” for clarity.
3. Update Conditional Formatting
You can change the rules or icons in the dashboard to align with your internal reporting style.
Why Excel Is the Ideal Tool for KPI Dashboards
While you can use complex business intelligence tools, Excel remains a top choice for these reasons:
- Ease of Use: No steep learning curve
- Accessibility: Most teams already use Excel
- Cost-Effective: No extra licensing needed
- Customizable: Can be tailored to your specific requirements
- Printable Reports: Easy to export for meetings
Improving Regulatory Adherence with This Dashboard
A well-maintained regulatory adherence dashboard does more than just collect data. It promotes a culture of continuous improvement and vigilance. Healthcare providers can proactively spot deviations and improve compliance processes before they lead to audits or penalties.
Use this dashboard as part of your monthly review meetings and compliance audits. Tie it to employee performance goals to boost engagement and responsibility.
Conclusion
The Healthcare Regulatory Adherence KPI Dashboard in Excel is an essential tool for healthcare organizations committed to maintaining compliance and improving quality. With an intuitive layout, automated calculations, and rich visual insights, this dashboard makes monitoring healthcare KPIs not only manageable but effective.
By adopting this Excel-based dashboard, your organization can stay ahead of regulatory challenges and continue to offer safe, reliable care to patients.
Frequently Asked Questions (FAQs)
❓ What is the purpose of this dashboard?
It helps healthcare teams track and improve adherence to regulatory standards through monthly and yearly KPI tracking.
❓ Is Excel a reliable platform for this dashboard?
Yes, Excel is accessible, cost-effective, and powerful enough to handle KPI tracking with automation and visualization.
❓ Can I modify the KPIs to fit my needs?
Absolutely. You can add or remove KPIs in the Definition and Input sheets as per your organization’s goals.
❓ Who should use this dashboard?
Compliance officers, healthcare administrators, quality assurance managers, and department heads.
❓ How often should I update the data?
You should update the data every month to ensure accuracy and maintain up-to-date tracking.
❓ Does the dashboard offer year-over-year comparison?
Yes, it provides comparisons of current values to previous year data for better context.
❓ How can I get this dashboard?
You can download it from your organization’s internal resources or request a copy from the dashboard creator.
Click to Purchases Healthcare Regulatory Adherence KPI Dashboard in Excel
Visit our YouTube channel to learn step-by-step video tutorials