In today’s fast-paced project management environment, measuring performance is no longer a luxury—it’s a necessity. One of the most effective ways to keep your projects on track and ensure client satisfaction is through a Project Management Service Delivery KPI Dashboard in Excel. This guide will walk you through everything you need to know, from understanding the importance of KPIs to best practices, and even how to make the most of our ready-to-use Excel template.
Click to Purchases Project Management Service Delivery KPI Dashboard in Excel
What Is a Service Delivery KPI Dashboard?
A Service Delivery KPI Dashboard is a visual tool that helps project managers and teams monitor performance metrics related to service delivery. It allows you to:
- Track project timelines and quality
- Evaluate team efficiency
- Measure client satisfaction
- Compare targets with actual results
Excel-based dashboards are popular because they’re flexible, cost-effective, and easily customizable.
Why Use Excel for KPI Dashboards?
While many dashboard tools exist, Excel remains a top choice due to its:
- Familiarity and accessibility
- Strong data handling capabilities
- Customizability with formulas and charts
- Compatibility with VBA for automation
With the right design, Excel dashboards can rival many paid tools in functionality and performance.
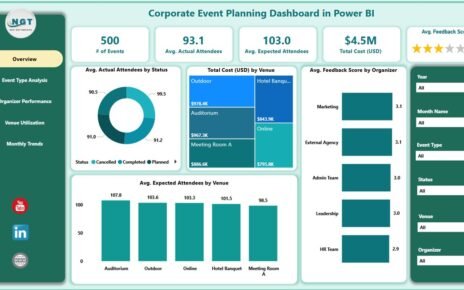
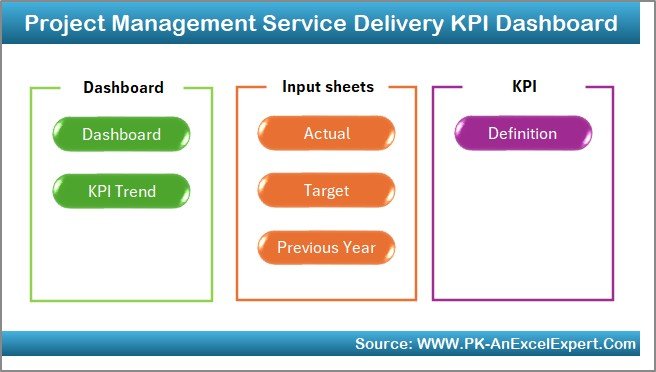
Overview of the Project Management Service Delivery KPI Dashboard Template
Our ready-to-use dashboard comes with seven powerful worksheets, each designed to streamline your tracking process.
Home Sheet
- Acts as a navigation hub
- Includes buttons to jump to all other sheets
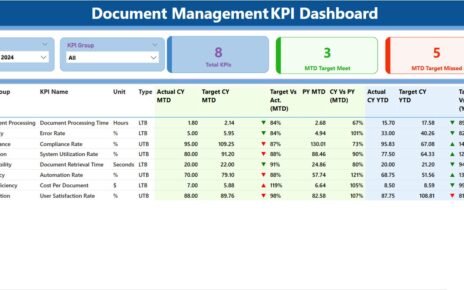
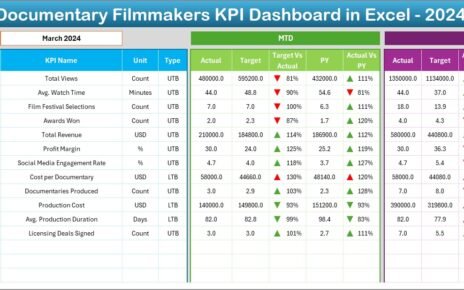
Dashboard Sheet Tab
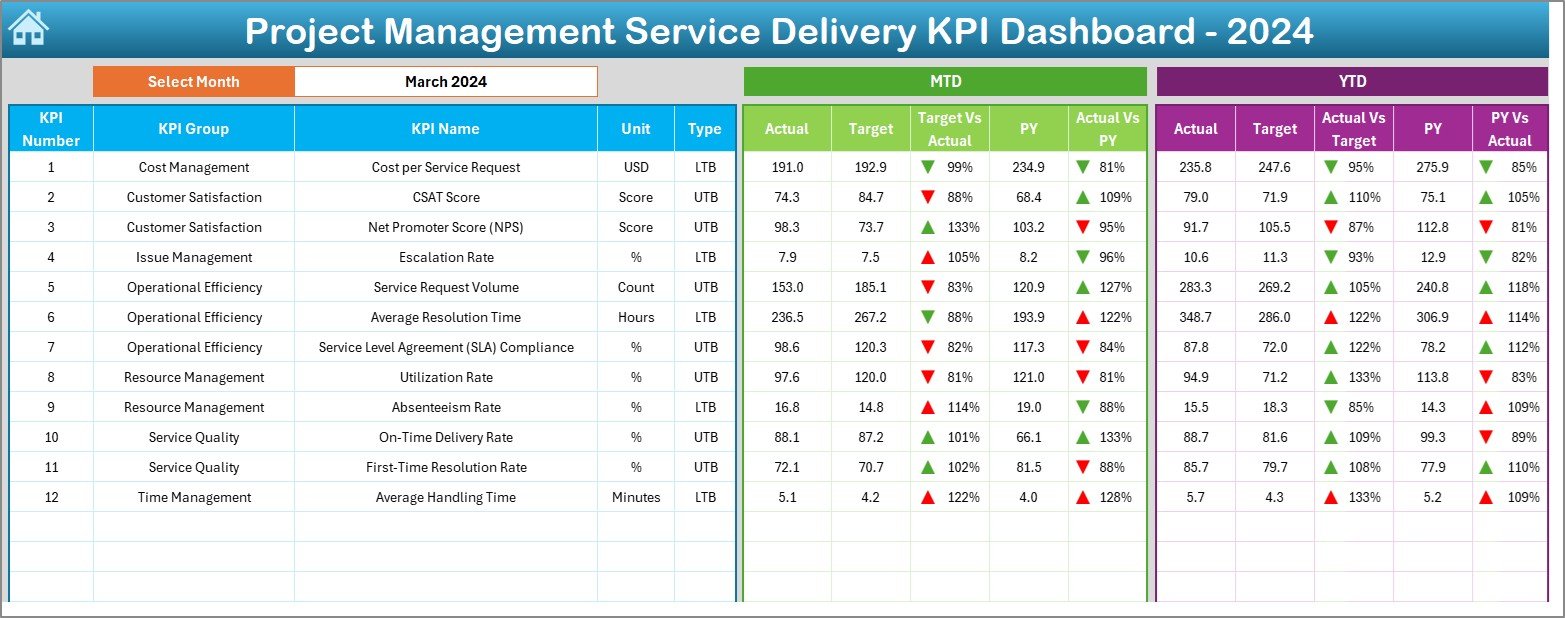
- Core visualization sheet
- Select month from dropdown (Cell D3)
- Displays MTD (Month-To-Date) and YTD (Year-To-Date) actuals, targets, and previous year comparisons
- Conditional formatting with up/down arrows to highlight progress
KPI Trend Sheet Tab
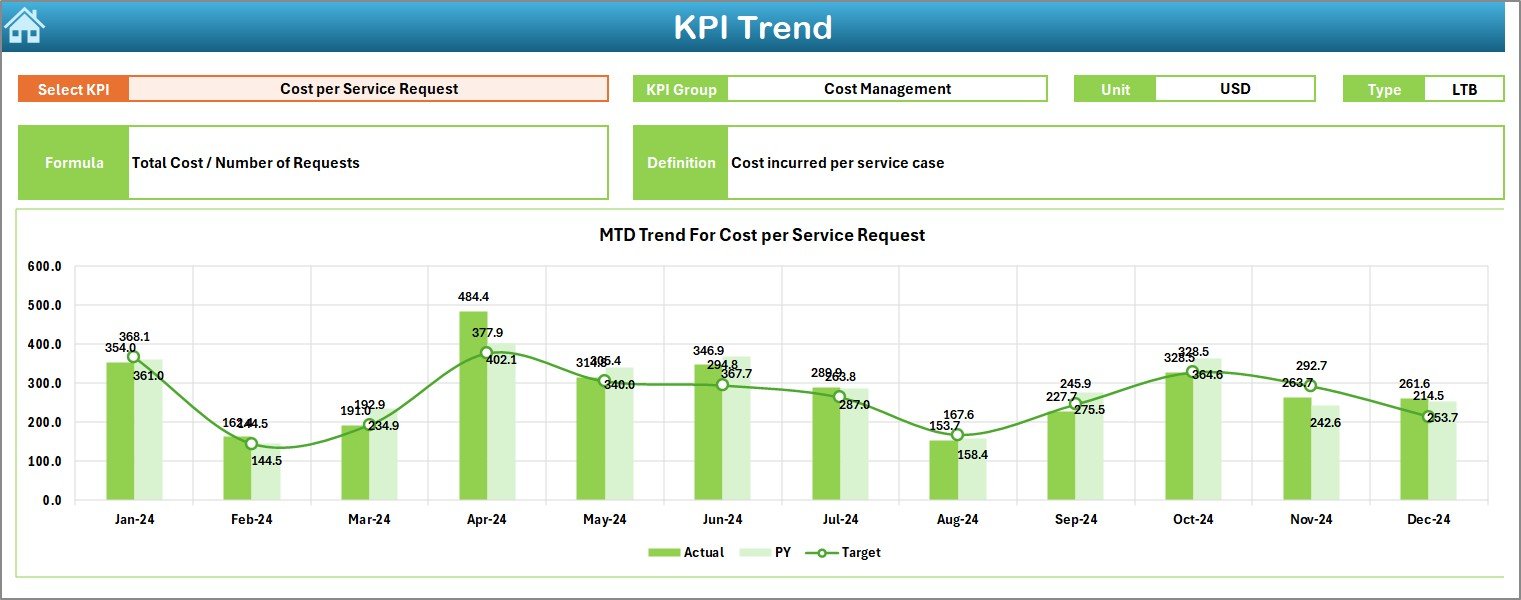
- Select KPI name from dropdown (Cell C3)
Shows:
- KPI Group
- Unit of Measurement
- KPI Type (UTB or LTB)
- Formula
- Definition
- MTD and YTD trend charts for Actual vs Target vs Previous Year
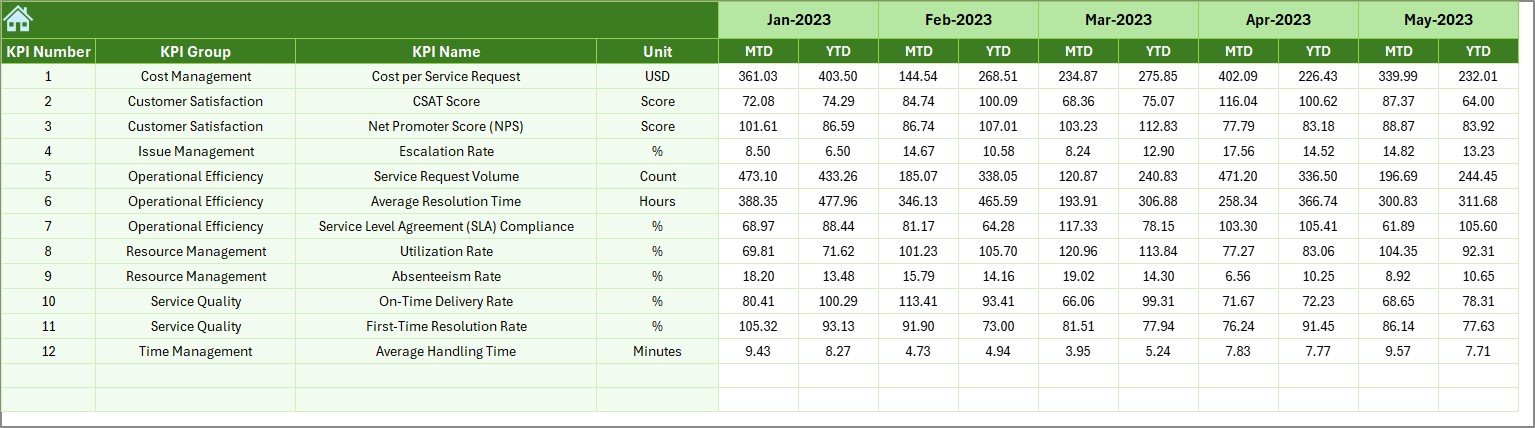
Actual Numbers Input Sheet
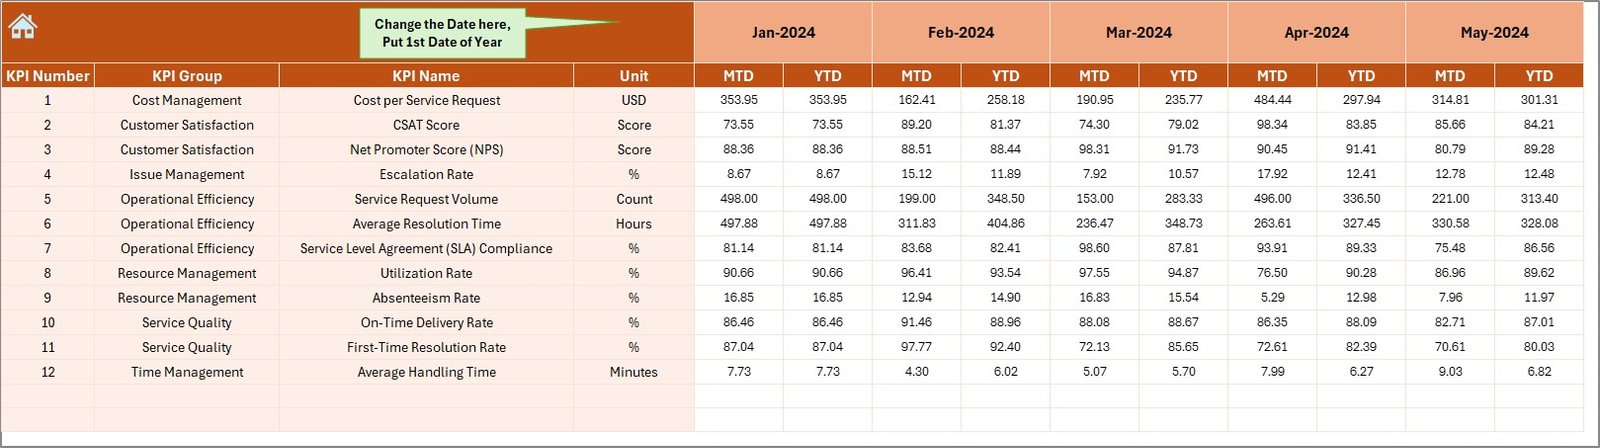
- Input monthly MTD and YTD actuals
- Change the base month in Cell E1 to update other values dynamically
Click to Purchases Project Management Service Delivery KPI Dashboard in Excel
Target Sheet Tab
- Enter monthly targets for all KPIs
- Separate fields for MTD and YTD values
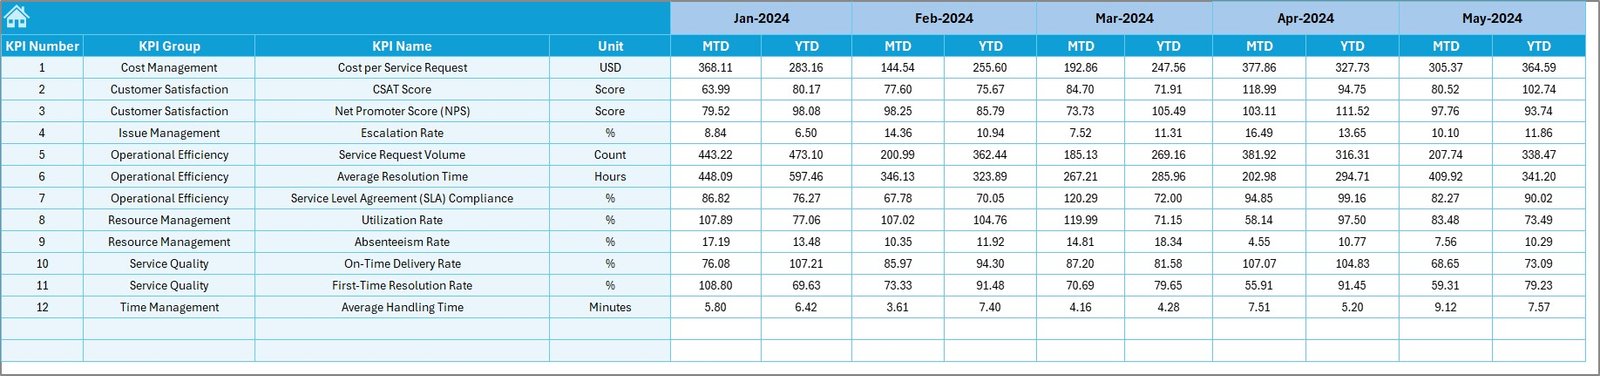
Previous Year Numbers Sheet Tab
- Input past year’s data for each KPI
- Helps in YOY (Year-Over-Year) comparisons
KPI Definition Sheet Tab
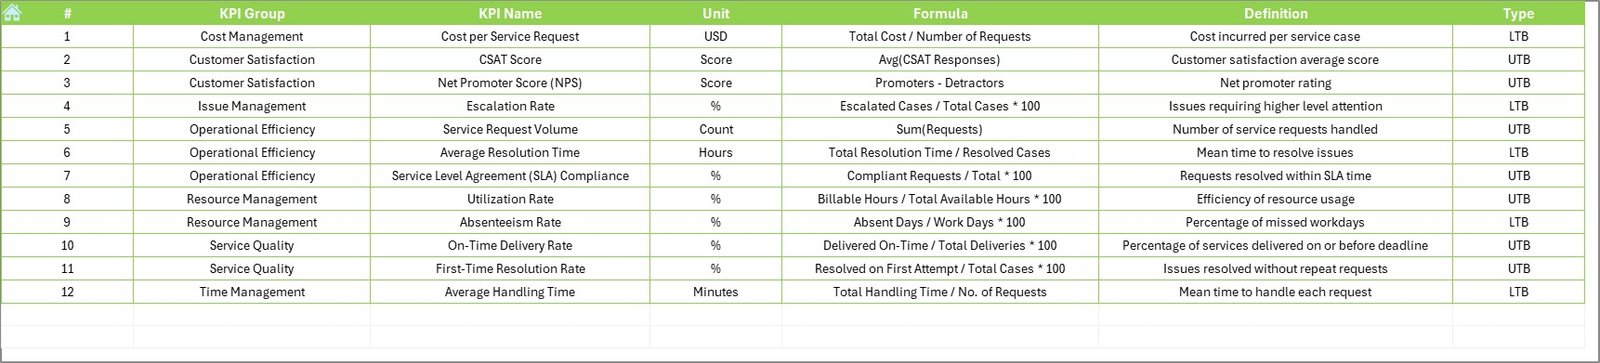
- Define each KPI with:
- KPI Group
- KPI Name
- Unit
- Formula
- Clear, concise definitions
Advantages of Using a Service Delivery KPI Dashboard
Using this dashboard provides numerous benefits for your project team:
- Improved Decision-Making: Access real-time insights for smarter decisions
- Enhanced Accountability: Everyone knows what to focus on
- Increased Efficiency: Less time spent gathering data manually
- Better Client Satisfaction: Timely delivery and quality checks
- Transparency: Clear overview of performance metrics
Best Practices for Using the KPI Dashboard
To get the most value, follow these proven tips:
- Keep KPIs Relevant: Focus on metrics that align with project goals
- Update Regularly: Maintain the accuracy of your inputs
- Use Clear Naming: Avoid ambiguity in KPI names
- Limit KPI Overload: Don’t track too many metrics; stay focused
- Visualize Trends: Use charts to identify patterns easily
- Back Up Data: Prevent data loss by saving your file frequently
❓ What Makes a Good Service Delivery KPI?
Not all KPIs are created equal. Here’s what to look for:
- Measurable: Must be quantifiable
- Actionable: Should guide decision-making
- Relevant: Tied to business or project goals
- Time-bound: Reflect performance over a period
Examples:
- % of projects delivered on time
- Number of service escalations
- Customer feedback score
How to Customize the Excel Dashboard
One of Excel’s biggest strengths is customization. Here are simple ways to tailor the dashboard:
- Add or remove KPIs based on project scope
- Modify the formulas to reflect your unique performance rules
- Change colors or chart styles for better branding
- Add filters or slicers for department-specific views
Who Can Use This Dashboard?
This dashboard is ideal for:
- Project Managers: To track team and client deliverables
- Team Leads: To monitor daily operations
- Consultants: To showcase performance to clients
- Executives: To review high-level project health
✅ Real-World Use Cases
Here’s how different teams can benefit:
▶ IT Project Teams
Monitor incidents resolved, response times, and SLA compliance.
▶ Marketing Teams
Track campaign delivery deadlines, quality of creatives, and feedback ratings.
▶ Operations Teams
Measure time-to-completion and bottlenecks across service requests.
Why This Excel Template Stands Out
Unlike basic spreadsheets, this template:
- Offers dynamic data updating
- Includes interactive dropdowns
- Displays monthly and yearly comparisons
- Has built-in conditional formatting
All of this helps you spend less time tracking and more time improving service delivery.
Conclusion
The Project Management Service Delivery KPI Dashboard in Excel is more than a template—it’s your command center. With real-time insights, clear visuals, and easy customization, you can take control of your projects like never before. Whether you’re handling internal operations or client-facing work, this tool empowers you to deliver excellence every single time.
Frequently Asked Questions (FAQs)
1. What are KPIs in service delivery?
Key Performance Indicators (KPIs) in service delivery help measure the effectiveness, timeliness, and quality of services delivered in a project.
2. Can I add more KPIs to this Excel dashboard?
Yes, the dashboard is fully customizable. You can add or remove KPIs as needed.
3. Do I need advanced Excel skills to use this template?
No. Basic Excel knowledge is enough to navigate and update the dashboard.
4. Is this template suitable for Agile project management?
Absolutely! You can track sprint-level KPIs like delivery rate, issue resolution time, and team velocity.
5. How often should I update the KPI data?
Ideally, you should update it monthly. However, for fast-paced projects, weekly updates may be better.
Click to Purchases Project Management Service Delivery KPI Dashboard in Excel
Visit our YouTube channel to learn step-by-step video tutorials