In today’s fast-moving business environment, managing your inventory and logistics efficiently is more important than ever. Whether you’re a manufacturer, retailer, or distributor, your success depends heavily on how well you track, analyze, and optimize your supply chain. Fortunately, you don’t need to invest in complex software to stay on top of your metrics. A Supply Chain and Logistics Inventory Management KPI Dashboard in Excel is a powerful and cost-effective solution that gives you the visibility you need — right at your fingertips.
In this article, we’ll dive deep into how this dashboard works, what makes it a must-have for operations professionals, and how you can implement it to improve performance, reduce costs, and make better decisions Supply Chain and Logistics Inventory Management KPI Dashboard.
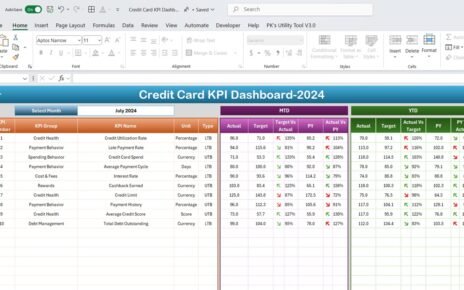
Click to Purchases Supply Chain and Logistics Inventory Management KPI Dashboard in Excel
What Is a Supply Chain and Logistics KPI Dashboard?
A Supply Chain and Logistics KPI Dashboard is a smart, interactive Excel tool designed to monitor key performance indicators (KPIs) across the entire inventory and logistics workflow. It allows businesses to track performance metrics like stock accuracy, order fulfillment rates, inventory turnover, and more — all in one place.
Unlike spreadsheets that just store data, this Excel dashboard visualizes your data dynamically. With dropdowns, charts, and automated calculations, you can instantly evaluate Month-to-Date (MTD), Year-to-Date (YTD), and Previous Year (PY) performance for all your KPIs.
What Makes This Excel Dashboard Unique?
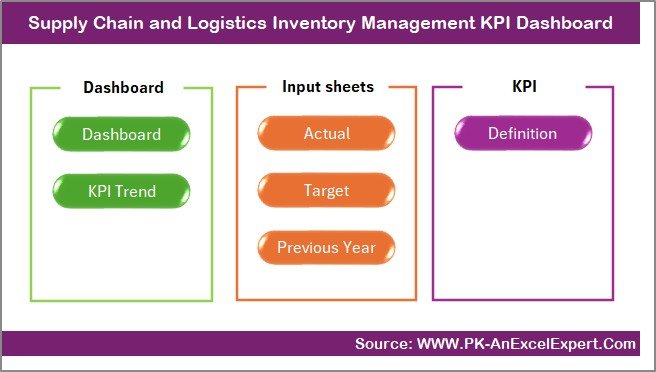
This is not a basic spreadsheet. It’s a ready-to-use dashboard built with functionality and automation in mind. It features seven interconnected worksheets that make tracking and analyzing your KPIs easy, fast, and visually appealing.
Let’s explore each worksheet included in the template:
Home Sheet – Your Navigation Hub
This is the control center of the dashboard. It contains six clickable buttons that take you directly to each of the key sheets — no need to scroll through multiple tabs. It’s designed for ease of use and helps you navigate like a pro.
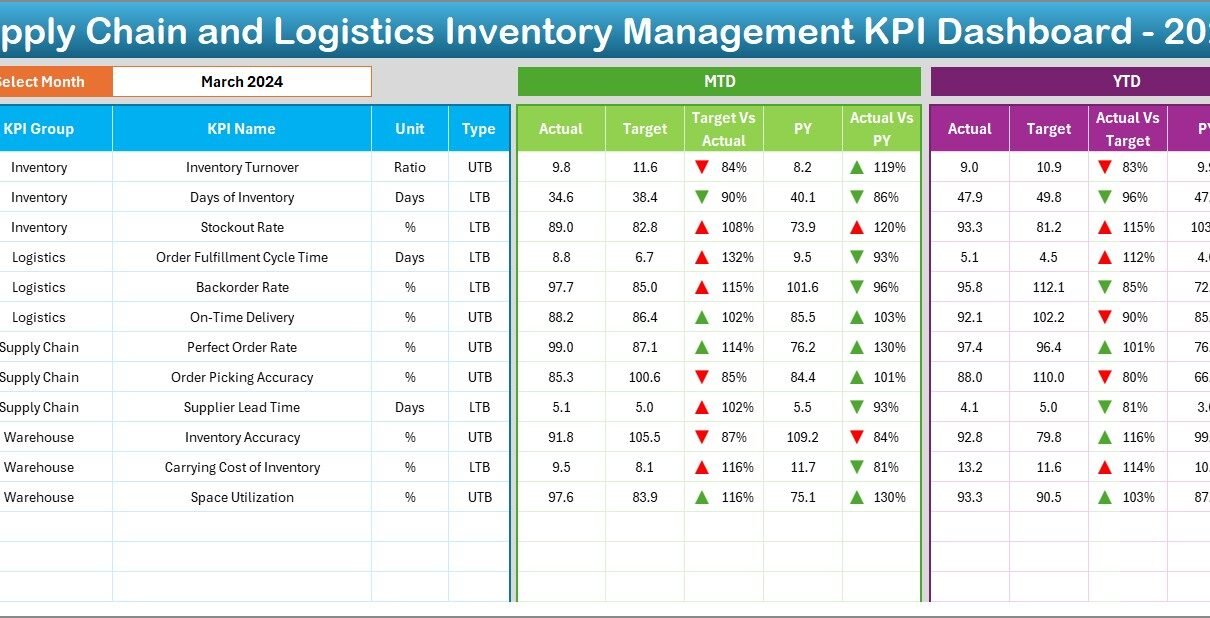
Dashboard Sheet – All KPIs in One Place
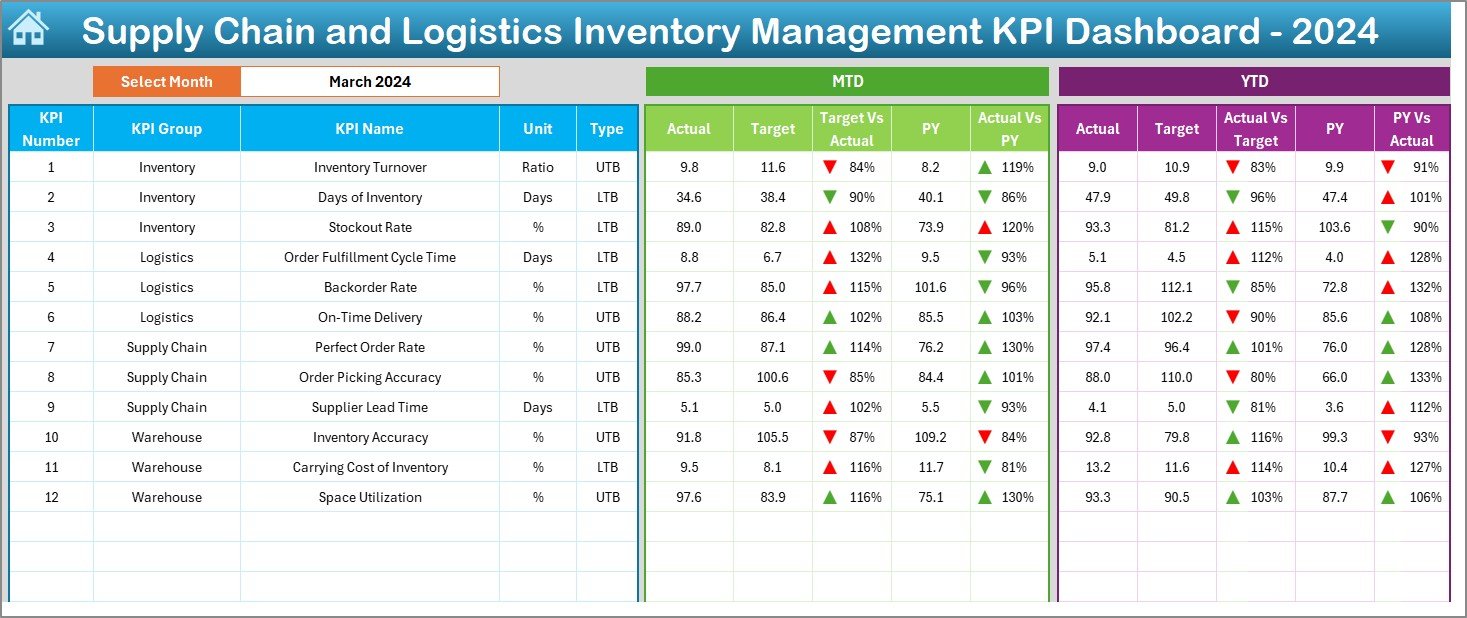
The Dashboard sheet is where the magic happens. From this sheet, you can:
-
Select any month from the dropdown (cell D3)
-
Instantly see the updated MTD and YTD values
-
Compare Actual vs. Target and Actual vs. Previous Year
-
Visual indicators show performance using conditional formatting with up/down arrows
You no longer need to manually update charts or tables. With one selection, the dashboard dynamically updates all numbers and visuals.
Click to Purchases Supply Chain and Logistics Inventory Management KPI Dashboard in Excel
KPI Trend Sheet – Visualize Your Progress
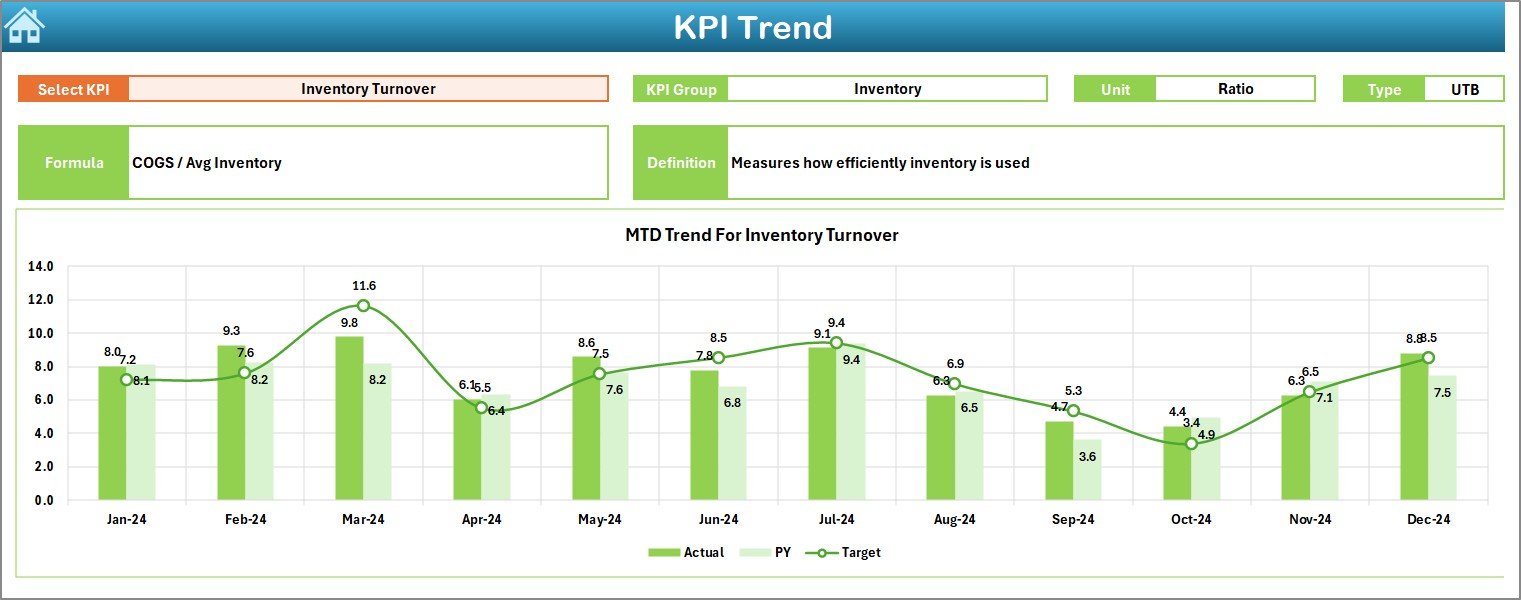
Want to focus on a specific KPI? Head to the KPI Trend sheet where:
-
You select a KPI from a dropdown (cell C3)
-
See detailed metadata like KPI Group, Unit, Type (LTB or UTB), Formula, and Definition
-
Get visual charts showing MTD and YTD trends for Actual, Target, and PY
This is perfect for deeper analysis when a KPI starts trending in the wrong direction.
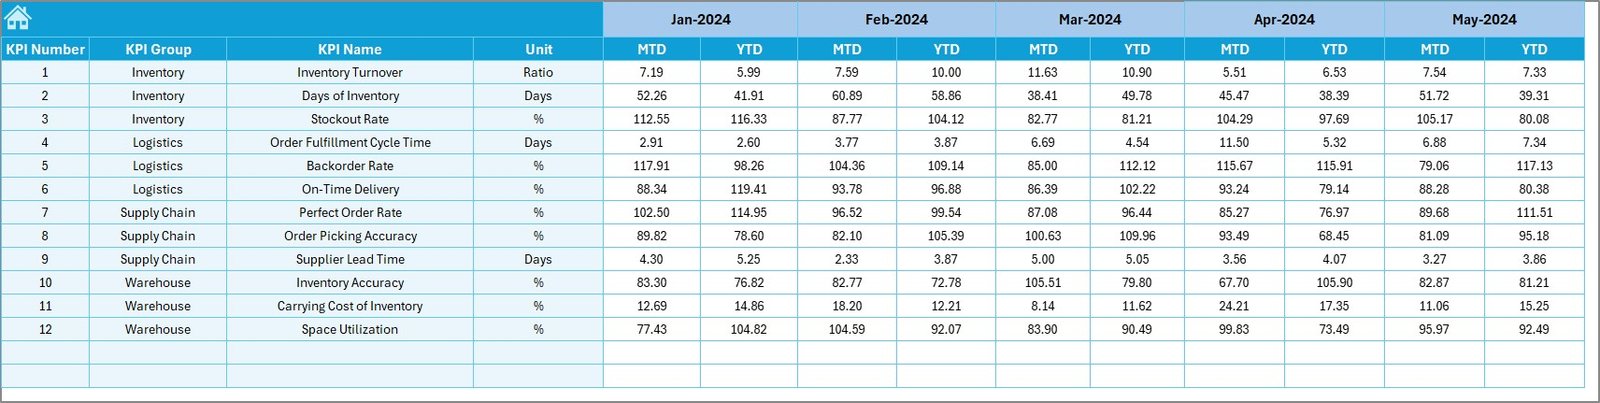
Actual Numbers Input Sheet – Update Your Real-Time Data
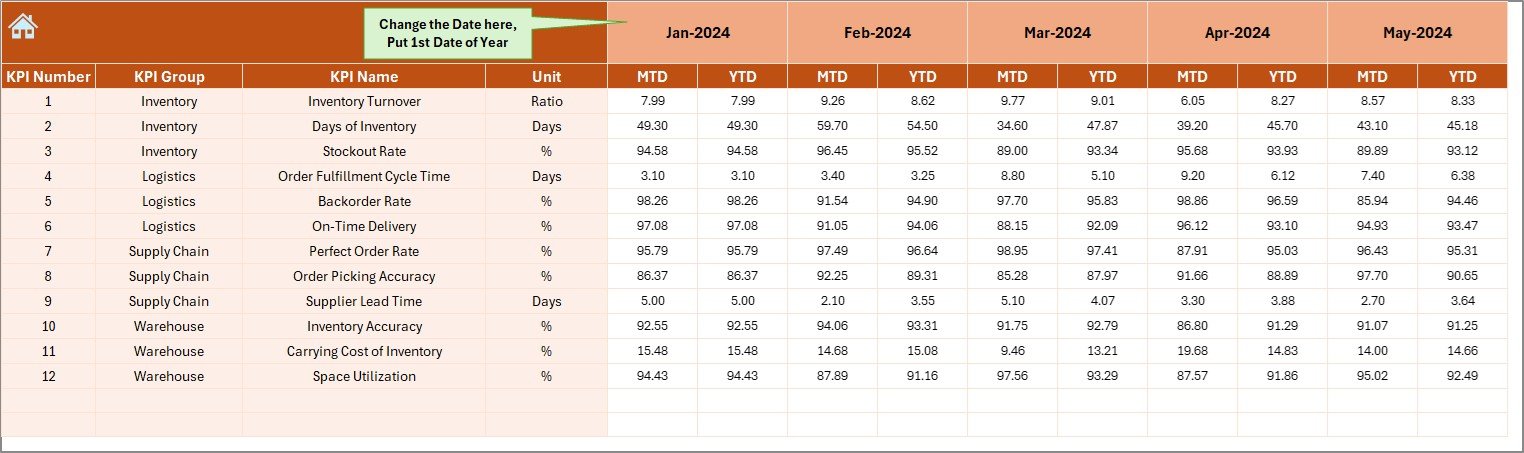
This is where you input actual performance data. It allows you to enter MTD and YTD values for each KPI, month by month. Set the starting month of your fiscal year at cell E1, and the rest of the sheet adjusts accordingly.
Simple. Smart. Effective.
Target Sheet – Set Your Goals
Here, you’ll enter target values for each KPI. This includes MTD and YTD targets, which will be automatically pulled into the dashboard for comparison.
The sheet is cleanly formatted and easy to update — ensuring your performance tracking is always aligned with your business goals.
Previous Year Sheet – Historical Benchmarking
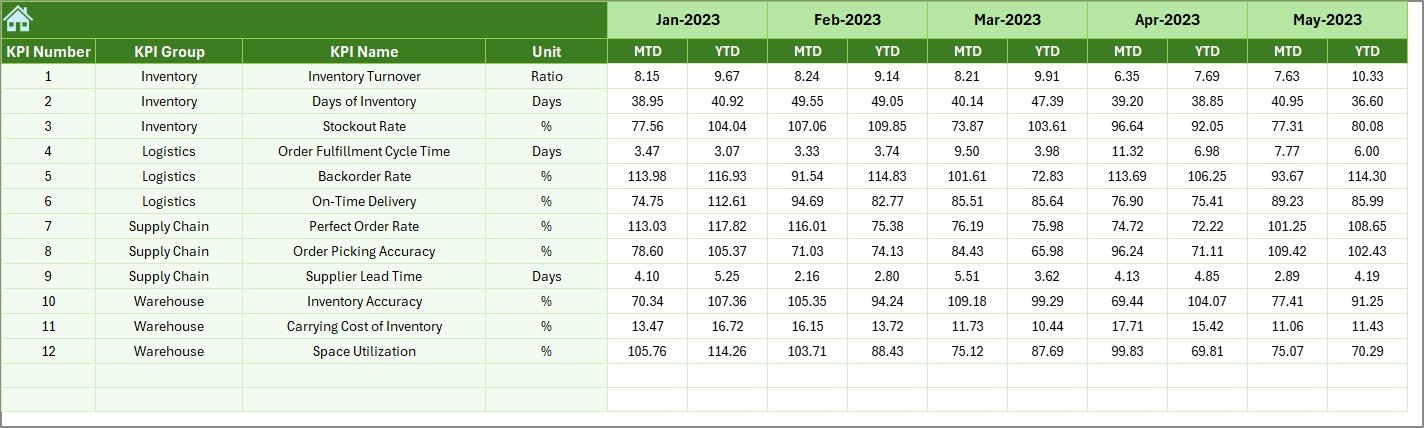
Tracking growth means knowing where you started. This tab lets you input last year’s numbers for each KPI. The dashboard uses these figures to compare against current performance, helping you spot improvement opportunities.
KPI Definition Sheet – Your KPI Encyclopedia
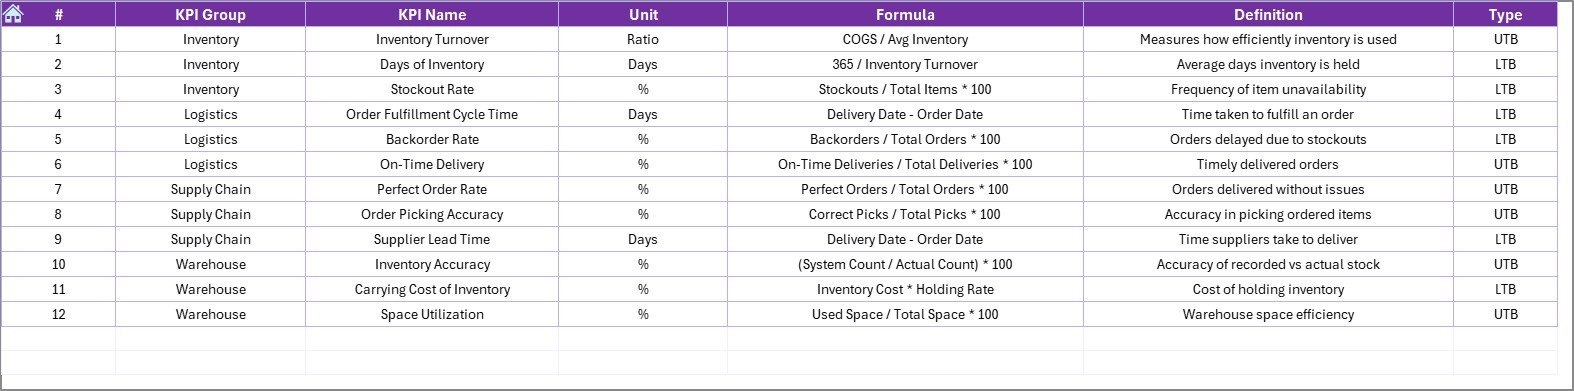
This tab is more than just documentation. It helps maintain clarity and consistency across your team by defining:
-
KPI Name
-
KPI Group
-
Unit
-
Formula
-
Brief Definition
-
KPI Type: UTB (Upper the Better) or LTB (Lower the Better)
No more confusion over how metrics are calculated or what they mean.
Click to Purchases Supply Chain and Logistics Inventory Management KPI Dashboard in Excel
Advantages of Using a Supply Chain and Logistics KPI Dashboard in Excel
Still wondering if this is the right tool for your team? Let’s look at the top advantages:
📌 Real-Time Decision Making
You don’t need to wait for monthly reports. Get immediate insights into your operations at any point in time.
📌 Improved Inventory Control
Monitor stock levels, reorder rates, and turnover ratios with ease. This helps reduce stockouts and overstocking.
📌 Cost Savings
By identifying inefficiencies in delivery, storage, and procurement, you can make cost-saving decisions faster.
📌 Customizable and Scalable
Add or remove KPIs, adjust timeframes, or even integrate with external data sources. The flexibility of Excel makes this tool easily adaptable.
📌 User-Friendly Interface
Even non-technical users can navigate, update, and analyze the dashboard with zero training.
Best Practices for Using This KPI Dashboard
To get the most out of this tool, follow these proven tips:
✔️ Keep Data Updated Regularly
Update actuals and targets each month. This ensures your dashboard always shows the latest performance snapshot.
✔️ Set Clear KPI Ownership
Assign specific KPIs to team members. This fosters accountability and ownership.
✔️ Use the Trends for Forecasting
Analyze MTD and YTD trends to predict future outcomes and take preemptive actions.
✔️ Review Definitions Periodically
Make sure all KPI definitions are still aligned with your evolving business objectives.
✔️ Avoid Data Overload
Track only the most relevant KPIs to keep the dashboard focused and actionable.
Who Can Use This Dashboard?
This template works great for various professionals and industries:
-
Supply Chain Managers tracking end-to-end performance
-
Inventory Analysts monitoring turnover and holding costs
-
Operations Teams optimizing order fulfillment and delivery timelines
-
Retailers wanting to minimize excess stock
-
Manufacturers seeking smoother inbound logistics
Sample KPIs Included
Here are just a few examples of KPIs you can manage with this Excel dashboard:
-
Inventory Turnover Ratio – UTB
-
Order Accuracy Rate – UTB
-
Backorder Rate – LTB
-
Stockout Frequency – LTB
-
On-Time Delivery Rate – UTB
-
Carrying Cost of Inventory – LTB
-
Average Order Processing Time – LTB
-
Cycle Time – LTB
-
Supplier Lead Time – LTB
-
Return Rate – LTB
-
Warehouse Space Utilization – UTB
-
Perfect Order Rate – UTB
Each of these KPIs includes the unit, formula, definition, and whether a higher or lower value is better — all organized within the dashboard.
Transition from Manual to Smart Analytics
Switching from manual spreadsheet reports to a dynamic Excel dashboard transforms how you work. It helps you:
-
Save time
-
Reduce human errors
-
Present data professionally
-
Align teams around performance goals
The dashboard is plug-and-play — just update the numbers, and you’re good to go.
Conclusion
Inventory and logistics are the backbone of any supply chain. Without proper visibility into KPIs, it’s easy to fall behind. However, with this Supply Chain and Logistics Inventory Management KPI Dashboard in Excel, you gain an all-in-one solution to track performance, set goals, and drive operational excellence.
Whether you’re a seasoned supply chain expert or just starting to organize your logistics better, this dashboard empowers you with the data and visuals you need to succeed.
So why wait? Download the Excel template, plug in your data, and start managing your inventory smarter today!
❓ Frequently Asked Questions (FAQs)
Q1: Can I customize the KPIs in the dashboard?
Yes. The dashboard is fully customizable. You can add, remove, or rename KPIs based on your business needs.
Q2: Do I need Excel VBA knowledge to use this?
Not at all. This dashboard works entirely on formulas and dropdowns — no coding or VBA is required.
Q3: How many months of data can I enter?
You can enter data for all 12 months of the year, including MTD and YTD values.
Q4: Is it suitable for small businesses?
Absolutely! It’s designed for both small and large businesses that want to track inventory and logistics performance in an organized way.
Q5: Can I track historical performance?
Yes. The dashboard includes a Previous Year sheet to help compare historical data and trends.
Q6: Is there any cost involved?
If you’re using your own version, there’s no cost. However, a ready-to-use professional template may be available for purchase from digital template providers.
Visit our YouTube channel to learn step-by-step video tutorials
Click to Purchases Supply Chain and Logistics Inventory Management KPI Dashboard in Excel
Watch the step-by-step video tutorial: