Managing supply chain and logistics operations effectively is crucial for any business. Yet, without the right tools, tracking the performance of those operations can feel overwhelming. That’s where the Supply Chain and Logistics Performance KPI Dashboard in Excel comes in. This powerful tool lets you visualize, track, and analyze key performance indicators (KPIs) to boost efficiency, reduce costs, and improve decision-making.
In this article, we’ll explore everything you need to know about this Excel-based dashboard—from features and benefits to best practices and common FAQs.
Click to Purchases Supply Chain and Logistics Performance KPI Dashboard in Excel
What is a Supply Chain and Logistics KPI Dashboard in Excel?
A KPI dashboard for supply chain and logistics is a ready-to-use Excel tool that helps businesses track the most important metrics related to supply chain performance. It shows trends, comparisons, and insights using interactive visuals like charts, arrows, and color-coded formatting.
The dashboard provides a monthly (MTD) and year-to-date (YTD) view of actual performance, targets, and comparisons with previous years—all in one place.
Key Components of the Dashboard
This Excel dashboard includes 7 structured worksheet tabs, each designed for specific functions:
Home Sheet

-
Acts as an index page.
-
Contains navigation buttons to jump to any key section of the dashboard.
-
User-friendly layout for seamless navigation.
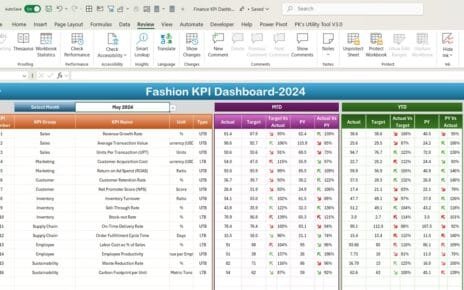
Dashboard Sheet

-
This is the main visualization area.
-
Choose the month using a drop-down menu in cell D3.
-
View data for:
-
MTD Actual vs Target vs Previous Year
-
YTD Actual vs Target vs Previous Year
-
-
Conditional formatting with arrows indicates performance trends (up/down).
-
Supports dynamic comparisons and real-time insights.
Click to Purchases Supply Chain and Logistics Performance KPI Dashboard in Excel
KPI Trend Sheet

-
Select a specific KPI from the drop-down in cell C3.
View KPI attributes like:
- Group
- Unit
- Formula
- Type (UTB or LTB)
-
Visual charts show MTD and YTD trends for Actual, Target, and Previous Year.
Actual Numbers Input Sheet

-
Input monthly actual data.
-
Easily change the first month using cell E1 to shift fiscal year starting point.
Target Sheet

-
Enter monthly targets for all KPIs (MTD and YTD).
-
Helps compare actual performance against set goals.
Click to Purchases Supply Chain and Logistics Performance KPI Dashboard in Excel
Previous Year Numbers Sheet

-
Input last year’s performance data for comparison.
KPI Definition Sheet

Maintain a list of KPI details:
- Name
- Group
- Unit
- Formula
- Definition
Advantages of the Supply Chain and Logistics KPI Dashboard
✅ Instant Overview of Key Metrics
Get a real-time view of critical supply chain performance indicators without digging through spreadsheets.
✅ Data-Driven Decisions
Make quick and accurate decisions based on monthly and year-to-date comparisons.
✅ Easy Customization
The dashboard is Excel-based—so it’s flexible, editable, and adaptable to your business needs.
✅ Trend Analysis Made Simple
Visualize performance trends and identify areas of concern before they become problems.
✅ All-In-One Solution
No need for multiple tools. You get actuals, targets, trends, and definitions all in one place.
Best Practices for Using the Dashboard
To get the most from your KPI dashboard, follow these best practices:
1. Keep KPI Definitions Clear
Use the KPI Definition Sheet to keep all formulas and definitions short and easy to understand.
2. Update Data Monthly
Regular updates to the Actual, Target, and Previous Year sheets ensure accuracy in reporting.
3. Use the Trend Chart Wisely
Always monitor MTD and YTD trend lines to spot negative trends early.
4. Highlight the Key KPIs
Focus on the most impactful KPIs for your operations—don’t overload your dashboard.
5. Train Team Members
Ensure your team knows how to use the dashboard. This boosts adoption and ensures consistent reporting.
❓ Frequently Asked Questions (FAQs)
Q1. Who can use this KPI dashboard?
Answer: This dashboard is ideal for supply chain managers, logistics teams, business analysts, and operations executives in any industry.
Q2. Can I customize the KPIs according to my business?
Answer: Yes! Since it’s in Excel, you can easily add, remove, or modify KPIs, units, and formulas based on your needs.
Q3. How often should I update the dashboard?
Answer: Ideally, update it monthly. You can also update it weekly if you’re tracking short-term metrics.
Q4. Does this dashboard require any advanced Excel skills?
Answer: No, it’s built for ease of use. Drop-downs, buttons, and simple input areas make it beginner-friendly.
Q5. Is the dashboard visually appealing and printable?
Answer: Absolutely! It uses clean formatting, dynamic charts, and conditional visuals—plus, it’s easy to print or export to PDF for reporting.
Conclusion
If you want to keep your supply chain efficient and performance-focused, the Supply Chain and Logistics Performance KPI Dashboard in Excel is your go-to tool. It transforms complex data into clear visuals and trends—helping you stay one step ahead. Whether you’re spotting delays, tracking delivery metrics, or comparing yearly targets, this dashboard brings clarity and actionability to your operations.
Visit our YouTube channel to learn step-by-step video tutorials
Click to Purchases Supply Chain and Logistics Performance KPI Dashboard in Excel
Watch the step-by-step video tutorial: