Managing logistics and supply chain costs is not just about cutting expenses—it’s about optimizing processes and improving profitability. That’s why using a Supply Chain and Logistics Cost Efficiency KPI Dashboard in Excel can be a game-changer for operations teams. Whether you’re a logistics analyst or a supply chain manager, this ready-to-use Excel tool simplifies cost tracking, streamlines reporting, and enhances decision-making—all in one place.
Click to Purchases Supply Chain and Logistics Cost Efficiency KPI Dashboard in Excel
What is the Supply Chain and Logistics Cost Efficiency KPI Dashboard?
This dashboard is a fully automated Excel-based solution that helps track cost-related KPIs across logistics and supply chain functions. It provides visibility into monthly (MTD) and year-to-date (YTD) performance, enabling businesses to analyze trends, compare actual performance against targets, and drive cost-saving decisions.
The dashboard is divided into seven user-friendly worksheet tabs, each with a unique purpose to streamline data handling and reporting.
Key Features of the KPI Dashboard
Home Sheet – Easy Navigation

The home sheet acts as a quick-access index with 6 clickable buttons that allow users to jump directly to their desired worksheet.
Dashboard Sheet – Central Overview

This is the primary view for monitoring KPIs. On cell D3, you can select the desired month from a dropdown, and the entire dashboard updates dynamically. It displays:
-
MTD Actual, Target, and Previous Year values
-
Target vs. Actual with conditional formatting (up/down arrows)
-
PY vs. Actual for quick performance benchmarking
-
YTD metrics with similar visual comparisons
KPI Trend Sheet – Deep Dive into Trends

Use this sheet to analyze KPI trends in depth. Select any KPI from the dropdown in cell C3 to view:
-
KPI details (Group, Unit, Type, Formula, Definition)
-
MTD and YTD trend charts comparing Actual, Target, and Previous Year values
Click to Purchases Supply Chain and Logistics Cost Efficiency KPI Dashboard in Excel
Actual Numbers Input Sheet – Simple Data Entry
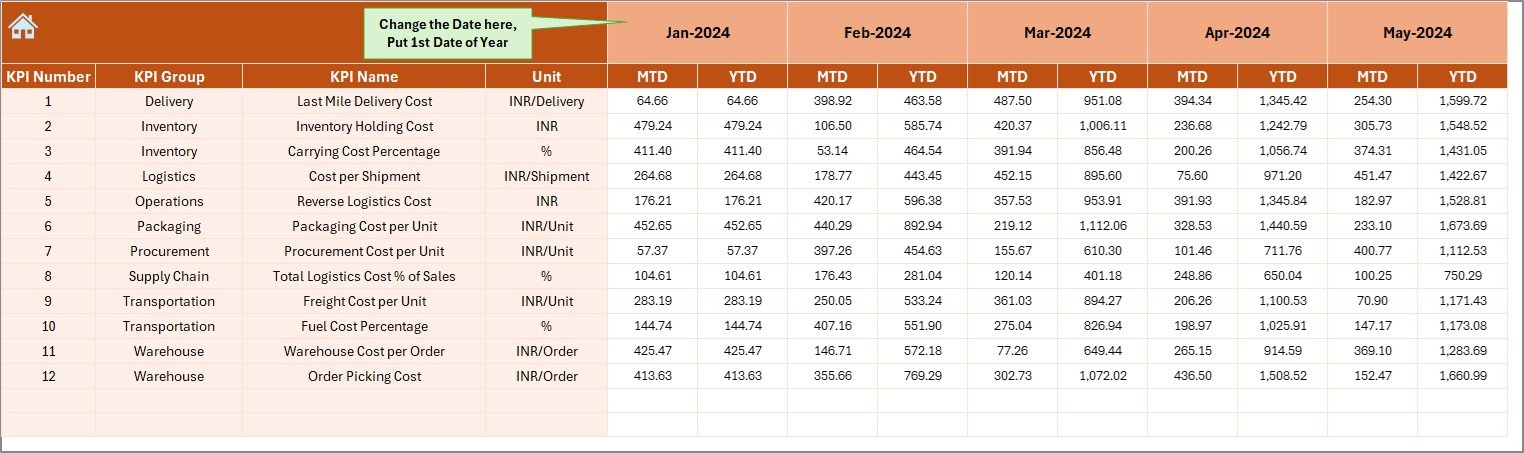
Easily input actual KPI values for each month. Just update the first month of the year in cell E1, and the rest of the sheet adjusts accordingly.
Target Sheet – Define Your Goals

Set monthly and yearly targets for each KPI. The dashboard will compare these against actual performance automatically.
Previous Year Sheet – Historical Context

Record previous year’s numbers in the same format as current data. This supports accurate year-over-year analysis.
KPI Definition Sheet – Maintain Consistency

List all KPIs here with their group, unit, formula, and a short definition. This ensures everyone on your team uses metrics consistently.
Advantages of the Supply Chain and Logistics Cost Efficiency KPI Dashboard
📉 Reduce Operational Costs
By tracking detailed cost KPIs, you can identify inefficiencies and reduce waste without compromising service quality.
📊 Enhance Decision-Making
The dashboard’s visuals and conditional formatting make it easier to interpret complex data and act quickly.
🔁 Monitor Trends Over Time
Monthly and yearly trend analysis helps detect patterns and anticipate challenges before they escalate.
📥 Ready-to-Use and Fully Customizable
Save time with a pre-built dashboard, yet enjoy the flexibility to tweak formulas, layouts, and KPI definitions to fit your business.
Best Practices for Using the Dashboard Effectively
-
Update Data Monthly – Ensure actual and target numbers are entered each month for accurate results.
-
Review Trends Regularly – Use the KPI Trend sheet to watch for dips or spikes that could indicate larger issues.
-
Use Color Codes – Rely on the built-in conditional formatting (arrows and color codes) to assess performance at a glance.
-
Collaborate Across Teams – Involve procurement, warehousing, and logistics teams when setting targets for better alignment.
-
Back Up Historical Data – Keep copies of past performance files to review long-term trends and seasonal patterns.
Frequently Asked Questions (FAQs)
Q1: What are some examples of KPIs tracked in this dashboard?
A: Examples include Transportation Cost per Unit, Warehousing Cost per Order, Inventory Turnover Ratio, Freight Cost % of Sales, and more. These help monitor efficiency and cost performance.
Q2: Can I add new KPIs or modify existing ones?
A: Absolutely! The KPI Definition Sheet is fully editable. You can add or remove KPIs and the dashboard will reflect the changes accordingly.
Q3: Do I need advanced Excel skills to use this dashboard?
A: No, you don’t! It’s designed to be beginner-friendly with dropdowns, pre-set formulas, and clear instructions.
Q4: How can this help reduce logistics costs?
A: By consistently tracking and comparing cost KPIs, you can pinpoint cost overruns, optimize delivery routes, manage warehousing costs, and streamline overall logistics performance.
Q5: Is this dashboard suitable for small businesses?
A: Yes, it’s scalable and flexible enough for both small businesses and large enterprises. You can start simple and expand as your needs grow.
Conclusion
If you’re serious about making your supply chain more cost-efficient and data-driven, the Supply Chain and Logistics Cost Efficiency KPI Dashboard in Excel is the tool you need. It’s simple, effective, and powerful—giving you the insights that matter when every dollar counts.
Visit our YouTube channel to learn step-by-step video tutorials
Click to Purchases Supply Chain and Logistics Cost Efficiency KPI Dashboard in Excel