In today’s eco-conscious world, businesses are not just judged by their profits but also by their environmental impact and sustainability practices. Customers are more inclined to engage with brands that care about the planet. This shift in consumer mindset calls for a data-driven approach to measuring customer engagement in environmental and sustainability initiatives.
That’s where an Environmental and Sustainability Customer Engagement KPI Dashboard in Excel becomes essential. This tool helps you track, measure, and improve how effectively your organization engages customers on sustainability efforts.
Click to Purchases Environmental and Sustainability Customer Engagement KPI Dashboard in Excel
What Is an Environmental and Sustainability Customer Engagement KPI Dashboard?
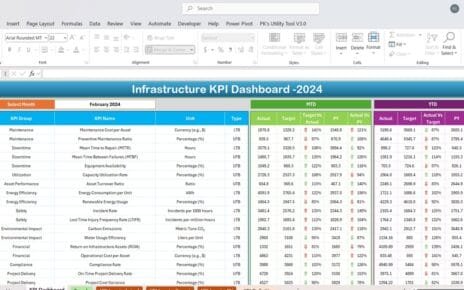
An Environmental and Sustainability Customer Engagement KPI Dashboard is a dynamic Excel-based tool that helps you monitor key performance indicators (KPIs) related to how your customers interact with your green and eco-friendly programs.
It tracks metrics like:
-
Participation in recycling programs
-
Customer awareness about green practices
-
Feedback on sustainability policies
-
Year-over-year improvements
-
Progress toward green goals
This dashboard turns raw data into interactive visuals, trends, and insights that enable timely decisions and continuous improvements.
Key Features of the Excel-Based Dashboard
This dashboard template is built in Microsoft Excel and includes 7 interconnected worksheet tabs. Each one plays a vital role in tracking and analyzing data efficiently.
Home Sheet
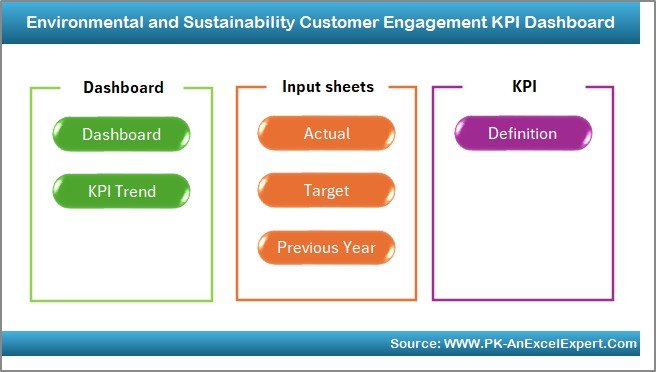
This is your navigation hub. It includes six clickable buttons:
-
Dashboard
-
KPI Trend
-
Actual Numbers Input
-
Target
-
Previous Year Numbers
-
KPI Definition
These buttons save time and ensure smooth movement between sheets.
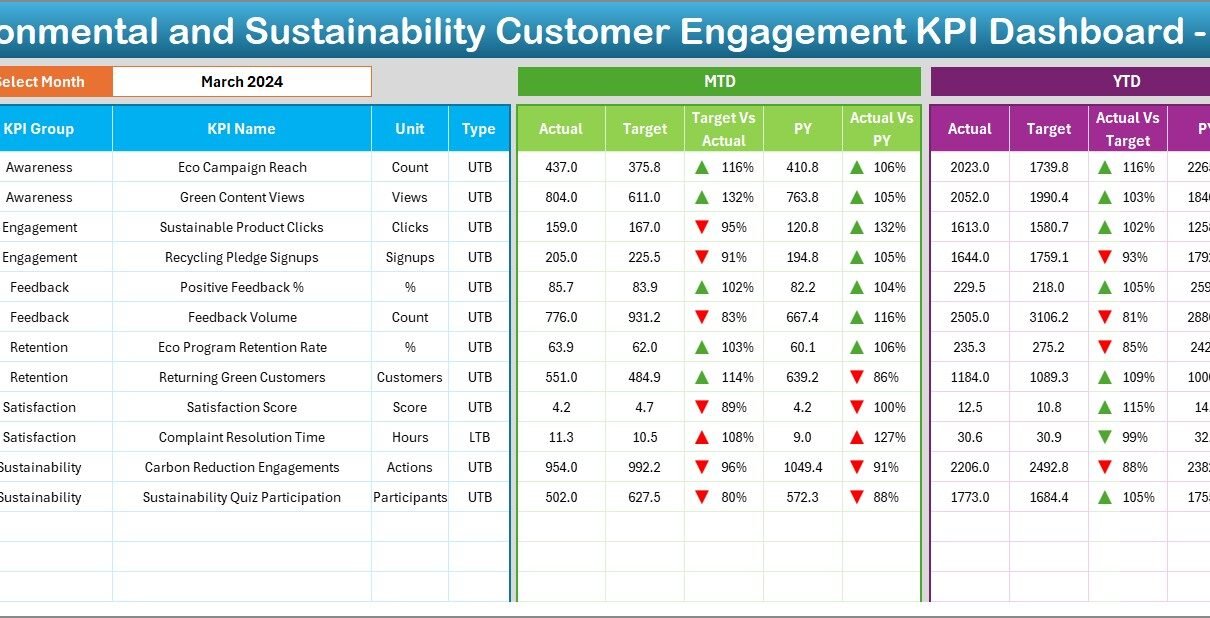
Dashboard Sheet
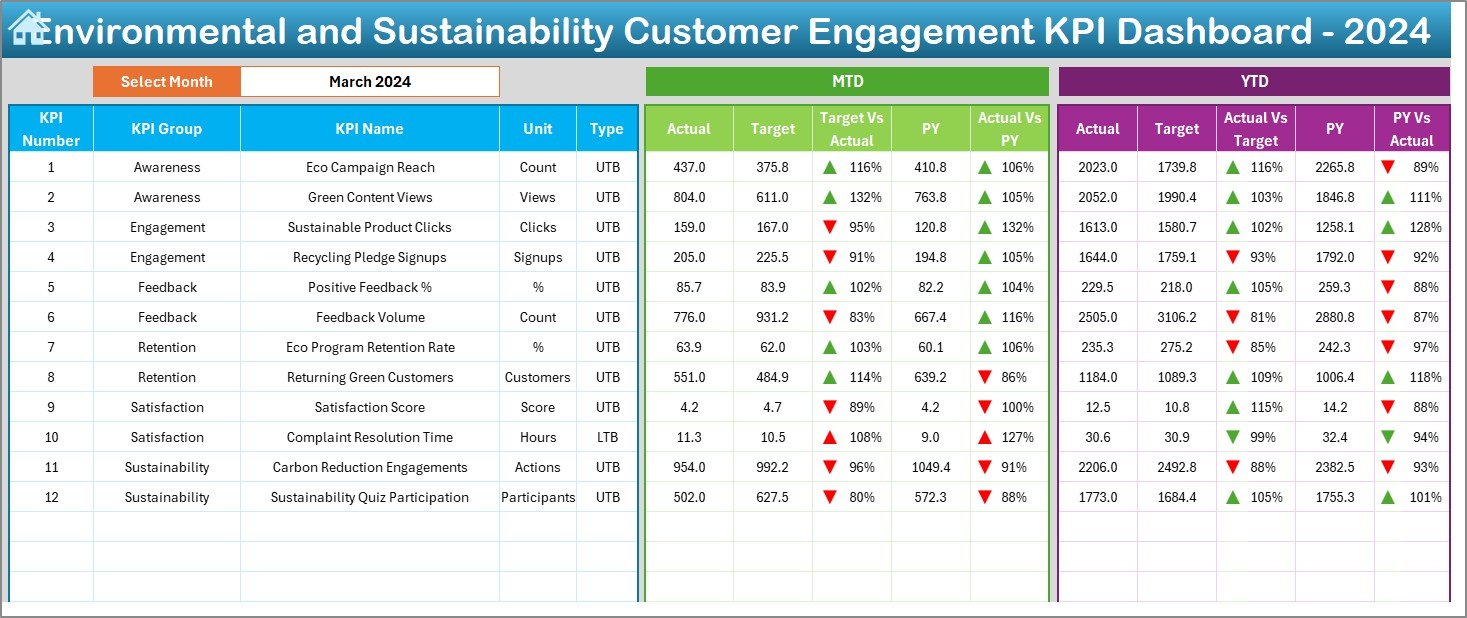
This is the main analytical view of the dashboard. On this page:
-
Select a month from the drop-down menu in cell D3.
Instantly view:
- MTD (Month to Date): Actual, Target, Previous Year, along with comparison using arrows.
- YTD (Year to Date): Actual, Target, Previous Year, including comparative indicators.
Conditional formatting highlights whether KPIs have improved or declined using up/down arrows, making it highly visual and intuitive.
KPI Trend Sheet
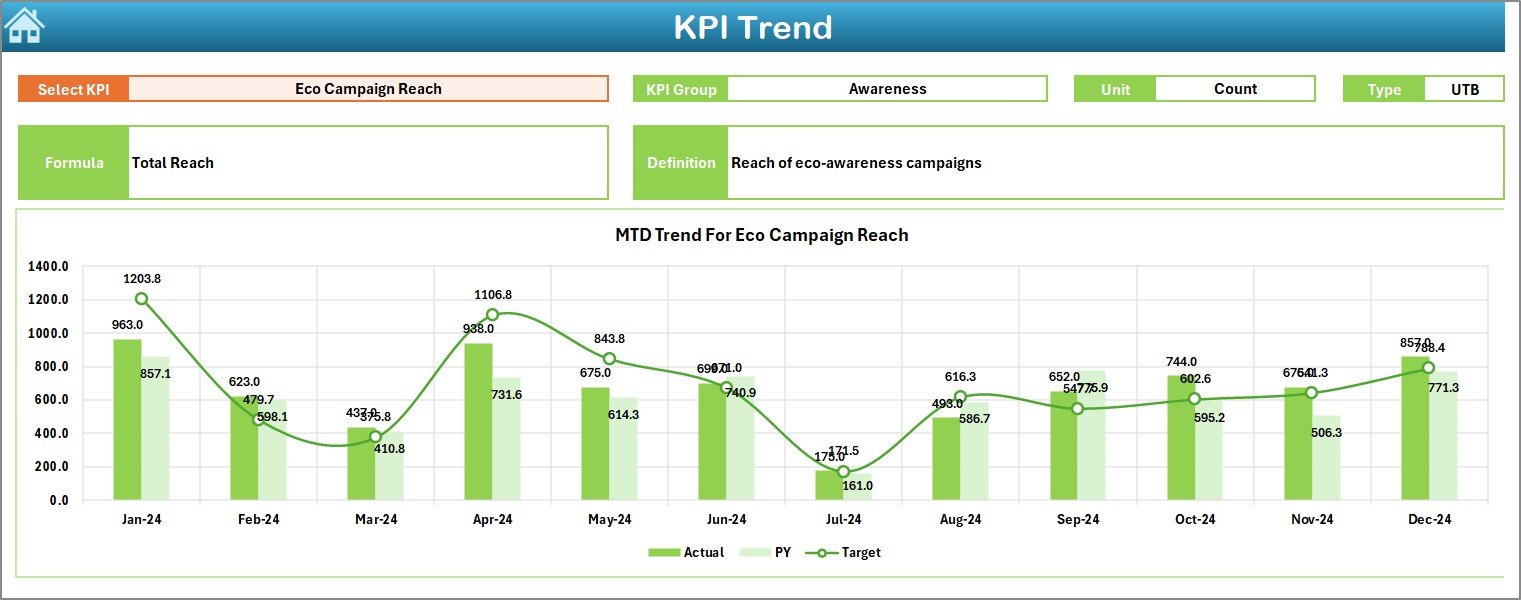
This page allows you to:
-
Choose a KPI from the drop-down in cell C3.
View detailed insights:
- KPI Group, Unit, Formula, Definition
- Whether the KPI is “Lower the Better” or “Upper the Better”
-
Analyze MTD and YTD trends using built-in charts.
This helps identify patterns and long-term shifts, which are crucial for strategy planning.
Actual Numbers Input Sheet
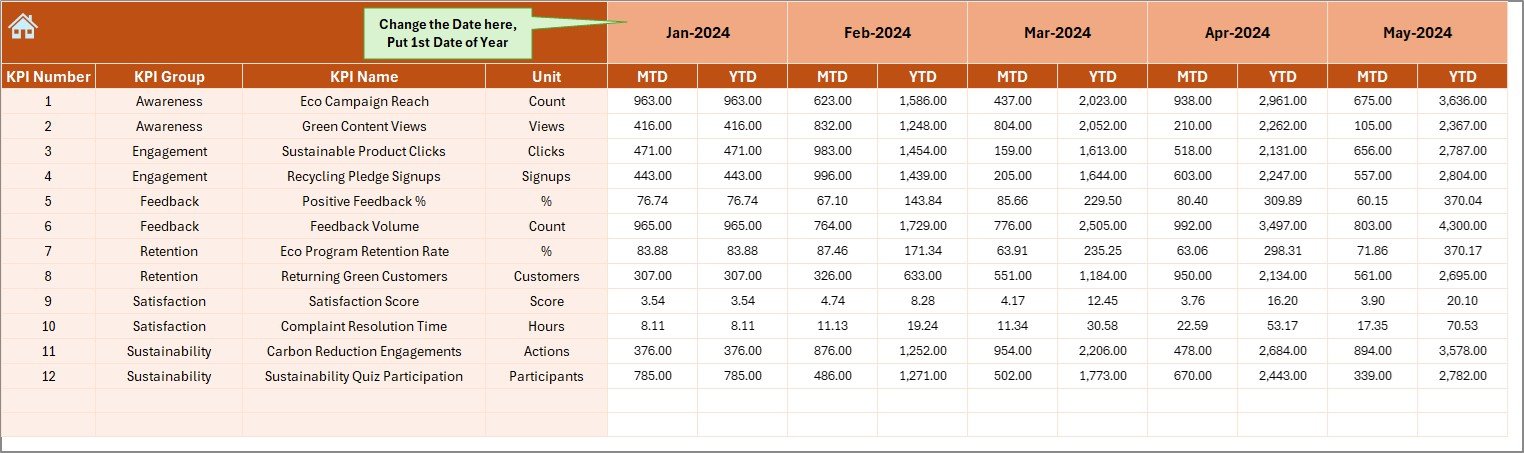
-
Input actual KPI performance data month by month.
-
Easily adjust the timeline by changing the first month of the year in cell E1.
-
Supports consistent and standardized data entry across all metrics.
Click to Purchases Environmental and Sustainability Customer Engagement KPI Dashboard in Excel
Target Sheet
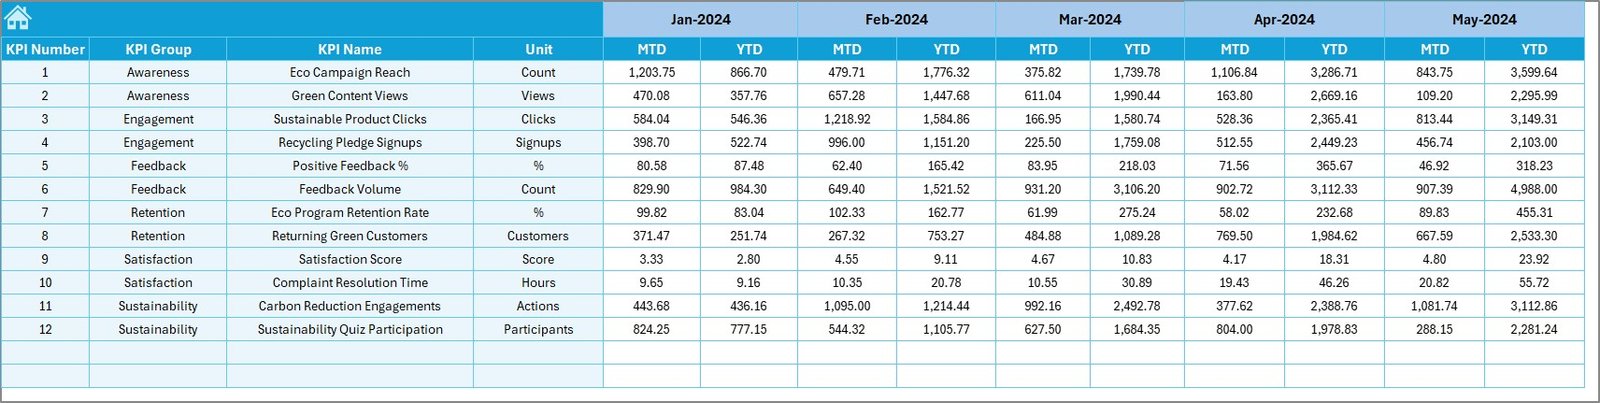
Here you define your sustainability engagement targets:
-
Set monthly MTD and YTD values for each KPI.
-
Ensure alignment with internal goals or industry benchmarks.
Previous Year Numbers Sheet
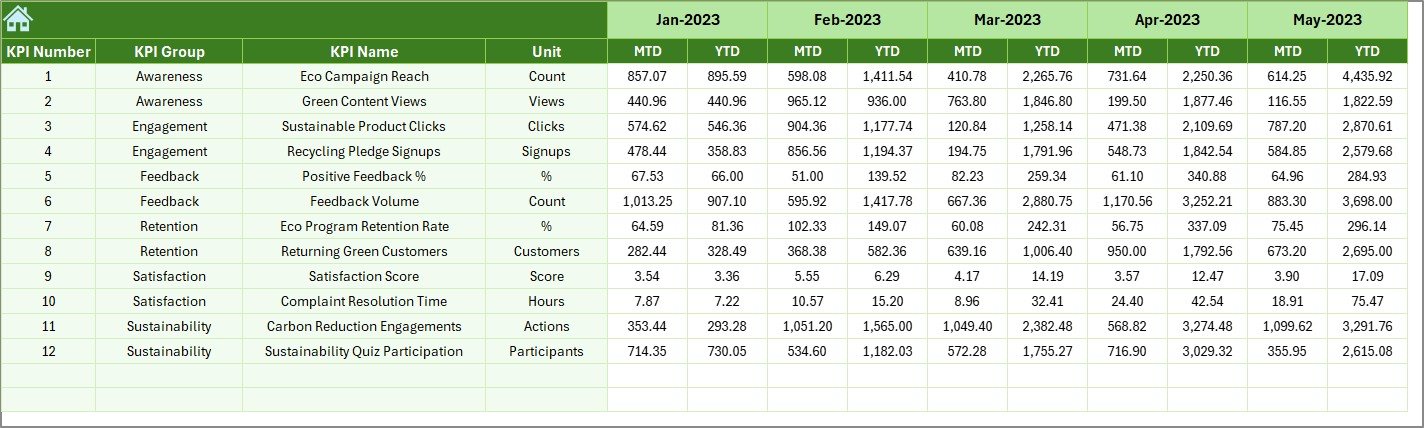
For accurate comparison:
-
Enter last year’s KPI values.
-
Compare historical performance with current data.
KPI Definition Sheet
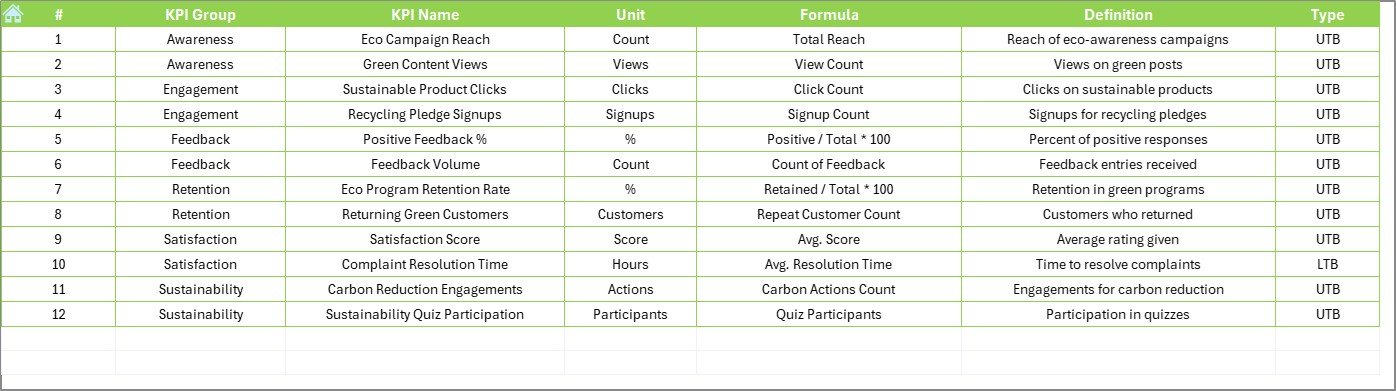
This is your KPI knowledge base:
-
Store each KPI’s Name, Group, Unit, Formula, and concise Definition.
-
Reference anytime to understand what each KPI means and how it’s calculated.
Advantages of Using This Excel Dashboard
Implementing this dashboard offers numerous benefits:
✅ Centralized Data Management: All KPI data in one place.
📊 Real-Time Analysis: Change the month and instantly update results.
🔁 Historical Comparison: Evaluate year-over-year sustainability efforts.
📈 Trend Visualization: Spot engagement changes quickly.
💼 Improved Decision-Making: Backed by real metrics.
🧩 Customizable: Add or modify KPIs to suit your industry.
Important KPIs to Track for Environmental and Sustainability Engagement
Click to Purchases Environmental and Sustainability Customer Engagement KPI Dashboard in Excel
Here are some critical KPIs that this dashboard can track:
♻️ Customer Recycling Participation Rate
🌿 Green Product Purchase Ratio
📝 Sustainability Survey Response Rate
📢 Engagement in Eco-Campaigns
📉 Carbon Footprint Per Customer Interaction
🕒 Time to Respond to Eco-Feedback
💬 Customer Sentiment on Sustainability
🔁 Year-on-Year Green Initiative Retention
📈 Increase in Sustainable Subscriptions
🌍 Average Sustainability Awareness Score
Each KPI helps measure both customer behavior and brand impact.
Best Practices for Using the Dashboard Effectively
To ensure accurate results and sustainable growth, follow these tips:
✅ Regularly update actuals to reflect real-time engagement.
🎯 Set SMART targets (Specific, Measurable, Achievable, Relevant, Time-bound).
📉 Use trend charts to spot positive or negative patterns early.
📥 Gather feedback from customers and integrate it into the KPIs.
🔍 Revisit KPI definitions quarterly to keep them relevant.
📂 Back up your data monthly to avoid loss.
📊 Compare with industry benchmarks for perspective.
How This Dashboard Supports Sustainability Strategy
This Excel dashboard serves as a bridge between vision and performance. It provides:
-
A quantitative measure of how well your sustainability message resonates.
-
Insight into which programs attract the most attention.
-
A clear roadmap for future customer engagement improvements.
This tool doesn’t just track—it drives continuous improvement.
Opportunities for Improvement in Dashboard Usage
While the dashboard is powerful, there are areas for enhancement:
🔄 Automate data import from external sources like CRM or survey tools.
🎨 Add data visualizations using PivotCharts for more clarity.
⏱️ Improve data entry speed using form controls or VBA-based input forms.
📈 Segment engagement data by demographics for deeper insights.
🧠 Incorporate AI models to predict future engagement patterns.
Who Should Use This Dashboard?
This dashboard is ideal for:
🏢 Sustainability teams
📢 Marketing departments
🧑💼 CSR managers
🌱 Green product managers
📊 Data analysts focusing on customer behavior
Any professional responsible for aligning business practices with environmental goals will benefit from this dashboard.
What Makes This Dashboard Different?
Unlike generic KPI dashboards, this one is:
🎯 Tailored specifically for sustainability engagement
✅ Pre-structured with dropdowns and formulas
🔄 Easy to update monthly
📈 Built with both operational and strategic insights in mind
💡 Designed to enhance transparency and accountability
Integration With Other Tools
Although built in Excel, you can easily integrate it with:
📥 Power BI for more visual dashboards
📤 Google Sheets for cloud-based collaboration
📊 Tableau for advanced analytics
🔁 Microsoft Teams or Slack for updates and alerts
This gives you flexibility in how you manage and report your sustainability KPIs.
Conclusion: Take Control of Your Green Engagement Goals
Customer engagement is the beating heart of sustainability success. If your audience doesn’t understand or support your green goals, progress will stall. With this Environmental and Sustainability Customer Engagement KPI Dashboard, you empower your team to track, analyze, and optimize performance with precision.
Using this template, you’re not just reporting numbers—you’re shaping a greener future with every data point.
Frequently Asked Questions (FAQs)
1. What is the main benefit of this dashboard?
It helps organizations measure how effectively customers engage with environmental and sustainability programs and track performance across time.
2. Can I customize the KPIs?
Yes, the KPI Definition sheet lets you add or modify KPIs, formulas, and descriptions easily.
3. Is this dashboard beginner-friendly?
Absolutely. It uses drop-downs, pre-linked sheets, and simple formatting that even non-technical users can manage.
4. Can I use this dashboard for other departments?
Yes, with small changes, it can track employee engagement, supplier sustainability, or even community outreach.
5. How often should I update the data?
Monthly updates are recommended to get the most accurate Month-to-Date (MTD) and Year-to-Date (YTD) insights.
6. Does it support automated data pulling?
By default, it’s manual, but you can integrate Power Query or VBA to automate data imports from CRM or databases.
Visit our YouTube channel to learn step-by-step video tutorials