In today’s world, environmental responsibility is no longer optional—it’s essential. As organizations strive to minimize their ecological footprint, there’s a growing demand for effective tools that help track and manage sustainability performance. One such powerful solution is the Environmental and Sustainability Service Delivery KPI Dashboard in Excel.
This dashboard template is not just a data tool—it’s a roadmap toward eco-conscious service delivery. Whether you’re managing facilities, energy, or environmental programs, this Excel-based KPI dashboard helps monitor key sustainability indicators, improve performance, and ensure compliance.
Click to Purchases Environmental and Sustainability Service Delivery KPI Dashboard in Excel
What Is the Environmental and Sustainability Service Delivery KPI Dashboard in Excel?
The Environmental and Sustainability Service Delivery KPI Dashboard in Excel is a comprehensive, ready-to-use template designed to monitor your service delivery metrics that impact environmental sustainability.
Built using simple Excel formulas, data validation, and conditional formatting, this tool allows businesses and public sector organizations to:
-
Track monthly and yearly sustainability KPIs
-
Compare actual performance against targets and previous years
-
Visualize trends over time
-
Ensure consistent data entry with structured input forms
The dashboard simplifies how sustainability data is reported, analyzed, and shared.
Key Features of the Dashboard
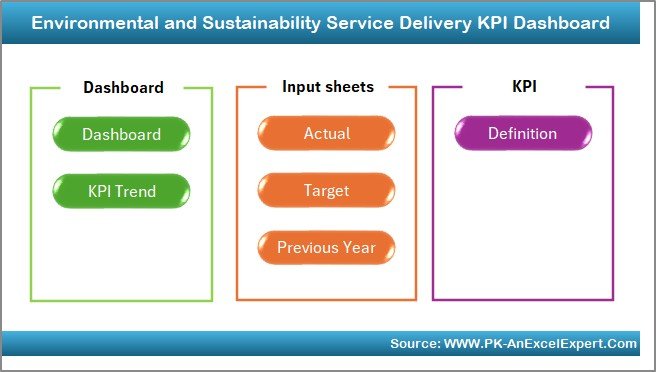
The dashboard includes 7 interactive worksheet tabs, each serving a distinct purpose to make environmental performance tracking seamless:
Home Sheet (Index Page)
-
A control center with 6 clickable buttons to navigate to different sheets.
-
Acts as the dashboard’s table of contents.
-
Simple and user-friendly navigation for quick access to key functions.
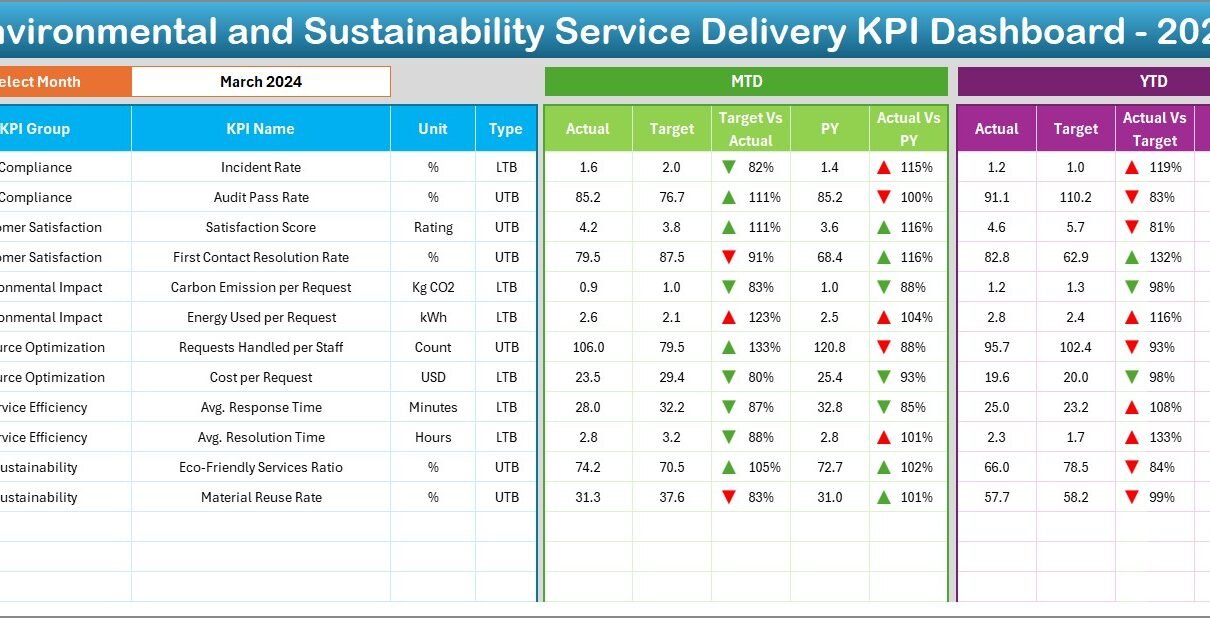
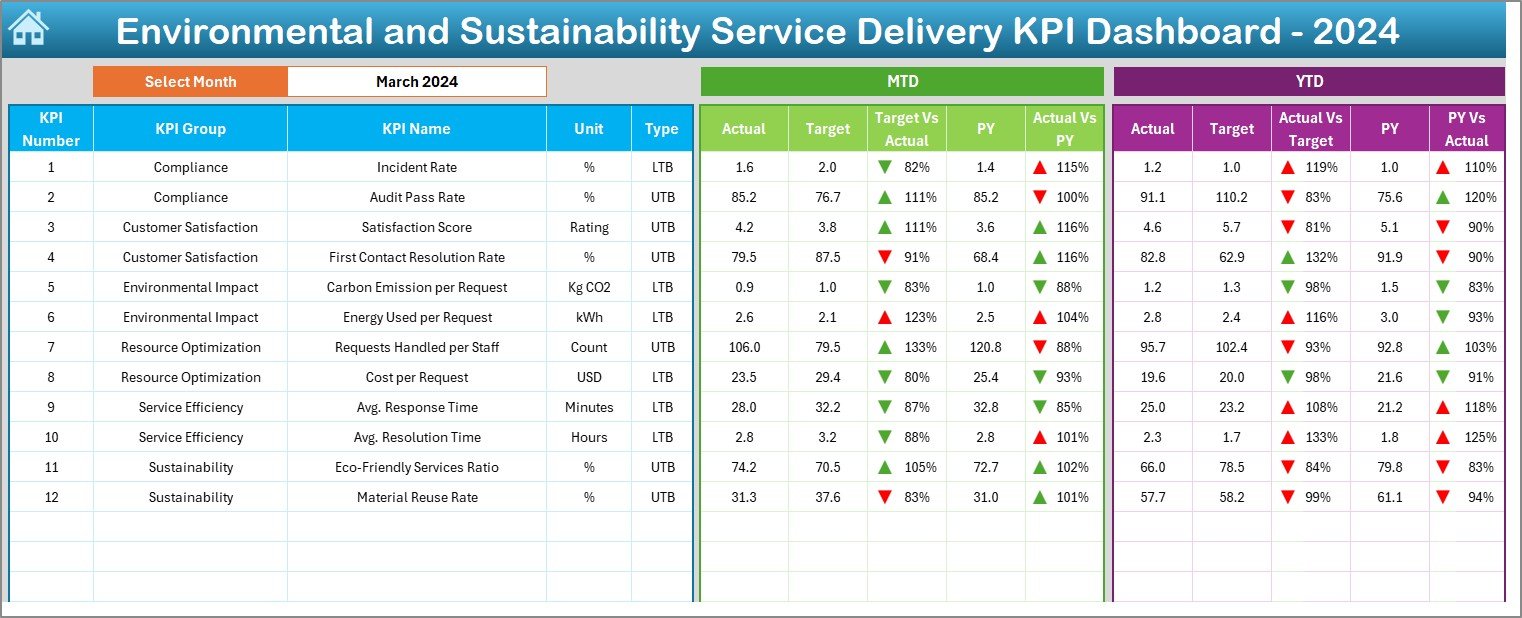
Dashboard Sheet
-
This is the main visual interface.
-
A dropdown at cell D3 lets you select the month to view relevant performance.
Displays both:
- MTD (Month-to-Date) actual, target, and previous year values
- YTD (Year-to-Date) actual, target, and previous year values
-
Visual performance indicators (with arrows) show if you’re improving or falling behind.
-
Enables instant snapshot comparisons of current progress vs. benchmarks.
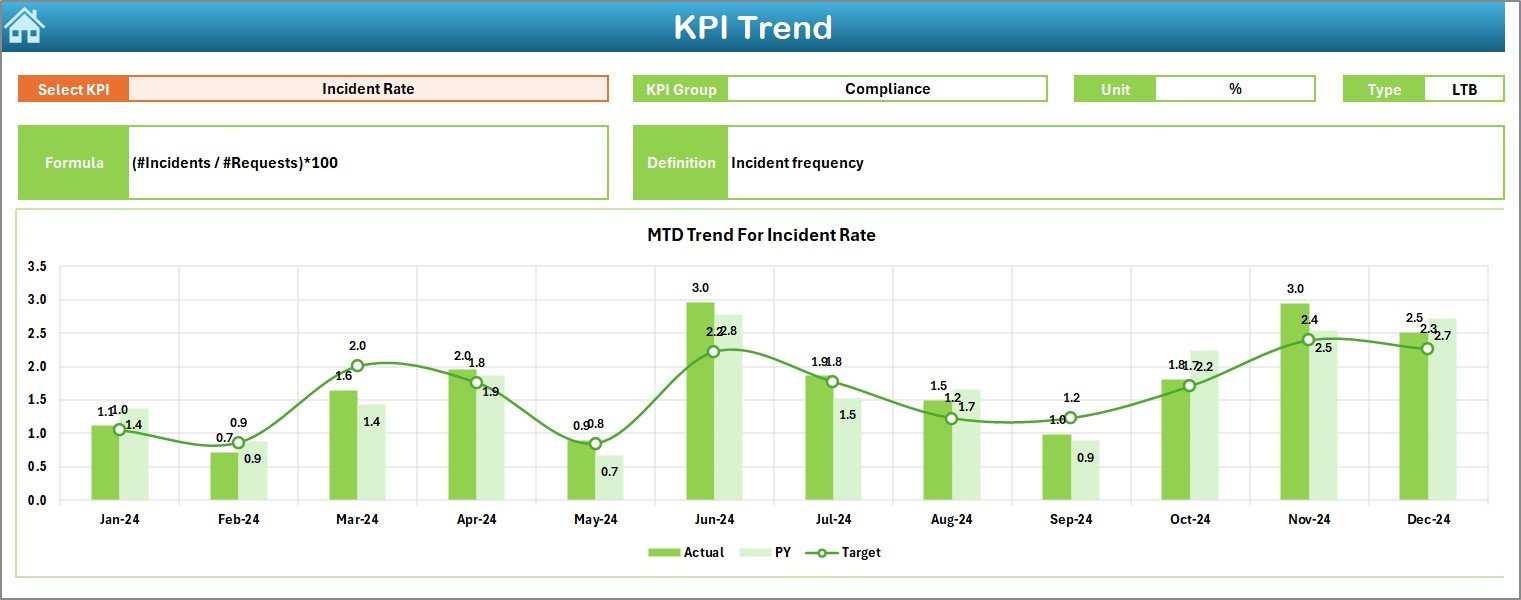
KPI Trend Sheet
-
Select any KPI using the dropdown in cell C3.
Displays KPI metadata:
- KPI Group
- Unit of Measurement
- Type (UTB: Upper the Better or LTB: Lower the Better)
- Formula and Definition
Dual trend charts display MTD and YTD changes:
- Actual vs. Target
- Actual vs. Previous Year
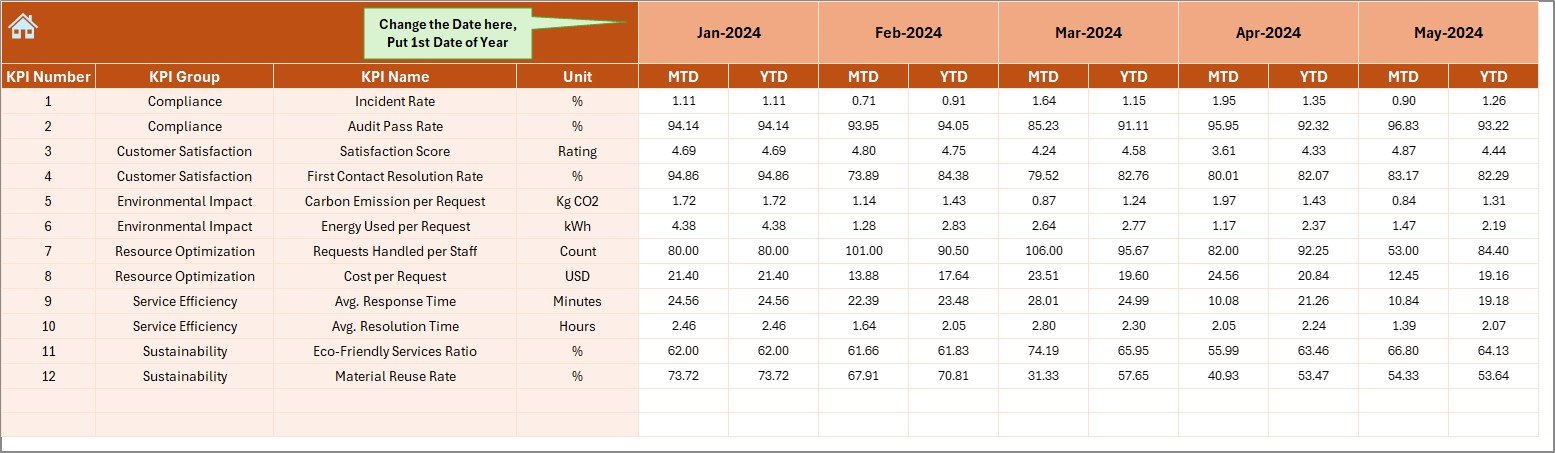
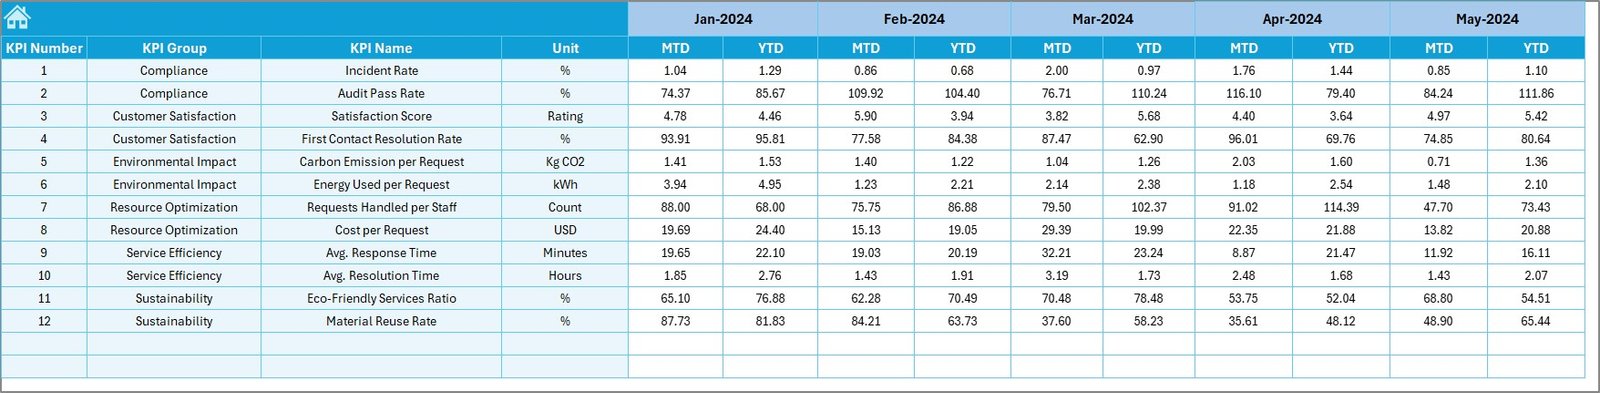
Actual Numbers Input Sheet
-
User-friendly interface to enter monthly MTD and YTD actuals.
-
Start by selecting the first month in cell E1.
-
Ensures accuracy and standardization of actual performance data.
Target Sheet
-
Here, you input monthly performance targets for each KPI.
-
Both MTD and YTD targets are managed.
-
Acts as a benchmark layer to compare actuals against.
Previous Year Number Sheet
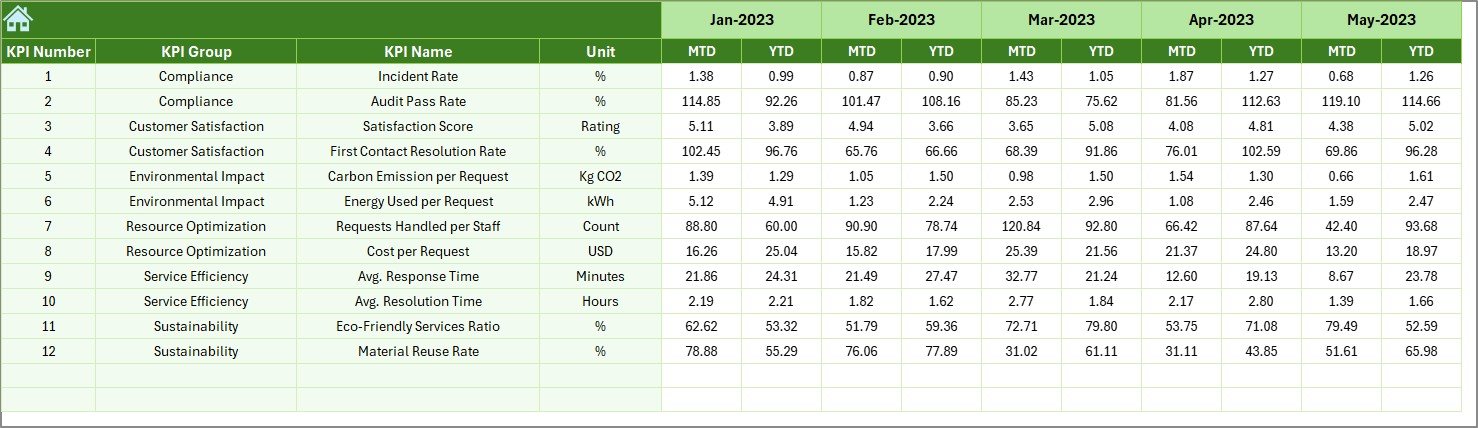
-
Store last year’s actual data for each KPI.
-
Enables accurate year-over-year (YoY) performance analysis.
-
Enhances decision-making by identifying growth or decline trends.
Click to Purchases Environmental and Sustainability Service Delivery KPI Dashboard in Excel
KPI Definition Sheet
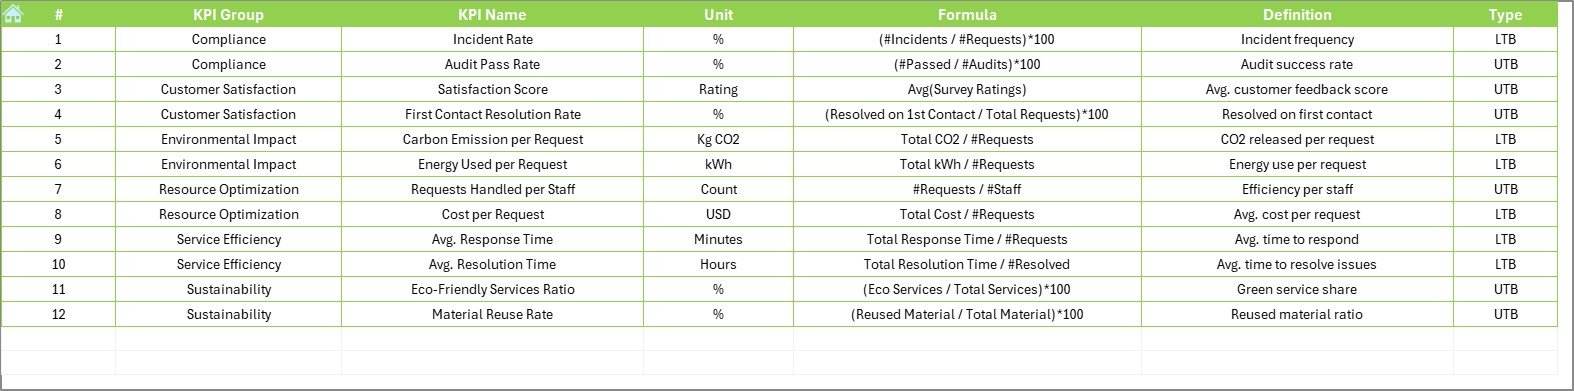
-
Contains all relevant information about each KPI:
- KPI Name
- KPI Group
- Unit
- Formula
- Short definition
-
Acts as a centralized KPI dictionary for the entire dashboard.
Why You Should Use This Dashboard
If your organization delivers services that impact the environment—waste management, energy consumption, water use, or carbon emissions—this dashboard becomes an essential part of your performance toolkit.
By using this dashboard, you can:
-
Increase transparency with stakeholders
-
Drive eco-conscious decision-making
-
Improve service efficiency
-
Monitor progress toward ESG goals
-
Reduce costs through operational improvements
Advantages of the Environmental and Sustainability Service Delivery KPI Dashboard
Let’s explore the key benefits in more detail:
✔ Data-Driven Sustainability
-
You get quantifiable insights on how well your services align with environmental goals.
-
Helps transition from guesswork to evidence-based strategies.
✔ Simplified Data Management
-
Excel makes it easy to input, calculate, and review data.
-
No complex software or additional cost involved.
✔ Instant Monthly and Yearly Views
-
Quickly toggle between MTD and YTD views.
-
Analyze performance in real-time and adjust strategy accordingly.
✔ Custom KPI Flexibility
-
You define your own KPIs based on your organization’s unique sustainability focus.
-
Add, edit, or remove KPIs without needing a developer.
✔ Visual Performance Monitoring
-
With trend charts and up/down arrows, it’s easy to spot positive or negative patterns.
-
Helps teams stay on track and respond quickly to dips in performance.
What KPIs Can You Track with This Dashboard?
Here are some sample KPIs organizations can measure using this dashboard:
-
Carbon Emissions per Service Delivered (kg CO₂e)
-
Energy Consumption per Operation (kWh)
-
Water Usage per Location (liters)
-
Waste Recycled (%) vs. Landfilled
-
Green Procurement Compliance Rate
-
Environmental Incident Count
-
Efficiency Score (Internal Calculated Metric)
-
Sustainability Budget Utilization Rate
-
Eco-friendly Transport Usage Rate
-
Customer Environmental Satisfaction Score
-
Service Delivery Time (Eco Projects)
-
Preventive Maintenance Compliance (%)
These KPIs help create a full picture of service delivery performance through a sustainability lens.
Best Practices for the Environmental and Sustainability Service Delivery KPI Dashboard
To get the most out of this tool, follow these proven best practices:
🔹 Define Clear KPIs First
Before using the dashboard, define what success looks like. Be specific:
-
Use SMART criteria (Specific, Measurable, Achievable, Relevant, Time-bound).
-
Example: “Reduce electricity consumption by 15% YTD.”
🔹 Maintain Consistent Data Entry
-
Always enter data on a regular schedule (e.g., end of each month).
-
Assign one responsible person per sheet to avoid duplication or errors.
🔹 Validate Data with Conditional Formatting
-
Use Excel’s built-in features like data validation and conditional icons.
-
This reduces errors and helps visualize values that are out of range.
🔹 Review the Trend Charts Monthly
-
Use KPI Trend sheet insights to guide performance reviews.
-
Look for consistent improvements or sudden drops in performance.
🔹 Update Target and Previous Year Data Annually
-
At the start of every year, refresh both your Target and Previous Year sheets.
-
This ensures year-over-year tracking remains relevant.
🔹 Involve All Departments
-
Share the dashboard across departments like Operations, Compliance, Procurement, and HR.
-
Foster collaboration to improve environmental performance at all levels.
🔹 Back Up the Excel File Regularly
-
Store the dashboard on a cloud drive (e.g., OneDrive or Google Drive).
-
Keep version history in case of accidental data loss.
How Does This Dashboard Improve Decision-Making?
Let’s break down how this dashboard supports better sustainability decisions:
-
Provides clarity: Easy access to trends and progress.
-
Drives accountability: Department-level responsibility through KPI assignment.
-
Enables optimization: Helps identify areas of overconsumption or inefficiency.
-
Promotes transparency: Share progress with external auditors or internal stakeholders.
-
Supports compliance: Track required metrics for regulatory reporting.
Conclusion: Move Toward a Greener, More Efficient Future
The Environmental and Sustainability Service Delivery KPI Dashboard in Excel is more than just a spreadsheet. It’s a strategic tool for organizations committed to green practices and measurable progress.
By using this Excel-based system, you’re ensuring your service delivery processes are not only efficient but also environmentally responsible.
Make the shift today—because sustainability is no longer a buzzword, it’s a responsibility.
❓Frequently Asked Questions (FAQs)
Q1. Can I customize the KPIs in the dashboard?
Yes! You can add or remove KPIs based on your goals. Just update the KPI Definition, Target, Actual, and Previous Year sheets.
Q2. Do I need Excel VBA knowledge to use this dashboard?
No VBA is required. The template runs entirely on built-in Excel formulas and features.
Q3. How often should I update the data?
Update monthly to maintain accurate MTD and YTD reporting. You can also set reminders to ensure consistency.
Q4. Is this dashboard suitable for small teams?
Absolutely. It’s lightweight and ideal for organizations of any size, from small businesses to government departments.
Q5. Can I use this for ESG reporting?
Yes, many of the tracked KPIs align directly with environmental metrics required in ESG (Environmental, Social, Governance) reports.
Q6. Can I share the dashboard with other team members?
Yes, you can share it via a shared network or cloud storage. Ensure you restrict editing rights if needed.
Q7. What version of Excel do I need?
It’s best to use Excel 2016 or later for optimal compatibility and performance.
Visit our YouTube channel to learn step-by-step video tutorials