In today’s competitive business world, sales teams cannot rely on guesswork. Data is the fuel that drives informed decisions, accurate forecasting, and sustainable growth. A Sales Business Intelligence (BI) Report in Excel is a powerful tool that helps businesses gather, analyze, and visualize sales data in a clear and actionable way.
This article will explain everything you need to know about creating and using a Sales Business Intelligence Report in Excel — including its features, advantages, best practices, and tips for getting the most out of it.
Click to Purchases Sales Business Intelligence Report in Excel
What is a Sales Business Intelligence Report in Excel?
A Sales Business Intelligence Report in Excel is a structured template designed to collect, track, and analyze sales performance data. It transforms raw sales numbers into easy-to-read dashboards, charts, and summaries, enabling decision-makers to quickly understand trends, identify gaps, and take corrective action.
Unlike traditional sales reports, which are often static and text-heavy, a BI report in Excel uses dynamic charts, slicers, and pivot tables to make analysis interactive and insightful.
Why Use Excel for Sales Business Intelligence?
Many businesses use dedicated BI tools like Power BI or Tableau, but Excel remains one of the most widely used platforms for business reporting due to its flexibility, accessibility, and cost-effectiveness.
Here’s why Excel works so well for Sales BI:
-
Familiarity – Most professionals already know how to use Excel, reducing the learning curve.
-
Customizable – You can adapt the template to fit your exact reporting needs.
-
Integration – It works with CSV files, ERP exports, and CRM data.
-
Cost-Effective – No extra licensing costs for small businesses already using Microsoft Office.
-
Offline Access – Unlike cloud-based BI tools, Excel works without internet access.
Key Features of the Sales Business Intelligence Report in Excel
The Sales Business Intelligence Report template we have created includes three main pages and additional supporting data sheets.
Summary Page
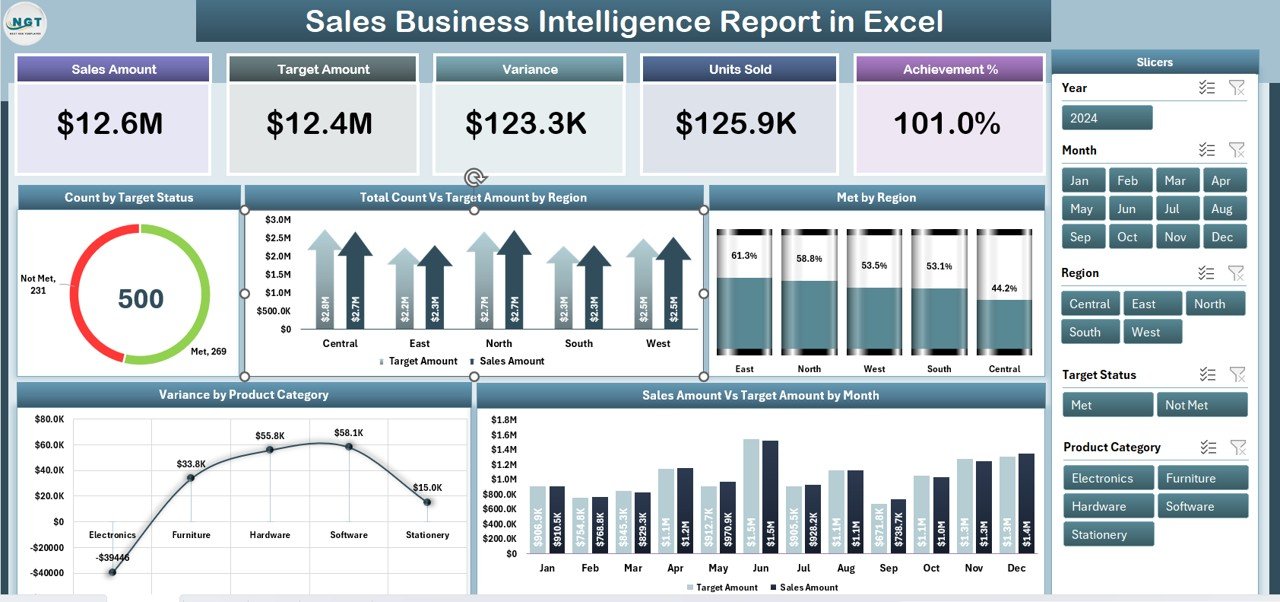
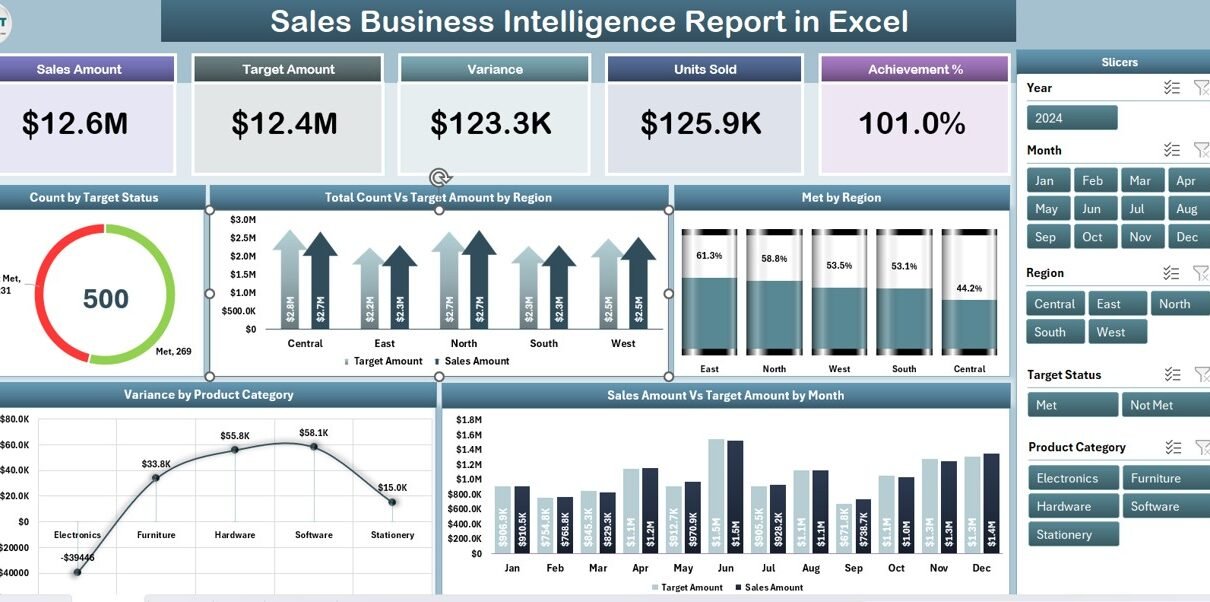
The Summary Page is the main dashboard and provides an at-a-glance view of sales performance.
Highlights include:
-
Five KPI Cards – Showing critical metrics like Total Sales, Target Sales, Count of Orders, and other relevant figures.
-
Right-Side Slicer – Allows you to filter data by region, product category, or time period.
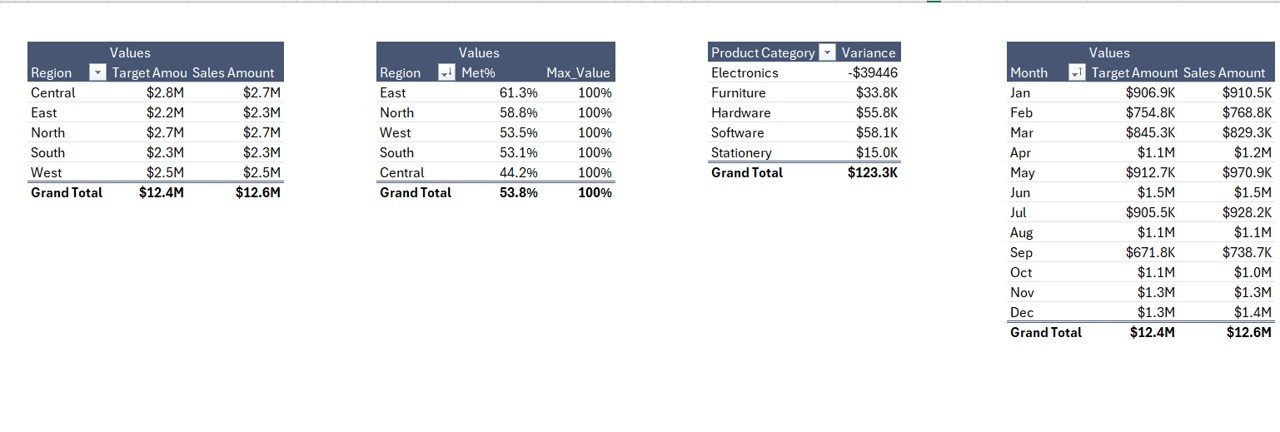
Five Interactive Charts:
- Count by Target Sales
- Total Count Vs Target Amount by Region
- Met vs. Not Met by Region
- Variance by Product Category
- Sales Amount Vs Target Amount by Month
The combination of KPI cards and charts makes it easy to track overall performance and drill down into details.
Report Page
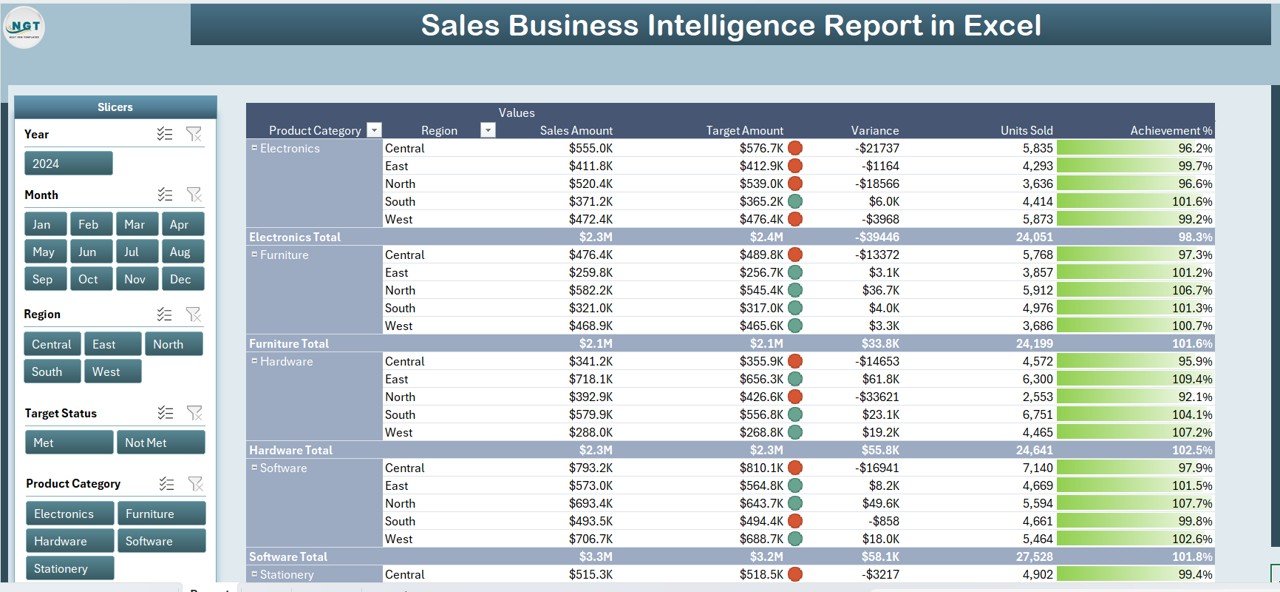
The Report Page offers a more detailed breakdown of the data.
Key elements include:
-
Left-Side Slicer – For filtering data by various dimensions like region, salesperson, or product type.
-
Information Table – Displays detailed sales transactions, including date, region, product, salesperson, actual sales, and target figures.
This page is perfect for deep analysis and generating custom views of sales data.
Data Sheet
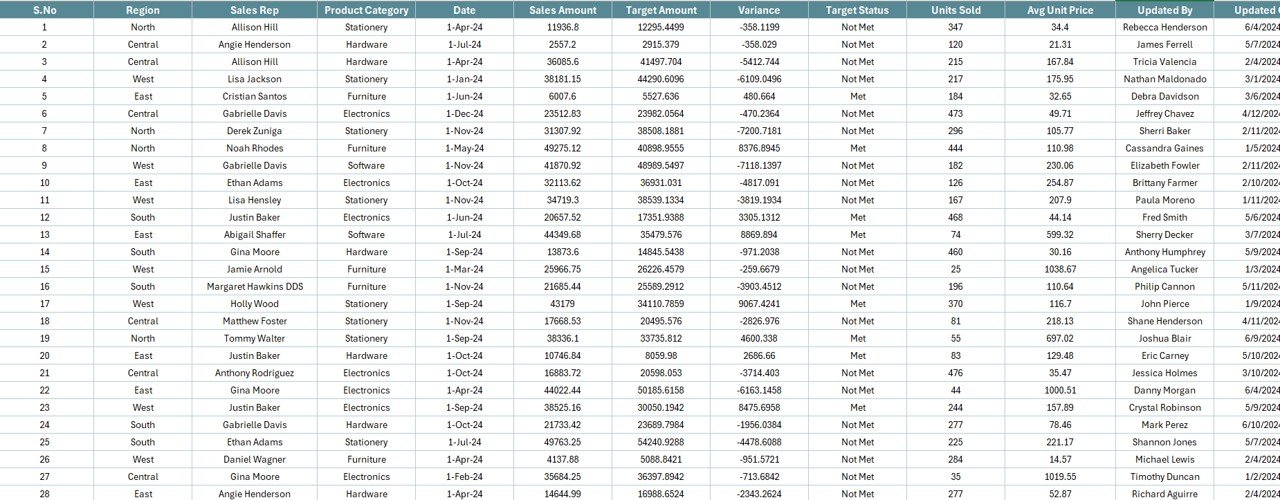
The Data Sheet is the backbone of the report. It contains all raw sales data, structured in a way that supports the dashboard and report pages. Data here can be imported from your CRM, ERP, or manually entered.
Support Sheet
The Support Sheet contains reference lists, lookup tables, and supporting formulas to make the dashboard dynamic and interactive.
Advantages of a Sales Business Intelligence Report in Excel
A well-designed Sales BI report can transform the way your sales team operates.
Key benefits include:
-
Improved Decision-Making – Get instant insights into sales performance and trends.
-
Time Savings – Automates repetitive reporting tasks.
-
Enhanced Accuracy – Reduces manual calculation errors.
-
Customizable Views – Focus on metrics that matter to your business.
-
Better Goal Tracking – Compare actual results against targets in real time.
-
Sales Forecasting – Spot trends early to adjust strategies.
-
Performance Monitoring – Identify top-performing regions, products, or sales reps.
Click to Purchases Sales Business Intelligence Report in Excel
How to Create a Sales Business Intelligence Report in Excel
While you can download a ready-to-use template, you might want to customize it from scratch. Here’s how to create one:
-
Collect Your Data – Export sales data from your CRM or accounting software.
-
Organize It in a Table Format – Include columns for date, region, product, salesperson, sales amount, and target amount.
-
Use Pivot Tables – Summarize your data by key dimensions.
-
Create KPI Cards – Use Excel formulas to calculate total sales, variance, and achievement percentage.
-
Add Charts – Visualize performance trends by region, month, and product category.
-
Insert Slicers – Allow users to filter the data interactively.
-
Format for Readability – Use consistent colors, clear fonts, and logical layouts.
Best Practices for Using a Sales BI Report in Excel
To get the best results from your Sales BI Report, follow these best practices:
-
Keep Data Updated – Refresh your data regularly for accurate reporting.
-
Focus on Key Metrics – Avoid clutter by showing only the most important KPIs.
-
Use Conditional Formatting – Highlight underperforming regions or products.
-
Validate Your Data – Ensure there are no duplicates or incorrect entries.
-
Leverage Dynamic Ranges – Make your charts and pivot tables auto-update when new data is added.
-
Ensure Mobile Compatibility – If sharing via cloud, check how it looks on smaller screens.
Common Metrics to Include in Your Sales BI Report
Your exact KPIs will depend on your business model, but here are common ones:
-
Total Sales Revenue
-
Target vs. Actual Sales
-
Number of Orders
-
Average Order Value (AOV)
-
Sales Growth %
-
Top Products Sold
-
Revenue by Region
-
Variance from Target
Opportunities for Improvement in Sales BI Reporting
Even with a robust BI report, there’s always room for improvement:
-
Integrate with Real-Time Data Sources – Reduce delays in reporting.
-
Automate Data Imports – Use Power Query for seamless data refresh.
-
Add Forecasting Models – Use historical data to predict future sales.
-
Track Sales Rep Performance – Incentivize high performers.
-
Segment Customers – Analyze by customer type, loyalty, or demographics.
Example Use Case
Scenario: A retail chain uses the Sales BI Report in Excel to monitor monthly performance across five regions.
Actions Taken:
-
Identified Region B consistently missing targets.
-
Discovered that high returns in one product category were affecting revenue.
-
Adjusted marketing efforts in underperforming areas.
Results:
-
Achieved a 15% increase in sales within three months.
-
Reduced product returns by 8%.
Conclusion
A Sales Business Intelligence Report in Excel is more than just a spreadsheet. It’s a powerful decision-making tool that gives you the clarity and confidence to drive sales growth. With the right design, KPIs, and best practices, you can turn raw sales data into actionable insights.
Whether you use a ready-made template or build one from scratch, this reporting method remains one of the most accessible and cost-effective ways to track and improve sales performance.
Frequently Asked Questions (FAQs)
1. What is the main purpose of a Sales BI Report in Excel?
The main purpose is to track, analyze, and visualize sales data, enabling better decision-making and performance monitoring.
2. How often should I update my sales BI report?
Ideally, update it daily or weekly, depending on your business needs and data availability.
3. Can I integrate my Sales BI report with other tools?
Yes. You can import data from CRM systems, ERP software, and cloud storage directly into Excel.
4. Is Excel enough for sales BI, or should I move to tools like Power BI?
Excel works well for small to medium businesses. Larger organizations handling massive datasets may benefit from Power BI for more advanced analytics.
5. How do I ensure data accuracy in my report?
Validate data sources, remove duplicates, and perform regular audits to maintain accuracy.
Visit our YouTube channel to learn step-by-step video tutorials