Biotechnology is one of the fastest-growing industries in the world. From drug discovery to clinical trials and regulatory filings, organizations generate vast amounts of data every day. Managing this information effectively is critical for innovation, cost optimization, and compliance. While many companies invest in expensive business intelligence tools, Excel remains a powerful and flexible platform to create dashboards that deliver deep insights.
A Biotechnology Dashboard in Excel turns raw data into visual reports. It allows stakeholders to track research and development (R&D) costs, monitor clinical trial performance, analyze approvals, and compare regional operations. With dynamic charts, slicers, and a user-friendly layout, teams can make data-driven decisions quickly.
In this article, we will explore the structure of the Biotechnology Dashboard in Excel, its advantages, best practices, and how it can help biotechnology companies streamline their operations.
Click to Purchases Biotechnology Dashboard in Excel
What Is a Biotechnology Dashboard in Excel?
A Biotechnology Dashboard in Excel is a ready-to-use reporting tool designed to capture and visualize biotech-related metrics. Instead of working with endless spreadsheets, this dashboard provides a centralized, interactive view of costs, approvals, and project outcomes.
It consists of multiple pages (or worksheet tabs) that organize data into logical sections. Users can navigate easily between overview reports, department-specific insights, regional analysis, project performance, and monthly trends. Supporting data and reference sheets make it easy to update and maintain.
By using Excel’s powerful features such as pivot tables, slicers, and charts, the dashboard becomes a lightweight yet powerful alternative to complex BI systems.
Key Features of the Biotechnology Dashboard
This dashboard has been structured into five main pages along with supporting sheets. Below is a detailed explanation of each.
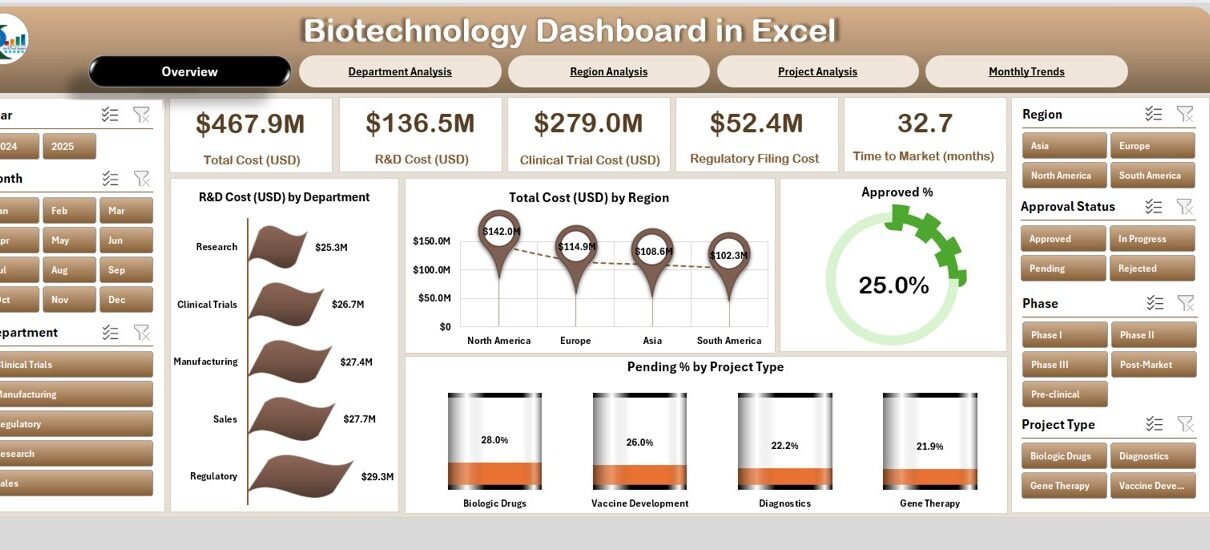
Overview Page
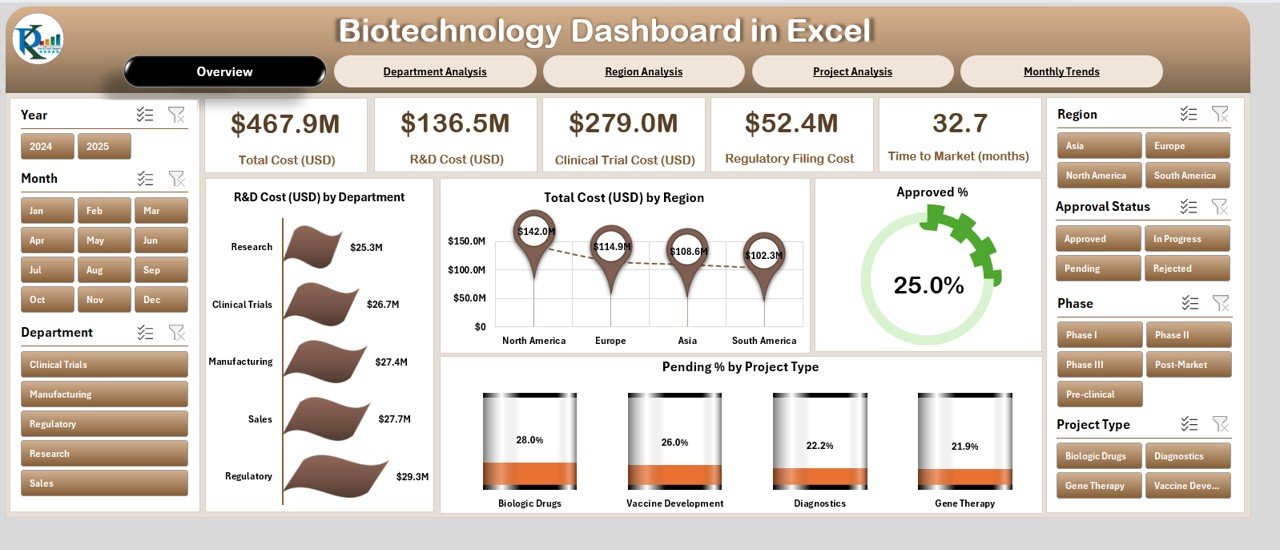
The Overview Page serves as the executive summary of the dashboard.
-
Cards: Displays quick KPIs such as total R&D cost, total cost by region, and approval percentages.
Charts:
- R&D Cost (USD) by Department
- Total Cost (USD) by Region
- Approved % by Project Type
- Pending % by Project Type
-
Slicers: Allow filtering across different dimensions such as department, region, or project type.
This page is ideal for senior management to get a snapshot of performance in seconds.
Department Analysis
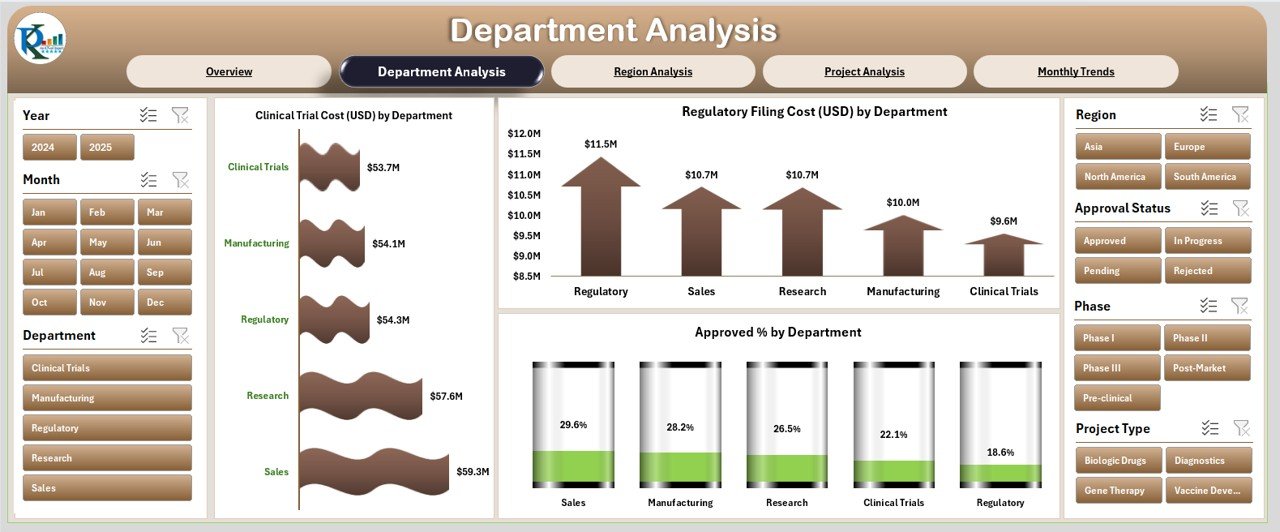
The Department Analysis Page dives deeper into performance by department.
Charts:
- Clinical Trial Cost (USD) by Department
- Regulatory Filing Cost (USD) by Department
- Approved % by Department
This view helps research directors and financial controllers compare performance and cost distribution across teams. It highlights which departments are performing efficiently and which may require intervention.
Click to Purchases Biotechnology Dashboard in Excel
Region Analysis
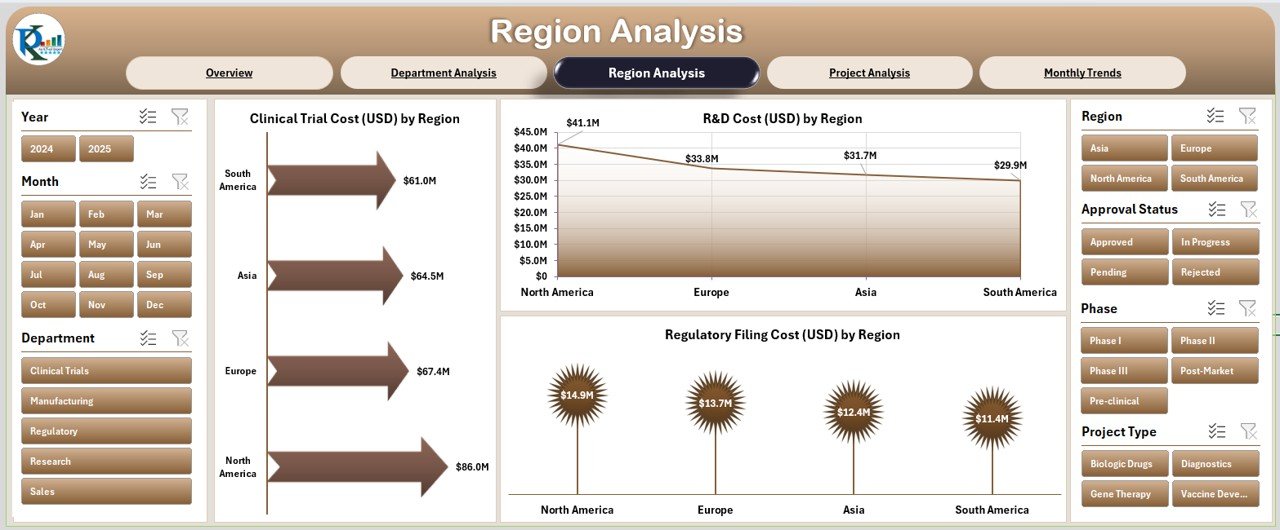
The Region Analysis Page provides a geographic breakdown of performance.
Charts:
- Clinical Trial Cost (USD) by Region
- Regulatory Filing Cost (USD) by Region
- R&D Cost (USD) by Region
With this analysis, decision-makers can evaluate regional cost variations and resource utilization. For global biotech companies, this insight supports better allocation of funds and prioritization of regions with higher success rates.
Project Analysis
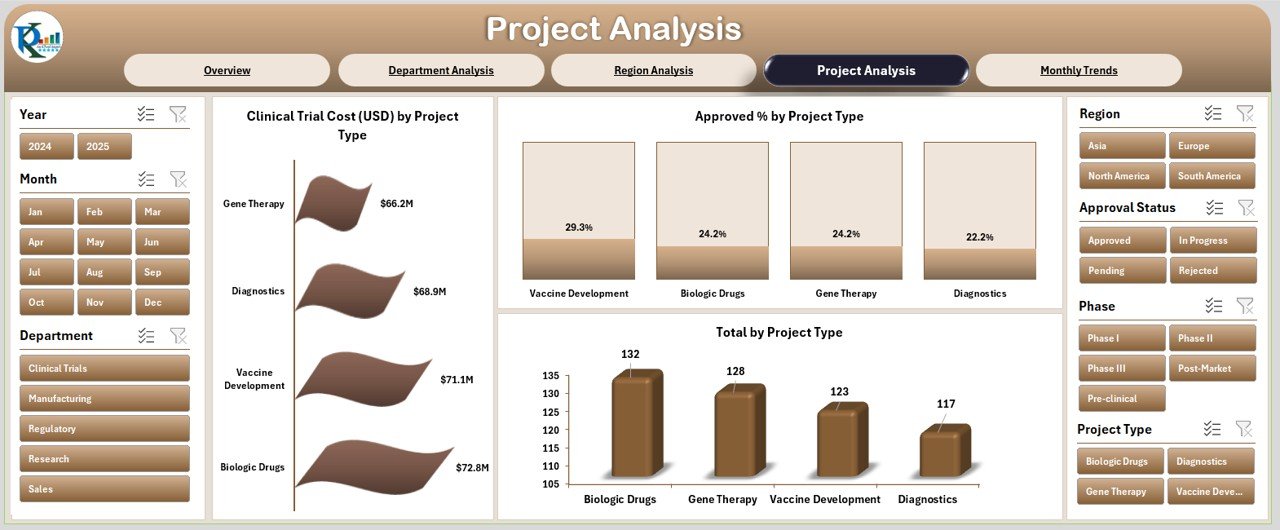
The Project Analysis Page focuses on different project types.
Charts:
- Clinical Trial Cost (USD) by Project Type
- Approved % by Project Type
- Total Cost by Project Type
This is particularly useful for portfolio management, where stakeholders need to know which types of projects bring the highest returns, fastest approvals, or require higher budgets.
Monthly Trends
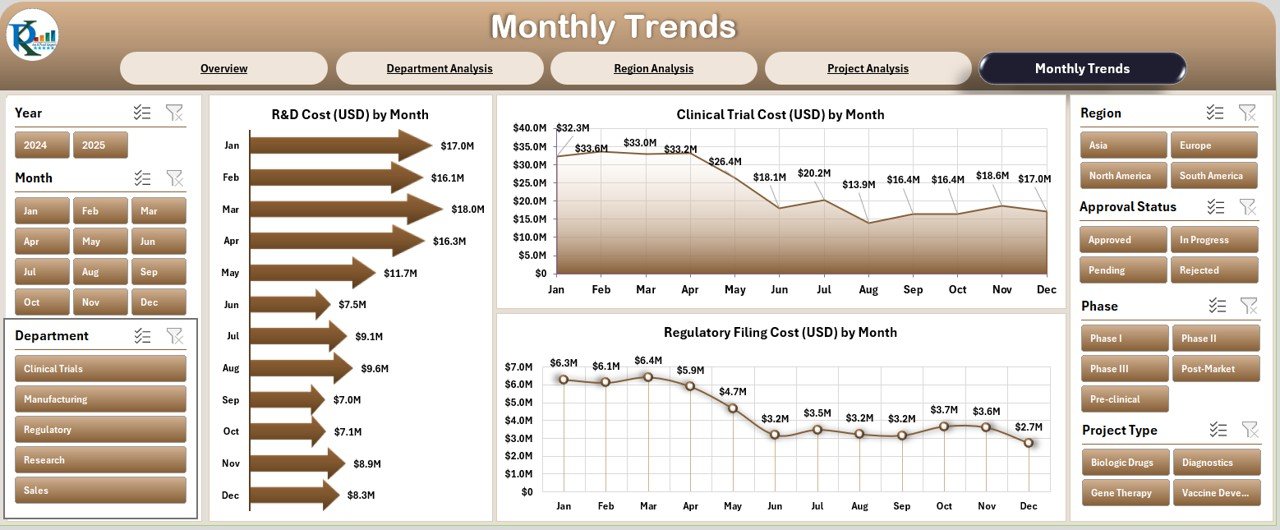
The Monthly Trends Page gives a timeline-based view of key biotech metrics.
Charts:
- R&D Cost (USD) by Month
- Clinical Trial Cost (USD) by Month
- Regulatory Filing Cost (USD) by Month
This helps in identifying seasonal trends, cost fluctuations, and long-term progress. It also supports forecasting and budgeting for upcoming periods.
Supporting Sheets
-
Data Sheet: Contains all the raw numbers required to power the dashboard. This sheet is updated periodically with new entries.
-
Support Sheet: Stores lookup lists, reference tables, and dropdown values used across the dashboard.
Why Do Biotech Companies Need This Dashboard?
Biotech companies deal with massive complexity—from research costs to clinical approvals. Without proper monitoring, organizations face risks such as:
-
Overspending on R&D without clear returns
-
Delays in clinical trials
-
Low approval rates due to poor tracking
-
Regional inefficiencies that remain hidden
The Biotechnology Dashboard in Excel simplifies monitoring and ensures data transparency. It reduces the need for manual reporting and makes performance evaluation easier for managers, regulators, and investors.
Advantages of the Biotechnology Dashboard in Excel
Here are the key benefits biotech firms can gain:
✅ Cost Transparency: Breaks down costs by department, project type, and region.
✅ Faster Decision-Making: Management can see approval rates, pending projects, and costs instantly.
✅ Better Resource Allocation: Identifies underperforming areas and channels funds into high-value projects.
✅ Time Savings: Automates data analysis and reporting, reducing manual effort.
✅ Accessibility: Excel is widely available and doesn’t require expensive software licenses.
✅ Scalability: Can be updated with additional data sources, KPIs, and dashboards as the company grows.
Opportunities for Improvement
While Excel dashboards are highly effective, there are areas where companies can improve their implementation:
🔹 Data Quality: The dashboard is only as good as the data entered. Standardizing data entry processes is essential.
🔹 Automation: Linking with external databases or APIs can reduce manual updates.
🔹 Visualization Enhancements: Incorporating advanced Excel features such as Power Query, Power Pivot, or conditional formatting can make dashboards more powerful.
🔹 Security: Protecting sensitive biotech data is vital. Excel files should be password-protected and stored in secure environments.
🔹 Scalability to BI Tools: While Excel is great for small to medium datasets, very large datasets may need migration to Power BI or Tableau.
Best Practices for the Biotechnology Dashboard
To maximize the benefits of this dashboard, companies should follow these best practices:
📌 Standardize Data Collection: Use predefined formats and dropdown lists for data entry.
📌 Update Regularly: Refresh the Data Sheet on a fixed schedule (weekly, monthly).
📌 Use Slicers Effectively: Encourage users to filter by region, department, or project type for better insights.
📌 Visual Clarity: Keep charts simple and avoid clutter. Highlight KPIs that matter most.
📌 Secure the File: Apply password protection and manage access carefully.
📌 Iterative Improvements: Collect user feedback and enhance dashboard features over time.
Real-World Applications of Biotechnology Dashboard
Biotechnology dashboards can be applied in several areas:
-
Drug Development: Track research costs, trial success rates, and approvals.
-
Clinical Trials: Monitor patient enrollment, regional performance, and outcomes.
-
Regulatory Compliance: Evaluate filing costs and approval percentages.
-
Financial Planning: Compare budgets with actual expenditures by month or department.
-
Global Operations: Identify high-performing regions and optimize global resource allocation.
Conclusion
The Biotechnology Dashboard in Excel is more than a reporting tool—it is a decision-making platform. By consolidating research costs, approvals, and regional performance into one interactive file, it allows biotech companies to innovate faster, manage resources effectively, and remain compliant.
For organizations looking to maximize the value of their data without heavy IT investment, this dashboard is an excellent starting point.
Frequently Asked Questions (FAQs)
1. What is a Biotechnology Dashboard in Excel?
It is a ready-to-use Excel template that provides visual reports of biotech operations such as R&D costs, approvals, clinical trials, and regional performance.
2. Who can use this dashboard?
Research managers, financial controllers, compliance teams, and senior executives in biotechnology companies can all use it.
3. Can I customize the dashboard?
Yes. You can add new KPIs, charts, or link it with databases like SQL or Access for automation.
4. How often should I update the data?
Most companies update their data monthly, but if your biotech projects move faster, weekly updates are recommended.
5. Is Excel powerful enough for large biotech datasets?
For small and medium datasets, Excel works perfectly. For very large datasets, integration with Power BI or other BI tools is recommended.
6. How does this dashboard improve decision-making?
By consolidating costs, approvals, and project outcomes into one view, it allows managers to make faster, data-driven decisions.
7. Is this dashboard suitable for startups?
Absolutely. It provides startups with cost-effective insights without requiring expensive BI tools.
Visit our YouTube channel to learn step-by-step video tutorials