Employee offboarding is just as important as onboarding. A structured offboarding process ensures a smooth transition for both the departing
In today’s fast-paced and competitive environment, product development managers must track progress accurately and act quickly on insights. But how
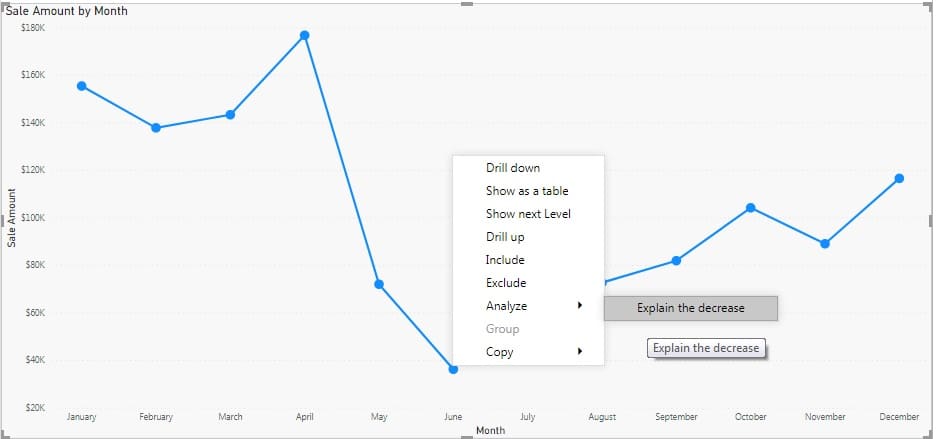
In today's data-driven world, visualization of data is an essential aspect of decision-making. Excel is a powerful tool which can