Aviation maintenance plays a critical role in ensuring safety, reliability, regulatory compliance, and cost control. However, managing aircraft maintenance performance without a structured KPI tracking system often leads to delayed decisions, increased downtime, and higher operational costs. Many aviation teams still rely on scattered spreadsheets and manual reports, which slow down analysis and reduce visibility.
That is exactly where an Aviation Maintenance KPI Dashboard in Excel becomes a powerful and practical solution.
In this detailed article, you will learn what an Aviation Maintenance KPI Dashboard in Excel is, why aviation organizations need it, how it works, its worksheet-wise structure, key features, advantages, best practices, and frequently asked questions. Moreover, the article uses clear language, strong transitions, and active voice to ensure clarity and SEO effectiveness.
Click to Purchases Aviation Maintenance KPI Dashboard in Excel
What Is an Aviation Maintenance KPI Dashboard in Excel?
An Aviation Maintenance KPI Dashboard in Excel is a centralized performance tracking tool designed to monitor, analyze, and visualize key maintenance KPIs using Microsoft Excel.
Instead of working with multiple disconnected worksheets, this dashboard brings MTD, YTD, target, and previous-year performance data into one interactive and user-friendly interface. As a result, maintenance managers, engineers, and operations teams gain instant visibility into maintenance efficiency and compliance.
Additionally, because the dashboard uses Excel, it remains easy to update, flexible to customize, and cost-effective for aviation organizations of all sizes.
Why Do Aviation Maintenance Teams Need a KPI Dashboard?
Aviation maintenance operations involve strict regulatory standards, high safety expectations, and complex scheduling. Therefore, teams must track performance continuously rather than react after issues arise.
Here is why a KPI dashboard becomes essential:
-
First, maintenance teams track multiple KPIs across safety, reliability, cost, and efficiency.
-
Second, leadership requires Month-to-Date (MTD) and Year-to-Date (YTD) visibility.
-
Third, comparing current year vs previous year helps identify long-term trends.
-
Finally, visual indicators allow teams to identify risks and delays instantly.
Because of these reasons, an Aviation Maintenance KPI Dashboard in Excel becomes a strategic necessity rather than a reporting option.
How Does an Aviation Maintenance KPI Dashboard in Excel Work?
The dashboard follows a simple yet effective workflow.
First, users enter actual, target, and previous-year data into dedicated Excel sheets.
Next, the dashboard automatically calculates variances, percentages, and trends.
Then, slicers and dropdowns allow users to select months and KPIs dynamically.
Finally, charts, tables, and indicators update instantly for analysis.
Because of this structure, the dashboard delivers fast insights without complex tools or coding.
Click to Purchases Aviation Maintenance KPI Dashboard in Excel
What Are the Key Features of the Aviation Maintenance KPI Dashboard in Excel?
This dashboard includes carefully designed features that support maintenance decision-making.
Key Highlights
-
Fully Excel-based and ready to use
-
Month selection using dropdowns
-
MTD and YTD performance tracking
-
Target vs Actual comparison
-
Previous Year comparison
-
Conditional formatting with up and down arrows
-
KPI trend analysis
-
Dedicated KPI definition section
Together, these features transform maintenance data into actionable insights.
Worksheet-Wise Structure of the Aviation Maintenance KPI Dashboard in Excel
The dashboard consists of seven well-structured worksheets, each serving a specific purpose.
1. What Is the Purpose of the Home Sheet?
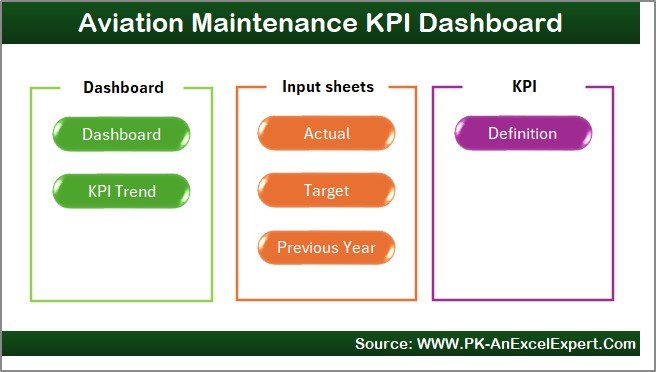
The Home Sheet acts as the navigation center of the dashboard.
Key Functions of the Home Sheet
-
Displays six navigation buttons
-
Allows users to jump directly to any worksheet
-
Improves usability and navigation speed
Because of this structure, users do not waste time searching for sheets.
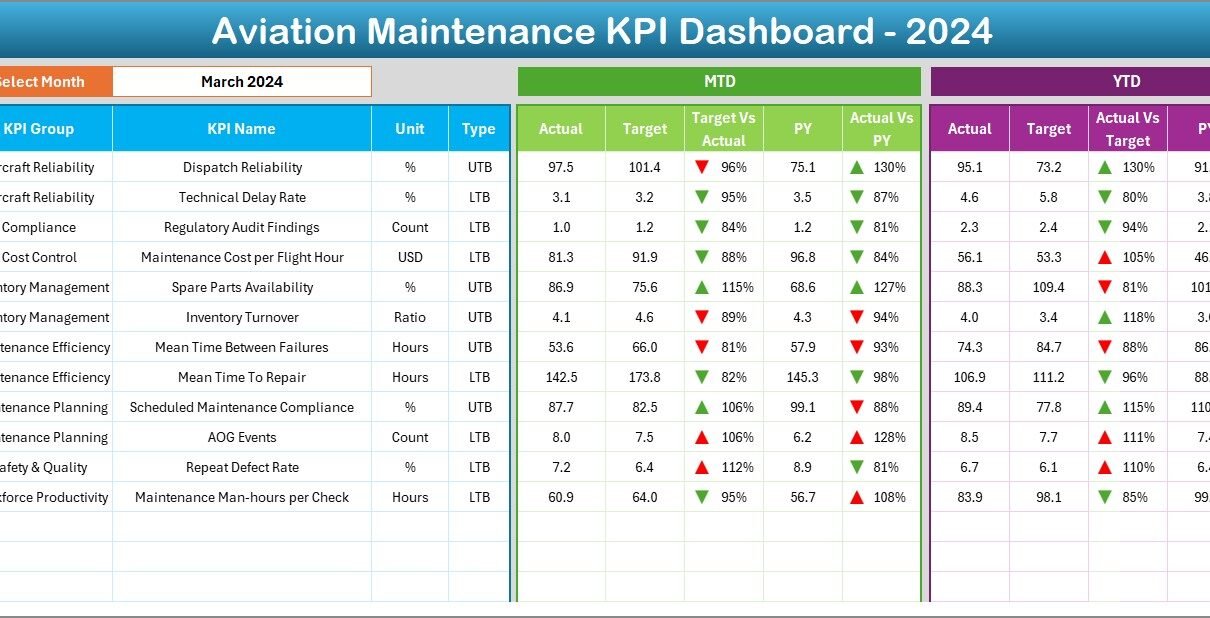
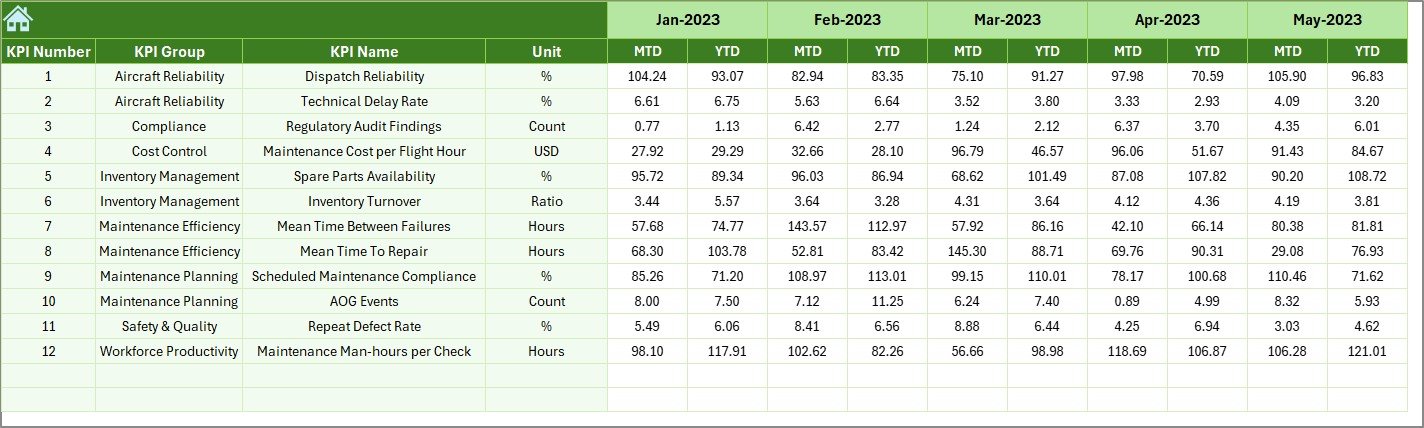
2. What Information Does the Dashboard Sheet Show?
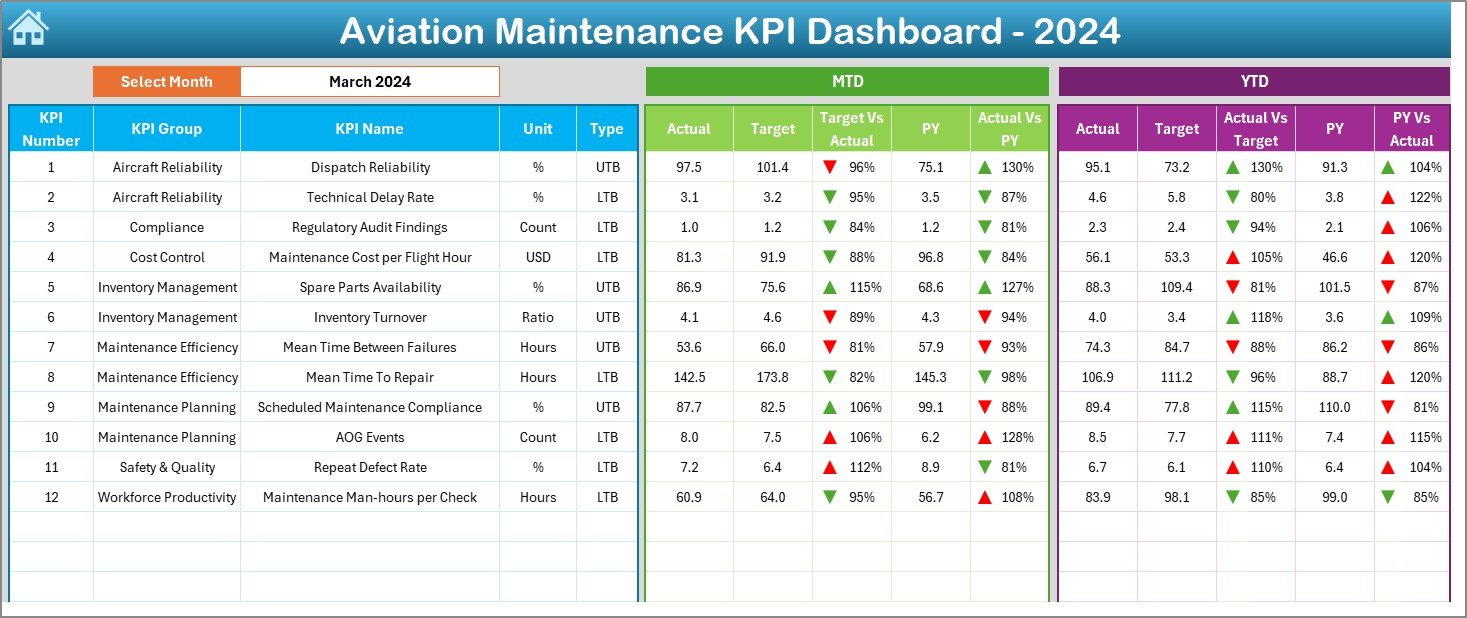
The Dashboard Sheet serves as the main performance overview page.
Month Selection
On cell D3, users select the reporting month using a dropdown. Once selected, all KPI values update automatically for that month.
MTD Performance Analysis
The dashboard displays Month-to-Date (MTD) information for each KPI, including:
-
Actual values
-
Target values
-
Previous Year values
-
Target vs Actual percentage
-
Previous Year vs Actual percentage
-
Conditional formatting arrows (▲ ▼)
These indicators help users instantly understand performance status.
YTD Performance Analysis
Similarly, the dashboard shows Year-to-Date (YTD) performance:
-
Actual YTD values
-
Target YTD values
-
Previous Year YTD values
-
Target vs Actual percentage
-
Previous Year vs Actual percentage
-
Conditional formatting arrows
Because of this dual view, users gain both short-term and long-term insights.
Click to Purchases Aviation Maintenance KPI Dashboard in Excel
3. How Does the KPI Trend Sheet Help in Analysis?
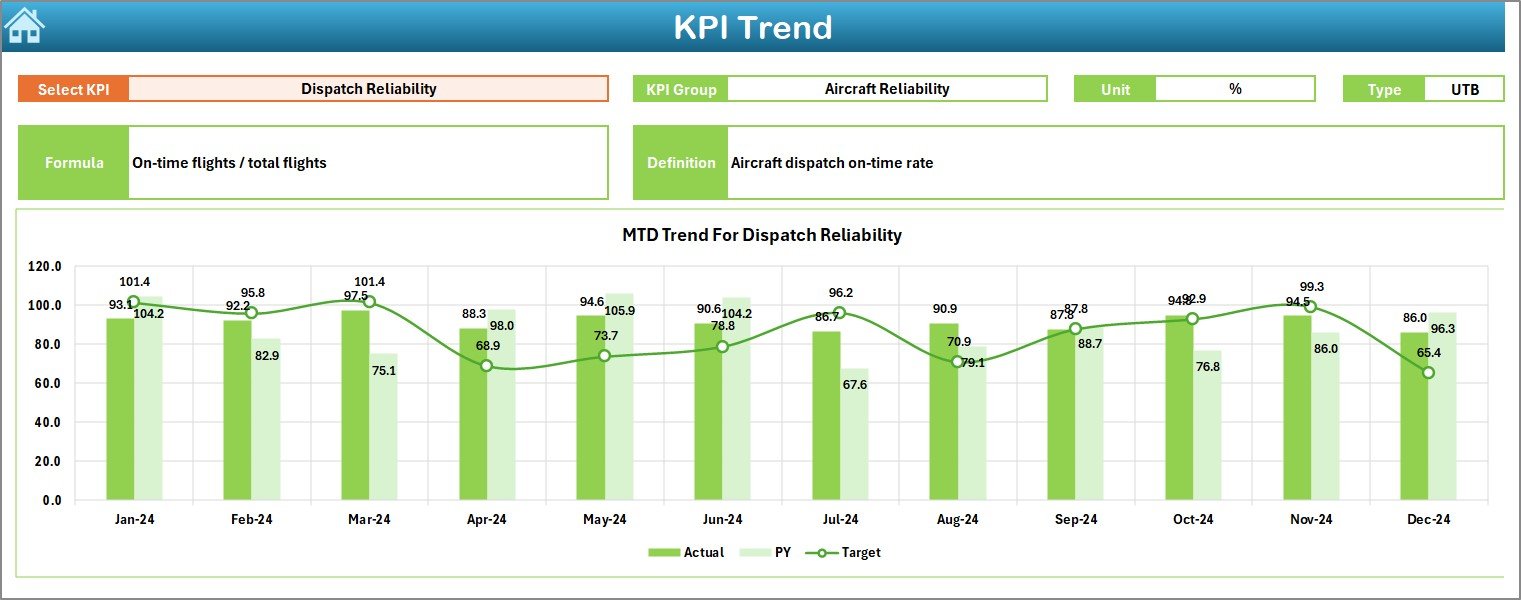
The KPI Trend Sheet focuses on detailed KPI-level analysis.
KPI Selection
Users select the KPI name from a dropdown in cell C3. Once selected, all related information updates automatically.
KPI Details Displayed
This sheet displays:
-
KPI Group
-
Unit of measurement
-
KPI Type (Lower the Better or Upper the Better)
-
KPI Formula
-
KPI Definition
As a result, users always understand what each KPI represents.
Trend Charts
The sheet also shows MTD and YTD trend charts for:
-
Actual values
-
Target values
-
Previous Year values
These charts help identify patterns, fluctuations, and performance gaps over time.
4. How Does the Actual Numbers Input Sheet Work?
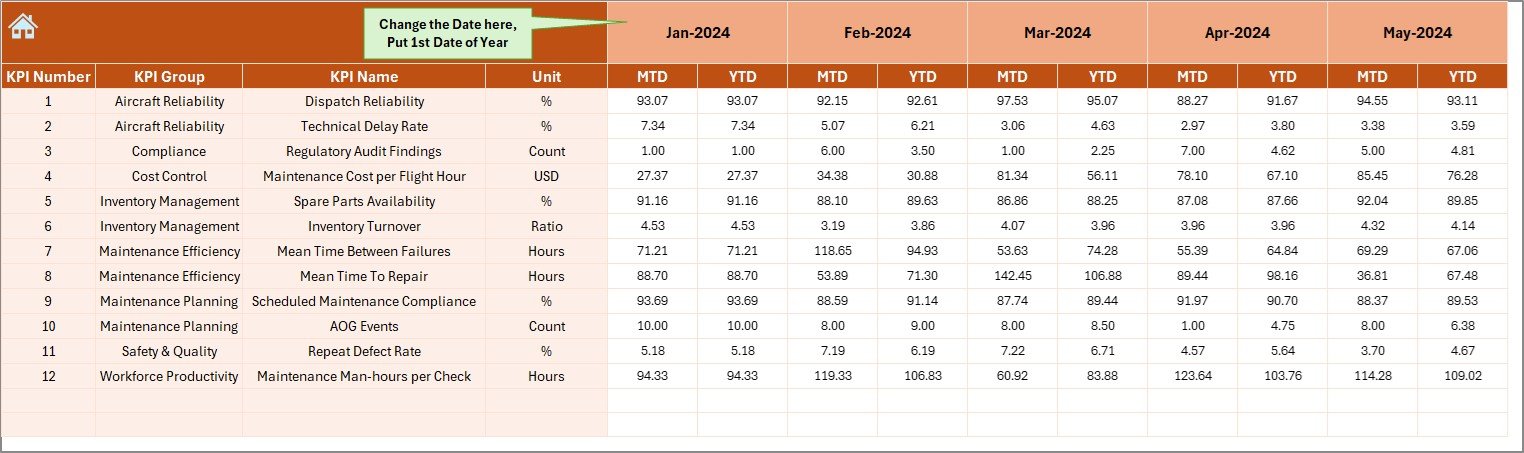
The Actual Numbers Input Sheet stores current-year performance data.
Key Inputs
-
Enter MTD and YTD actual numbers
-
Change the reporting month using cell E1
-
Use the first month of the year as the starting point
This structured input ensures accurate calculations throughout the dashboard.
5. What Is the Role of the Target Sheet?
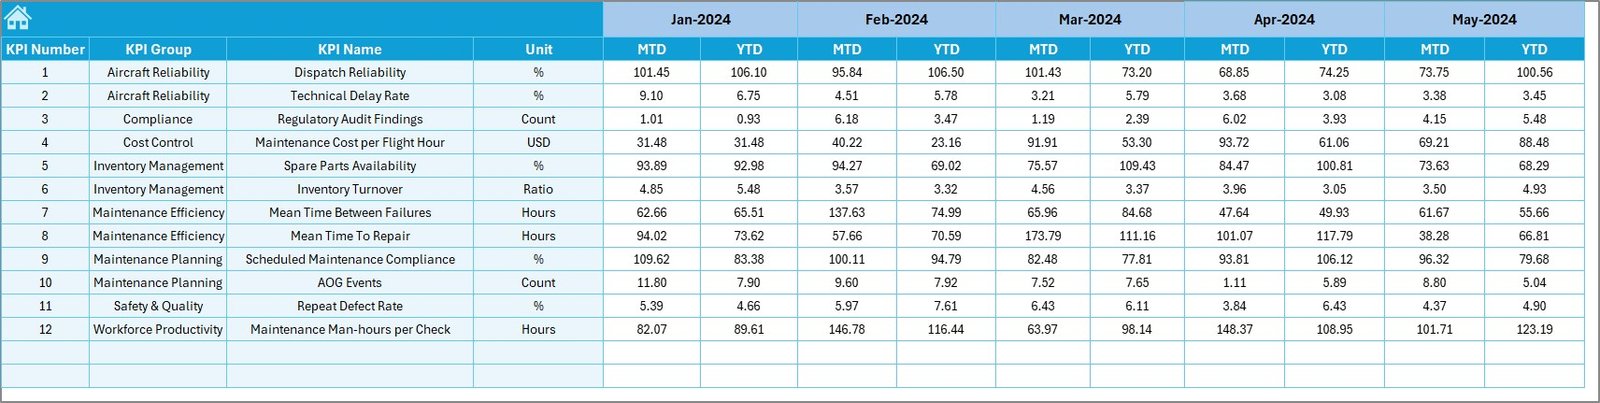
The Target Sheet stores performance benchmarks.
Key Inputs
-
Enter MTD target values for each KPI
-
Enter YTD target values for each KPI
-
Align targets with maintenance objectives
Targets drive performance evaluation and variance analysis.
6. Why Is the Previous Year Number Sheet Important?
The Previous Year Number Sheet captures historical data.
Purpose of This Sheet
-
Enables year-over-year comparison
-
Helps identify performance improvement or decline
-
Supports long-term maintenance planning
Because of this sheet, trend analysis becomes more meaningful.
7. What Information Goes into the KPI Definition Sheet?
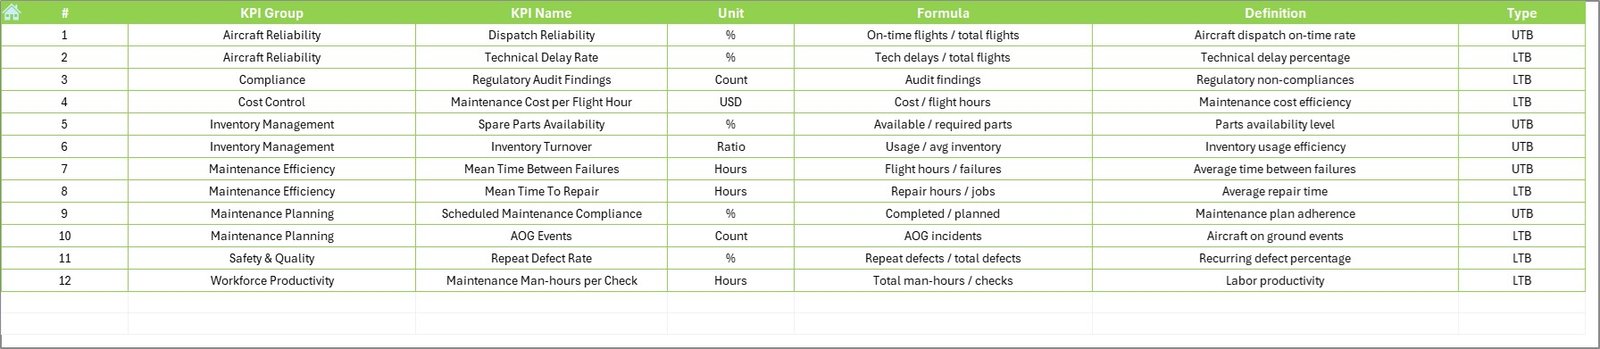
The KPI Definition Sheet ensures clarity and standardization.
Required Details
-
KPI Name
-
KPI Group
-
Unit
-
Formula
-
KPI Definition
This sheet acts as a single source of truth for KPI understanding.
Advantages of Aviation Maintenance KPI Dashboard in Excel
Using this dashboard delivers clear operational and strategic benefits.
Key Advantages
✔ Centralized KPI tracking
✔ Improved maintenance visibility
✔ Faster and data-driven decisions
✔ Clear Target vs Actual comparison
✔ Accurate year-over-year analysis
✔ Easy Excel-based maintenance
✔ No dependency on advanced BI tools
Because of these advantages, aviation teams gain stronger control over maintenance operations.
How Does This Dashboard Improve Aviation Maintenance Decisions?
This dashboard helps teams:
-
Reduce aircraft downtime
-
Improve maintenance planning
-
Monitor compliance KPIs
-
Control maintenance costs
-
Improve operational efficiency
-
Align teams with safety goals
As a result, decision-making becomes proactive instead of reactive.
Click to Purchases Aviation Maintenance KPI Dashboard in Excel
Best Practices for the Aviation Maintenance KPI Dashboard in Excel
To maximize dashboard value, follow these best practices.
1. Define KPIs Clearly
Always maintain clear KPI definitions and formulas.
2. Maintain Data Consistency
Use consistent month formats and KPI names.
3. Update Data Regularly
Update actuals, targets, and previous-year data monthly.
4. Review Trends Frequently
Analyze MTD and YTD trends to detect issues early.
5. Train Maintenance Teams
Ensure users understand KPI meaning and indicators.
6. Align KPIs with Safety Goals
Focus KPIs on reliability, compliance, and efficiency.
Conclusion
An Aviation Maintenance KPI Dashboard in Excel transforms complex maintenance data into clear, actionable insights. By combining structured data entry, dynamic calculations, and visual indicators, this dashboard empowers aviation maintenance teams to track performance accurately, identify risks early, and make confident decisions.
In a safety-critical industry like aviation, this dashboard becomes an essential tool for operational excellence and continuous improvement.
Click to Purchases Aviation Maintenance KPI Dashboard in Excel
Frequently Asked Questions (FAQs)
What is an Aviation Maintenance KPI Dashboard in Excel?
It is an Excel-based dashboard that tracks aviation maintenance KPIs using MTD, YTD, target, and previous-year data.
Can I customize KPIs in this dashboard?
Yes, you can easily add or modify KPIs using the input and definition sheets.
Does the dashboard support MTD and YTD analysis?
Yes, it provides both MTD and YTD performance tracking.
Is this dashboard suitable for small aviation teams?
Yes, it works for both small and large aviation maintenance operations.
Do I need advanced Excel skills to use it?
No, basic Excel knowledge is sufficient.
Can this dashboard track previous-year performance?
Yes, it includes a dedicated previous-year data sheet.
Does the dashboard use macros?
No, it works using standard Excel formulas and features.
Click to Purchases Aviation Maintenance KPI Dashboard in Excel
Visit our YouTube channel to learn step-by-step video tutorials