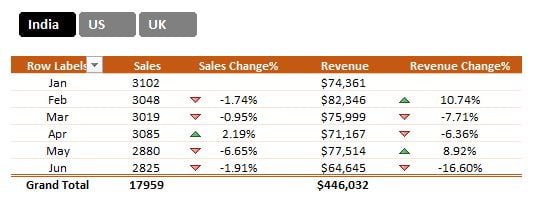
As we delve into data analytics, we often find ourselves in need of tools that allow us to decipher trends
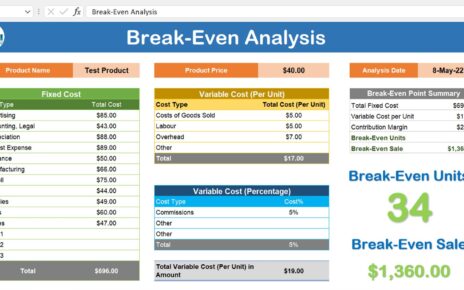
This is a ready to use Break-Even Analysis Template in Excel. You can use it as per your requirements. Break-Even
Managing customer experience in operations requires timely execution, proper scheduling, and complete visibility over planned activities. One small mistake or