Change Percentage in Pivot Table-7
06
Jul 2018
2640
PK
Meet PK, the founder of PK-AnExcelExpert.com! With over 15 years of experience in Data Visualization, Excel Automation, and dashboard creation. PK is a Microsoft Certified Professional who has a passion for all things in Excel. PK loves to explore new and innovative ways to use Excel and is always eager to share his knowledge with others. With an eye for detail and a commitment to excellence, PK has become a go-to expert in the world of Excel. Whether you're looking to create stunning visualizations or streamline your workflow with automation, PK has the skills and expertise to help you succeed. Join the many satisfied clients who have benefited from PK's services and see how he can take your Excel skills to the next level!
https://www.pk-anexcelexpert.com
Related Articles
Quality Control Tracking Checklist in Excel
Quality control is an essential part of any business that ensures products and services meet the required standards before reaching
Multiple KPIs Visualization in Excel
We have created an attractive visualization to display multiple KPI performance in Excel. We have used Excel auto shapes to
Dynamic Graph with Camera
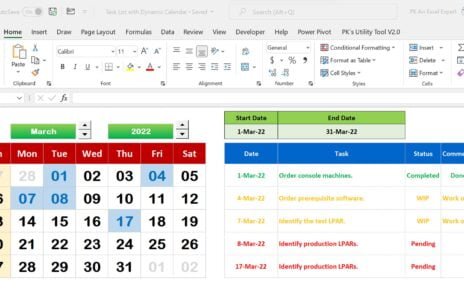
In this article, we have created a dynamic graph with Camera functionality of Excel. We have used conditional formatting in