The Library Services KPI Dashboard is a highly effective tool designed to track and evaluate the key performance indicators (KPIs)
Employee retention is one of the most significant challenges facing businesses today. A high turnover rate can be costly and
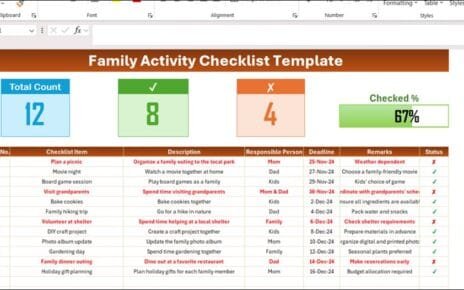
Managing family activities can really be a juggle, right? Especially when everyone’s running on different schedules. Fortunately, we've got something