Corporate event planning is a complex process, requiring organization, communication, and attention to detail. Whether you’re planning a small team-building event or a large conference, having a well-organized system to track the progress, costs, and performance of your events is essential. That’s where a Corporate Event Planning Dashboard in Excel comes in handy. In this article, we will walk you through the features, benefits, and best practices for using this powerful tool to streamline your event planning process.
Click to Purchases Corporate Event Planning Dashboard in Excel
What is a Corporate Event Planning Dashboard in Excel?
A Corporate Event Planning Dashboard in Excel is a customizable and interactive tool that helps event planners track and manage various aspects of their events. It consolidates all event-related data into one easy-to-navigate Excel file, offering insights into key metrics such as attendee numbers, costs, feedback scores, and more.
The dashboard consists of multiple pages, each focusing on a different aspect of event planning, making it easy to stay organized and on top of everything.
Key Features of the Corporate Event Planning Dashboard in Excel
-
Page Navigator: Located at the top of the dashboard, this feature allows quick access to different pages of the dashboard. It ensures that users can easily navigate between different sections without getting lost in the data.
Overview Page:
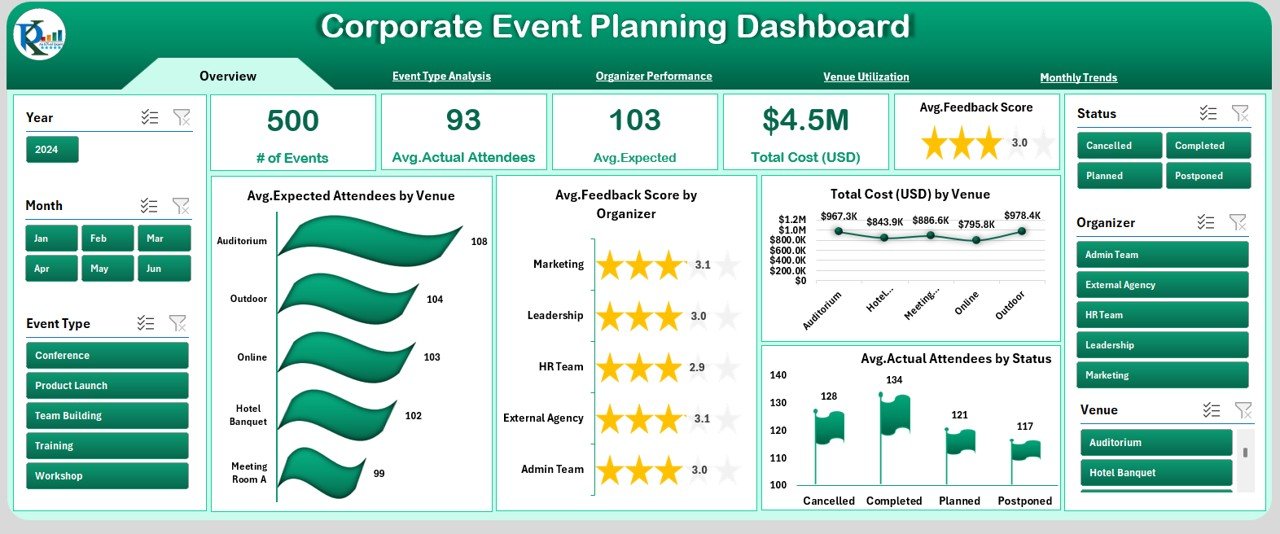
The main page of the dashboard, providing a high-level view of event statistics. The page includes several charts, such as:
Click to Purchases Corporate Event Planning Dashboard in Excel
- Avg. Expected Attendees by Venue
- Avg. Feedback Score by Organizer
- Total Cost (USD) by Venue
- Avg. Actual Attendees by Status
Event Type Analysis:
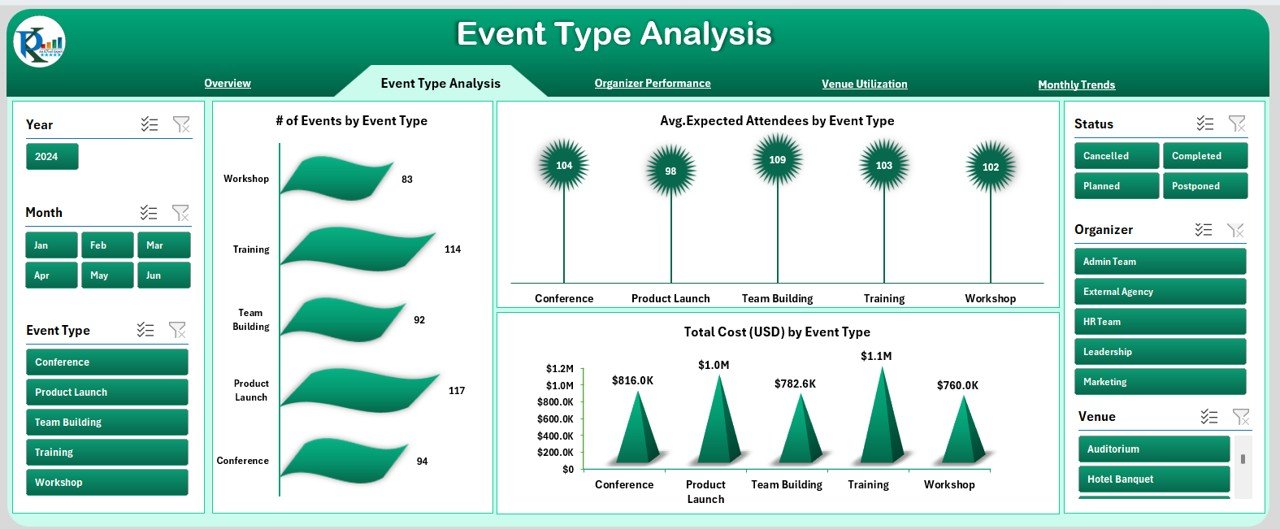
This page provides insights into the different types of events you are hosting. It includes charts like:
- of Events by Event Type
- Avg. Expected Attendees by Event Type
- Total Cost (USD) by Event Type
Organizer Performance:
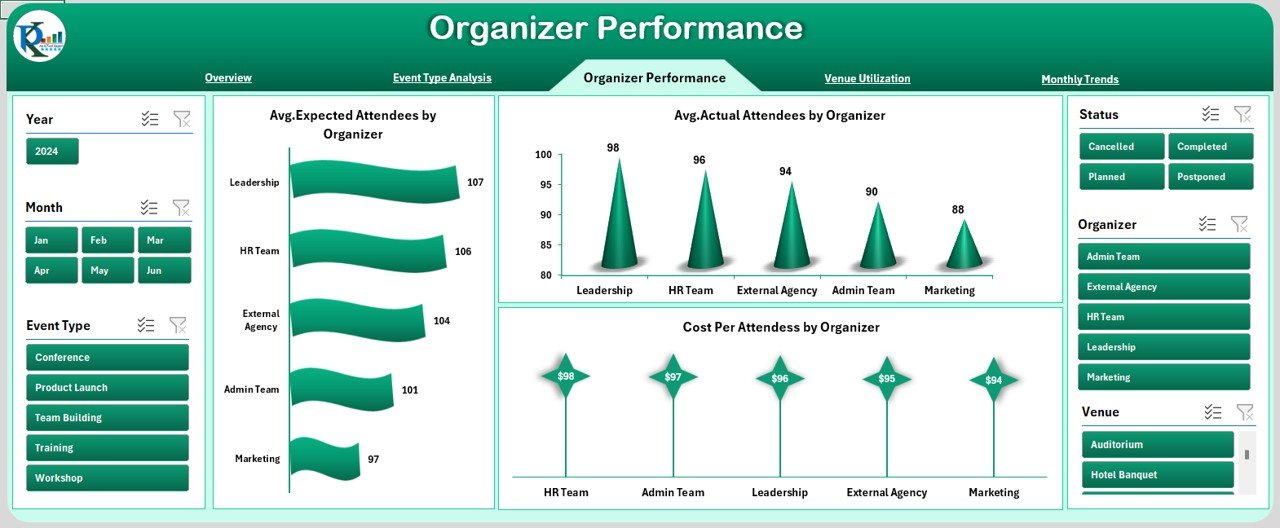
This section focuses on evaluating the performance of each event organizer. It tracks:
Click to Purchases Corporate Event Planning Dashboard in Excel
- Avg. Expected Attendees by Organizer
- Avg. Actual Attendees by Organizer
- Cost Per Attendee by Organizer
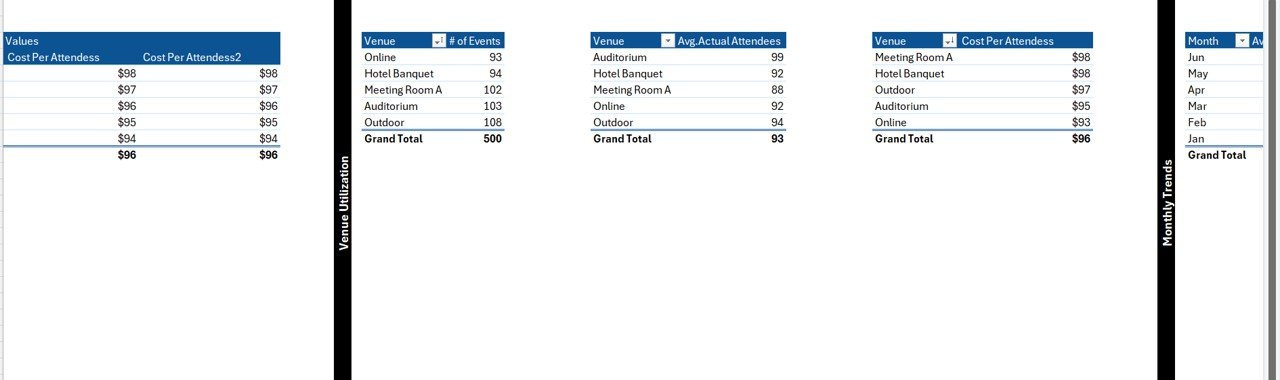
Venue Utilization:
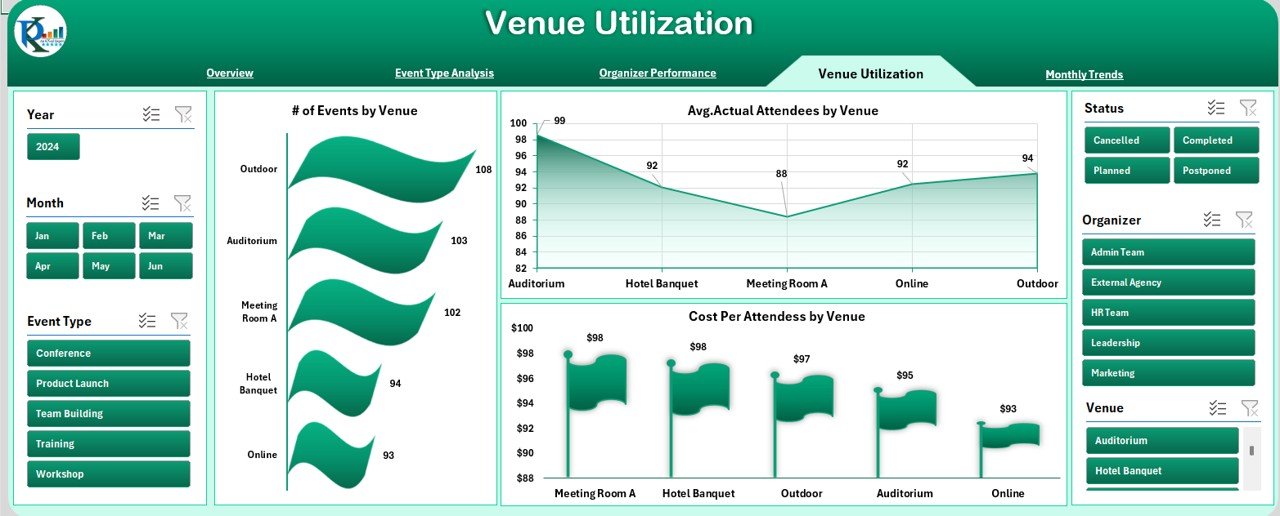
This page helps you analyze the utilization of various event venues. It includes charts such as:
- of Events by Venue
- Avg. Actual Attendees by Venue
- Cost Per Attendee by Venue
Monthly Trends:
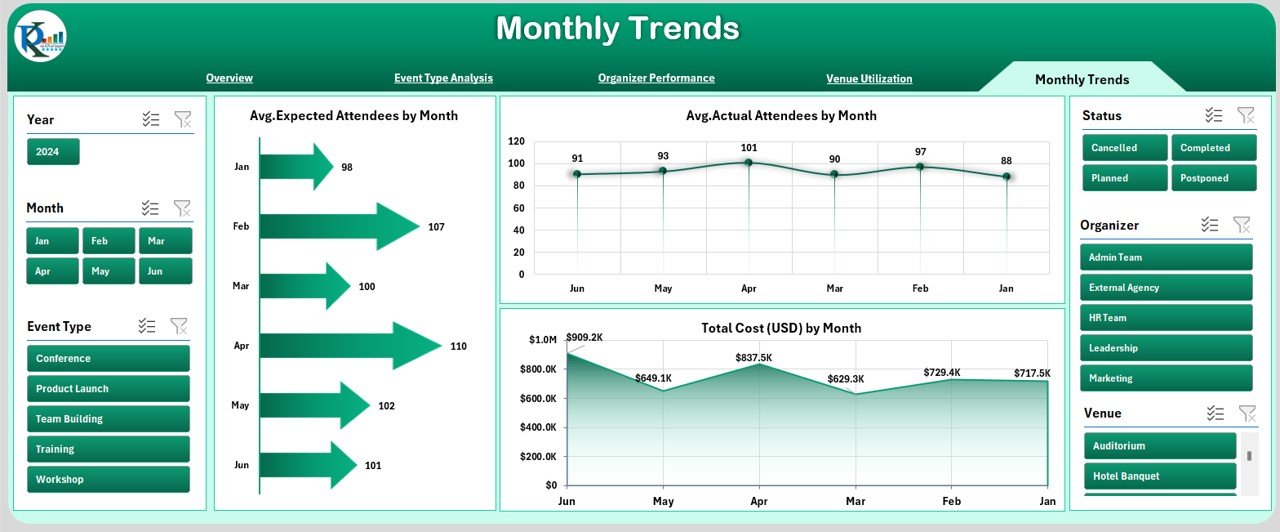
This page tracks monthly data trends, helping you identify patterns over time. It includes:
Click to Purchases Corporate Event Planning Dashboard in Excel
- Avg. Expected Attendees by Month
- Avg. Actual Attendees by Month
- Total Cost (USD) by Month
Data Sheet:
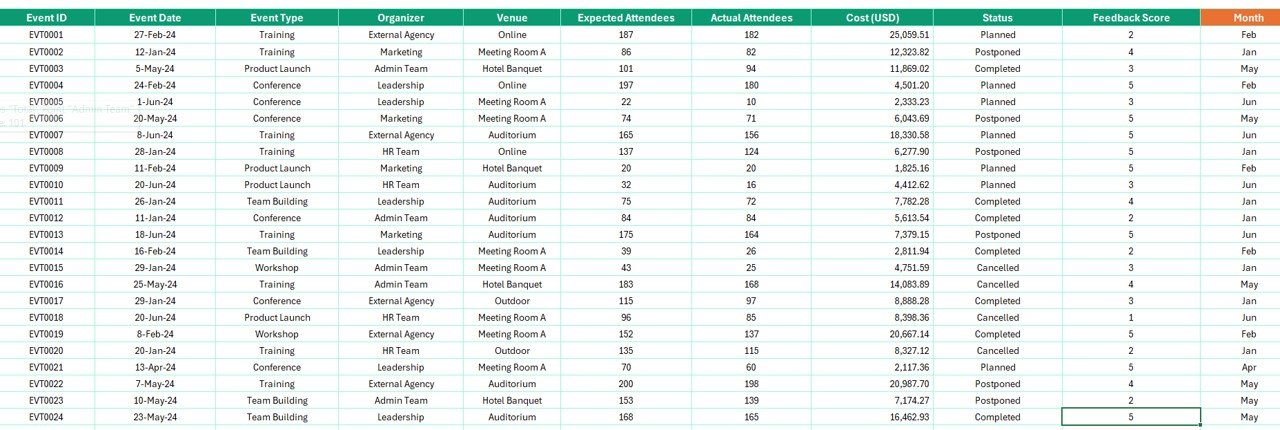
This sheet includes all the raw data necessary for the dashboard. It tracks:
- Booking Event ID, Event Date, Event Type, Organizer, Venue, Expected Attendees, Actual Attendees, Cost (USD), Status, Feedback Score, Month, and Year.
Support Sheet:
The support sheet provides additional information and insights to ensure the smooth operation of the dashboard.
Advantages of Using a Corporate Event Planning Dashboard in Excel
A Corporate Event Planning Dashboard in Excel offers a variety of benefits, making event management easier and more efficient. Here are some of the key advantages:
-
Centralized Data: All your event data is stored in one place, making it easy to access and manage. You don’t need to search through multiple files or software platforms to get the information you need.
-
Real-Time Analysis: The dashboard updates automatically as you enter new data, allowing you to see real-time metrics and performance. This makes it easier to make informed decisions on the fly.
-
Customization: The Excel dashboard is highly customizable to suit your specific needs. You can add new charts, data points, or filters to make it more relevant to your business.
-
Cost-Effectiveness: Since Excel is widely available and cost-effective, using it for event planning reduces the need for expensive software or specialized tools.
-
Performance Tracking: With detailed performance tracking for organizers, venues, and event types, the dashboard provides valuable insights that help you improve your future events.
-
Clear Visualization: The use of charts and graphs makes complex data more understandable. This helps stakeholders quickly grasp the key insights and trends without sifting through raw numbers.
Best Practices for Using a Corporate Event Planning Dashboard in Excel
To make the most of your Corporate Event Planning Dashboard, it’s important to follow some best practices. Here are a few tips to help you get started:
1. Keep Your Data Updated
Regularly update your data to ensure that the dashboard reflects the most accurate and up-to-date information. The more frequently you update the dashboard, the more valuable the insights will be.
2. Customize for Your Needs
Tailor the dashboard to match your specific event planning needs. For example, if you manage both large conferences and smaller team-building events, adjust the charts to reflect the differences in scale and focus.
3. Use Data Validation
Ensure that all the data entered into the dashboard is valid. Excel offers data validation features that can help prevent errors by restricting the type of data that can be entered in certain cells.
4. Leverage PivotTables and PivotCharts
PivotTables and PivotCharts are powerful tools within Excel that allow you to analyze your data in greater detail. Use them to filter, group, and summarize data for deeper insights.
5. Collaborate with Your Team
Excel makes it easy to share your dashboard with team members. By collaborating in real-time, everyone can stay on the same page and make decisions based on the same information.
6. Review Performance Regularly
Make it a habit to review the dashboard regularly to track the progress of ongoing events and evaluate the success of completed ones. This will help you identify areas for improvement and set better targets for future events.
How Can You Optimize the Corporate Event Planning Dashboard for Better Performance?
While the Corporate Event Planning Dashboard is designed to streamline event management, it’s important to optimize it for better performance and efficiency. Here are a few suggestions:
-
Minimize File Size: Large Excel files can become slow to open and navigate. Reduce the file size by removing unnecessary data, keeping formulas efficient, and saving the file in a compressed format.
-
Use Conditional Formatting: Highlight key metrics such as over-budget costs or under-attended events using conditional formatting. This will help you quickly identify potential issues.
-
Link Data Sources: If you’re working with large datasets, consider linking your dashboard to external data sources (such as Google Sheets or an online event management tool). This will automate data entry and reduce manual effort.
-
Protect Your Data: Protect sensitive data by using Excel’s password protection features. This will ensure that only authorized team members can access or edit the dashboard.
Conclusion
A Corporate Event Planning Dashboard in Excel is an invaluable tool for event managers looking to improve efficiency and stay organized. By consolidating key metrics into one easy-to-use platform, it helps streamline the event planning process and provides valuable insights into the performance of events. Whether you’re managing a large corporate conference or a small team event, this dashboard can help you make informed decisions, optimize resources, and ultimately create successful events.
Frequently Asked Questions (FAQs)
1. What are the key benefits of using a Corporate Event Planning Dashboard?
-
The key benefits include centralized data, real-time analysis, customization, cost-effectiveness, performance tracking, and clear visualizations.
2. Can I customize the Corporate Event Planning Dashboard for my specific needs?
-
Yes, the Excel dashboard is highly customizable. You can add new charts, data points, or filters to suit your event planning requirements.
3. How can I ensure my data is accurate in the dashboard?
-
Regularly update the data, use Excel’s data validation features, and cross-check with your team to ensure accuracy.
4. Is it difficult to share the Corporate Event Planning Dashboard with others?
-
No, Excel makes it easy to share your dashboard with team members, either by sending the file directly or sharing it via a cloud service like OneDrive.
5. How often should I update the Corporate Event Planning Dashboard?
-
You should update the dashboard regularly, ideally after each event or when new data becomes available. This ensures you have the most accurate and up-to-date insights.
Click to Purchases Corporate Event Planning Dashboard in Excel
Visit our YouTube channel to learn step-by-step video tutorials