In today’s highly regulated environment, customer service and support teams must do more than just resolve queries—they must comply with a range of regulations and policies. Compliance ensures not only customer satisfaction but also protects the company from legal issues, fines, and reputational damage. One of the best ways to monitor and manage this compliance effectively is through a Regulatory Adherence KPI Dashboard built in Excel.
This article explores everything you need to know about the Customer Service and Support Regulatory Adherence KPI Dashboard in Excel—its features, benefits, best practices, and more.
Click to Purchases Customer Service and Support Regulatory Adherence KPI Dashboard in Excel
What is a Regulatory Adherence KPI Dashboard in Excel?
A Regulatory Adherence KPI Dashboard in Excel is a smart, ready-to-use template that tracks your compliance-related key performance indicators (KPIs) across customer service functions. It enables you to:
-
Measure adherence to internal and external regulations
-
Visualize KPI trends and gaps
-
Analyze monthly and yearly performance
-
Maintain full control—all within Microsoft Excel
This tool is ideal for customer service managers, compliance officers, and support analysts who want visibility into how well their teams follow required standards.
Key Features of the Dashboard
The dashboard includes 7 powerful worksheet tabs, each playing a specific role in tracking and visualizing regulatory KPIs:
Home Sheet
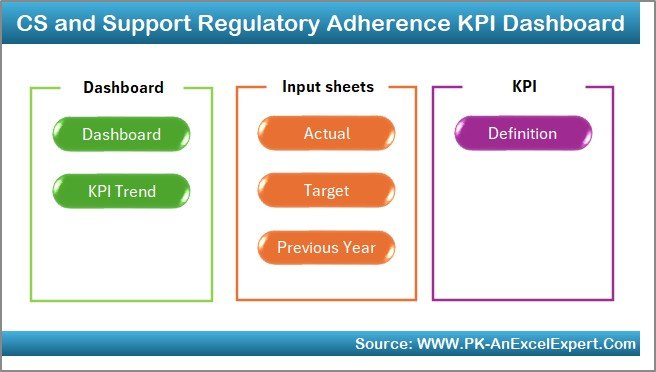
This is the index sheet of the template. It features six buttons that allow users to jump to different parts of the dashboard instantly. It simplifies navigation and improves user experience.
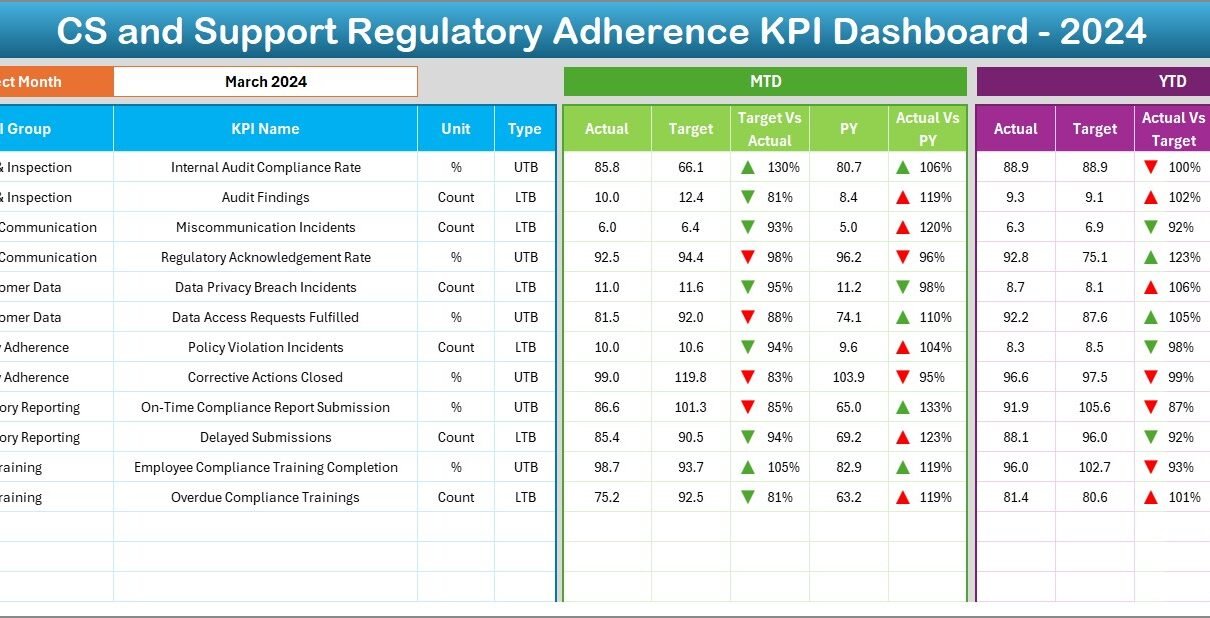
Dashboard Sheet
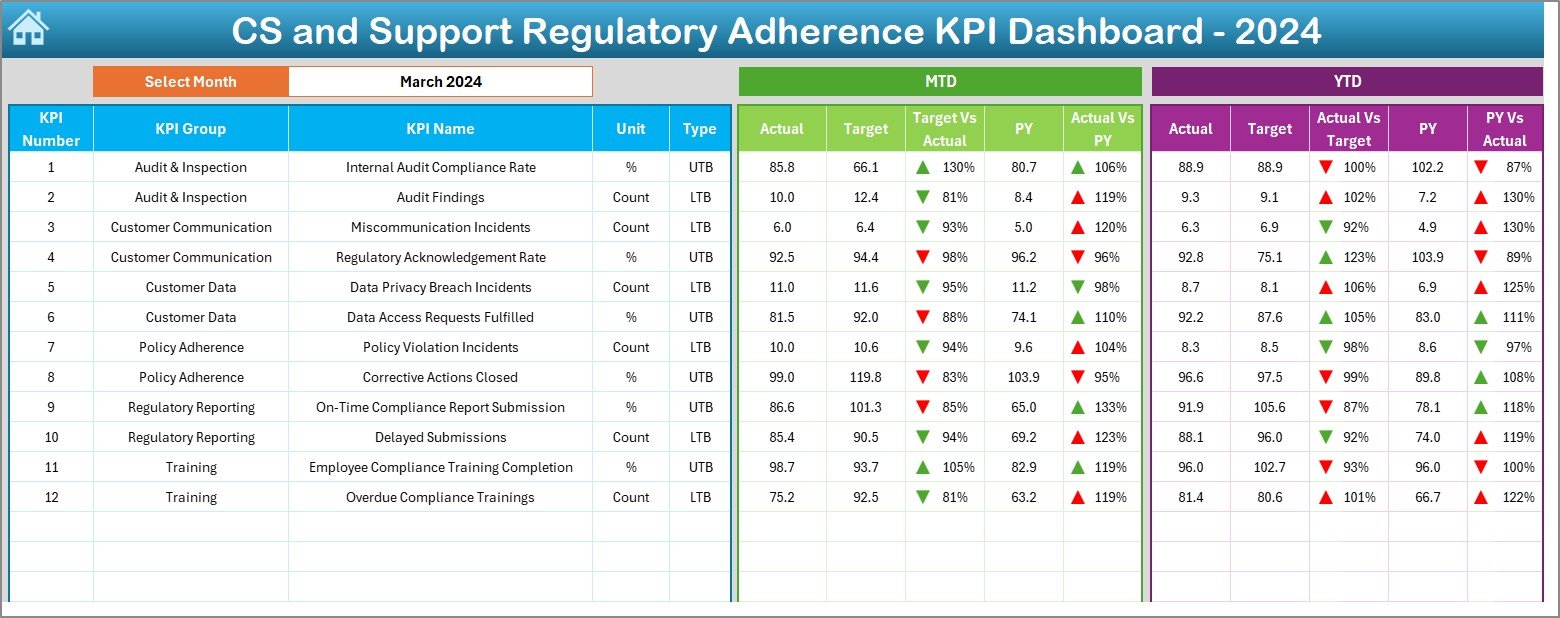
This is the main visualization tab, where all the important compliance data is presented.
-
At cell D3, you can select the month from a dropdown.
-
All KPI values—MTD Actual, Target, and Previous Year (PY)—automatically update.
-
Conditional formatting highlights whether KPIs are met using up/down arrows for quick insights.
-
It also presents YTD metrics, showing cumulative performance with similar visual indicators.
KPI Trend Sheet
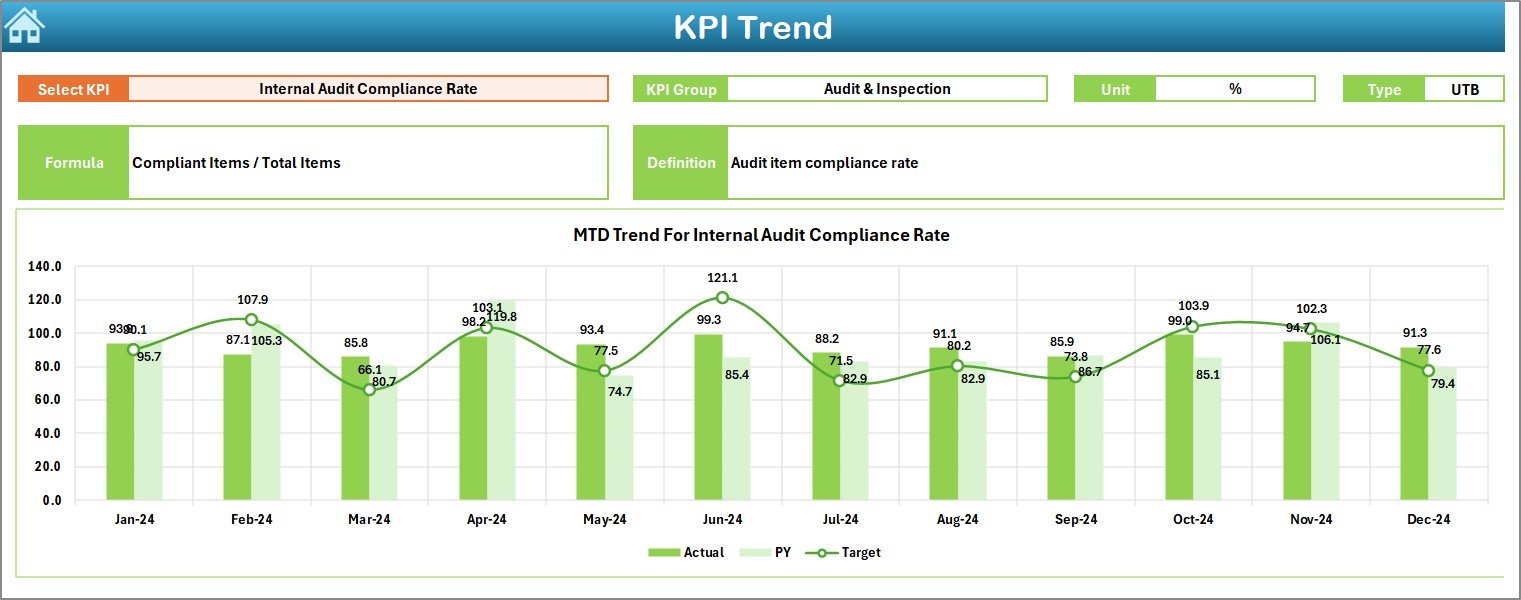
This sheet allows in-depth trend analysis.
-
Users can select a KPI name from cell C3.
-
It displays the KPI Group, Unit, Type (UTB or LTB), Formula, and Definition.
-
Visual trend charts show MTD and YTD movement over time.
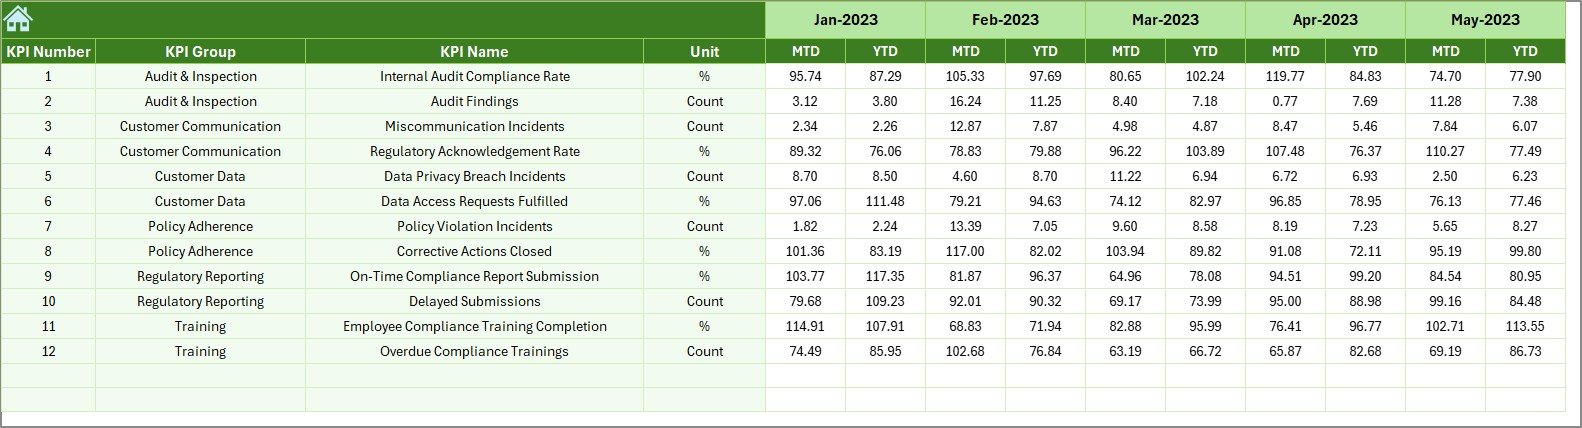
Actual Numbers Input
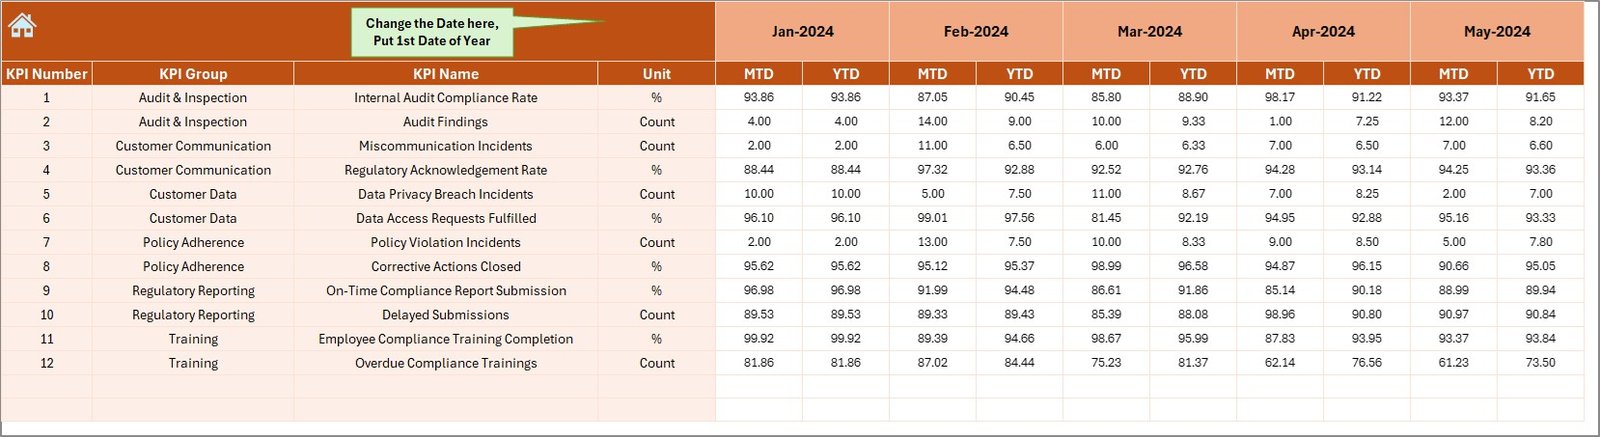
This is where monthly performance data is entered.
-
Enter the actual MTD and YTD figures.
-
Use cell E1 to set the first month of the financial year.
-
The dashboard and charts update automatically based on this input.
Target Sheet
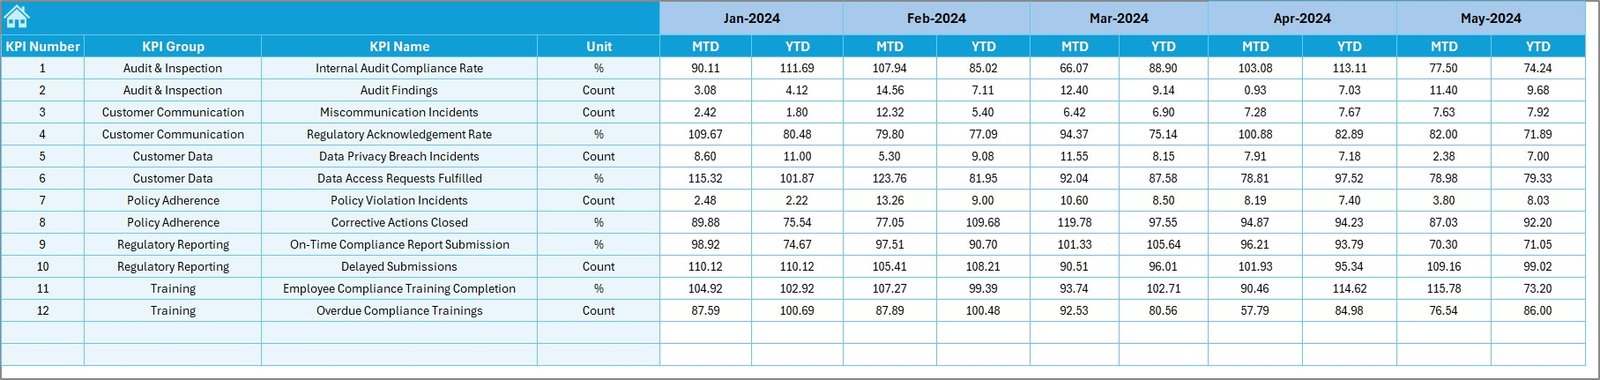
You define your compliance targets in this tab.
-
Enter MTD and YTD goals for each KPI.
-
These values are directly linked to the dashboard’s visual and trend comparison.
Click to Purchases Customer Service and Support Regulatory Adherence KPI Dashboard in Excel
Previous Year Numbers
This sheet holds historical data for reference.
-
Enter PY values for each KPI.
-
These are used in the dashboard for year-over-year comparison.
KPI Definition Sheet
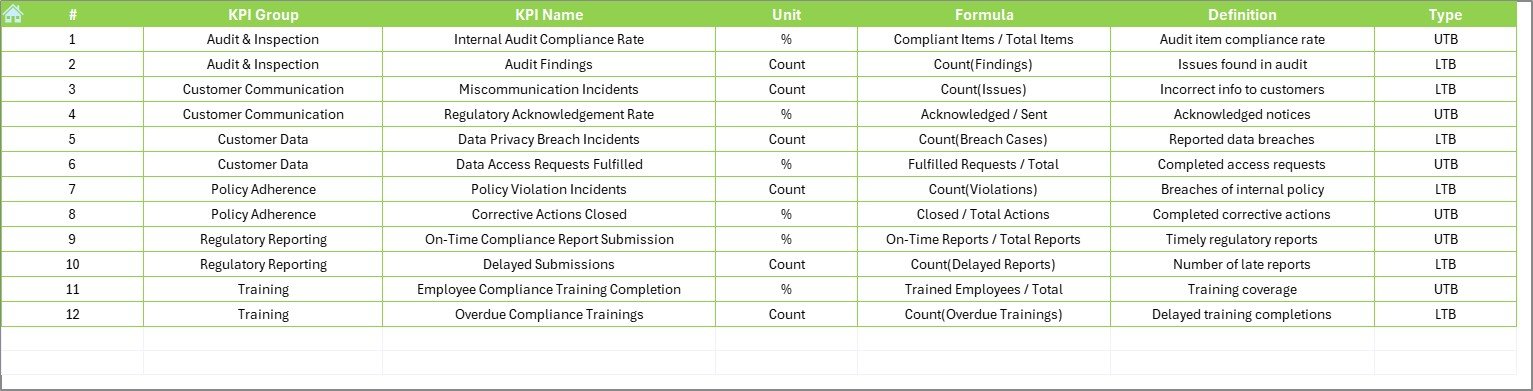
Document the logic behind your performance metrics.
-
Enter KPI Name, KPI Group, Unit, Formula, and a brief Definition.
-
The information auto-populates in the trend and dashboard sheets for clarity.
Why Use a Regulatory Adherence KPI Dashboard in Excel?
Many organizations still rely on manual tracking, emails, or complex compliance tools. Here’s why this Excel-based solution stands out:
✅ Ready to Use: Just enter your data—no need for custom coding.
✅ Excel-Based: No need to purchase or learn complex tools.
✅ Visual Alerts: Conditional formatting helps spot issues quickly.
✅ Historical Trends: Compare current compliance with previous year’s performance.
✅ Fully Editable: Customize KPIs or visuals according to your needs.
How Does It Work?
Let’s break down the workflow step-by-step:
-
Define KPIs in the KPI Definition Sheet.
-
Set monthly targets in the Target Sheet.
-
Enter actual performance data in the Actual Numbers Input tab.
-
Add previous year’s numbers to track progress and improvement.
-
Select a month on the dashboard, and instantly view compliance stats and visual indicators.
-
Track trends over time with dynamic line charts and KPI comparisons.
Advantages of Customer Service and Support Regulatory Adherence KPI Dashboard
Implementing this dashboard brings numerous benefits:
📈 Improved Compliance Monitoring
Track all regulatory adherence KPIs from one place.
📊 Better Decision-Making
Understand gaps and take quick action using real-time visuals.
🕒 Saves Time and Effort
No need to generate reports manually every month.
💼 Audit Ready
Keep records organized and easily accessible for internal or external audits.
🧠 Informed Teams
Help your support teams stay on top of compliance expectations.
Key KPIs Tracked in This Dashboard
You can customize KPIs based on your organizational needs. Common regulatory KPIs include:
-
Compliance Rate (%)
-
Escalation Rate due to Policy Violations
-
Average Response Time to Regulatory Inquiries
-
Time to Resolve Complaints
-
Audit Findings Count
-
Error Rate in Documentation
-
Training Completion Rate
-
Policy Acknowledgment Rate
-
Customer Identity Verification Rate
-
Record Retention Accuracy
Each KPI can be marked as LTB (Lower the Better) or UTB (Upper the Better).
Click to Purchases Customer Service and Support Regulatory Adherence KPI Dashboard in Excel
Best Practices for Using This Dashboard
To make the most out of this dashboard, follow these best practices:
🔁 Update Regularly: Keep actuals and targets up to date every month.
🔍 Review Conditional Formatting: Use the arrow indicators to quickly catch issues.
🧾 Validate Data: Double-check input sheets to avoid errors.
📚 Train Staff: Make sure the team knows how to interpret KPI metrics.
📈 Use Historical Insights: Leverage PY comparisons for year-over-year performance improvement.
📥 Backup Files: Save versions monthly for audit tracking.
Use Cases Across Industries
Although this dashboard is built for customer service and support, you can adapt it for:
-
Healthcare compliance monitoring
-
Banking and financial services adherence
-
Telecom support regulatory tracking
-
Insurance customer service compliance
-
Retail grievance handling standards
Its Excel foundation makes it flexible enough to suit any industry.
How Is This Dashboard Different from Others?
This dashboard doesn’t just collect data—it turns it into actionable insights. Here’s how it stands out:
🟩 Color-coded insights for quick decisions
📊 Monthly and yearly comparisons in one view
🔄 One-click navigation using dashboard buttons
💡 Built-in logic for LTB and UTB KPIs
📁 Excel-only tool—no external plugins needed
Who Should Use This Tool?
The dashboard is ideal for:
✅ Customer Service Managers monitoring regulatory SLAs
✅ Compliance Officers ensuring internal audit readiness
✅ Operations Heads wanting consistent adherence across regions
✅ Team Leaders driving training and process corrections
✅ Support Analysts preparing monthly or quarterly reports
Conclusion
Regulatory adherence is not just a legal requirement—it’s a customer service promise. Using the Customer Service and Support Regulatory Adherence KPI Dashboard in Excel, you can stay compliant, track critical KPIs, and improve team accountability.
Whether you manage a small support team or run a global operation, this tool gives you the transparency and control needed to ensure your service teams are always aligned with regulatory expectations.
Frequently Asked Questions (FAQs)
1. Can I customize the KPIs in the dashboard?
Yes. The KPI Definition sheet allows full customization—add or remove KPIs based on your organization’s requirements.
2. Do I need Excel macros to use this dashboard?
No. This dashboard works entirely with Excel formulas and drop-downs—no macros required.
3. Is this suitable for non-technical users?
Absolutely. The dashboard is user-friendly and designed for users with basic Excel knowledge.
4. Can I add charts or visuals beyond what’s included?
Yes. Since it’s Excel-based, you can insert your own visuals or even link it to Power BI if needed.
5. What if my reporting period starts in April instead of January?
You can adjust the start month in the Actual Numbers Input sheet at cell E1 to match your financial calendar.
6. Can this be used for compliance audits?
Yes. It helps you prepare for internal and external audits by keeping track of adherence metrics.
Visit our YouTube channel to learn step-by-step video tutorials