Derivatives trading involves high volumes, rapid market movements, and constant exposure to risk. Therefore, trading teams, risk managers, and leadership always need clear, real-time visibility into performance. However, when data remains scattered across spreadsheets, reports, and emails, monitoring performance becomes slow and error-prone.
That is exactly where a Derivatives Trading KPI Dashboard in Power BI becomes a powerful and practical solution.
In this in-depth, SEO-friendly article, you will learn what a Derivatives Trading KPI Dashboard in Power BI is, why it is important, how it works, its page-wise structure, key features, advantages, opportunities for improvement, best practices, and frequently asked questions. Moreover, this guide uses simple language, clear logic, and real-world explanations so that professionals can easily understand and implement it.
Click to Purchases Derivatives Trading KPI Dashboard in Power BI
What Is a Derivatives Trading KPI Dashboard in Power BI?
A Derivatives Trading KPI Dashboard in Power BI is a centralized, interactive reporting tool designed to track, analyze, and monitor key performance indicators related to derivatives trading activities.
Instead of manually reviewing multiple spreadsheets, this dashboard consolidates actuals, targets, and historical data into one visual interface. As a result, decision-makers gain instant clarity on performance trends, target achievement, and year-over-year comparisons.
Moreover, this dashboard uses Power BI for visualization and Excel as the data source, which makes it both powerful and easy to maintain.
Why Do Trading Teams Need a Derivatives Trading KPI Dashboard?
Derivatives markets move fast. Therefore, teams must track performance continuously, not monthly or quarterly.
Without a structured dashboard:
-
KPI performance remains unclear
-
Target deviations go unnoticed
-
Year-over-year comparisons take too much time
-
Decisions rely on assumptions instead of data
However, with a Derivatives Trading KPI Dashboard in Power BI, teams can:
-
Monitor MTD and YTD performance instantly
-
Compare actuals against targets and previous years
-
Identify underperforming KPIs early
-
Improve risk management and accountability
As a result, organizations move from reactive decision-making to proactive control.
How Does a Derivatives Trading KPI Dashboard in Power BI Work?
The dashboard works through a simple yet powerful data flow.
First, users enter KPI data in structured Excel sheets. Then, Power BI connects to this Excel file and automatically refreshes visuals.
The workflow looks like this:
-
Enter Actual data in Excel
-
Enter Target data in Excel
-
Define KPIs in the KPI Definition sheet
-
Refresh Power BI
-
Analyze performance through interactive visuals
Because of this design, users do not need advanced Power BI skills to maintain the dashboard.
Click to Purchases Derivatives Trading KPI Dashboard in Power BI
What Is the Data Source for This Dashboard?
This dashboard uses Excel as the primary data source, which makes it flexible and user-friendly.
You need to maintain three structured worksheets in Excel:
1) Input_Actual Sheet
In this sheet, you enter:
-
KPI Name
-
Month (use the first date of the month)
-
Actual CY MTD value
-
Actual CY YTD value
This sheet captures the real performance numbers.
2) Input_Target Sheet
In this sheet, you enter:
-
KPI Name
-
Month (first date of the month)
-
Target CY MTD value
-
Target CY YTD value
This sheet defines expected performance levels.
3) KPI Definition Sheet
This sheet provides context and structure. You fill:
-
KPI Number
-
KPI Group
-
KPI Name
-
Unit of Measurement
-
Formula
-
Definition
-
KPI Type (LTB or UTB)
Because of this sheet, users always understand what each KPI means and how it is calculated.
Click to Purchases Derivatives Trading KPI Dashboard in Power BI
What Are the Pages in the Derivatives Trading KPI Dashboard in Power BI?
This dashboard contains three well-structured pages, each designed for a specific analytical purpose.
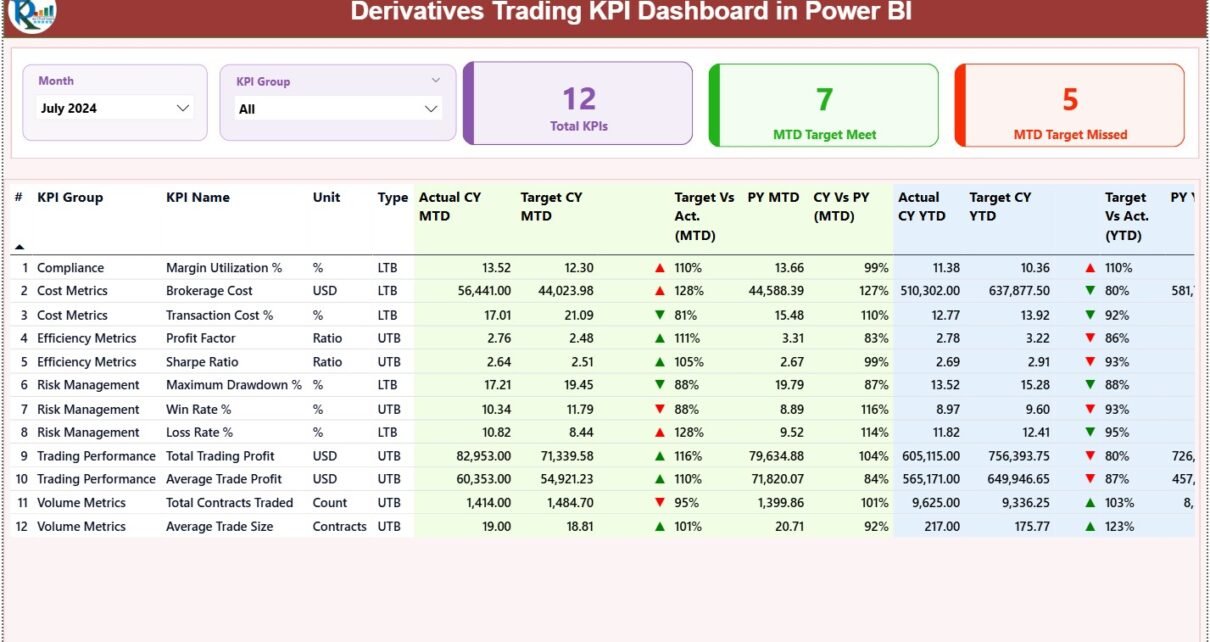
1) Summary Page – How Do You Get an Overall Performance View?
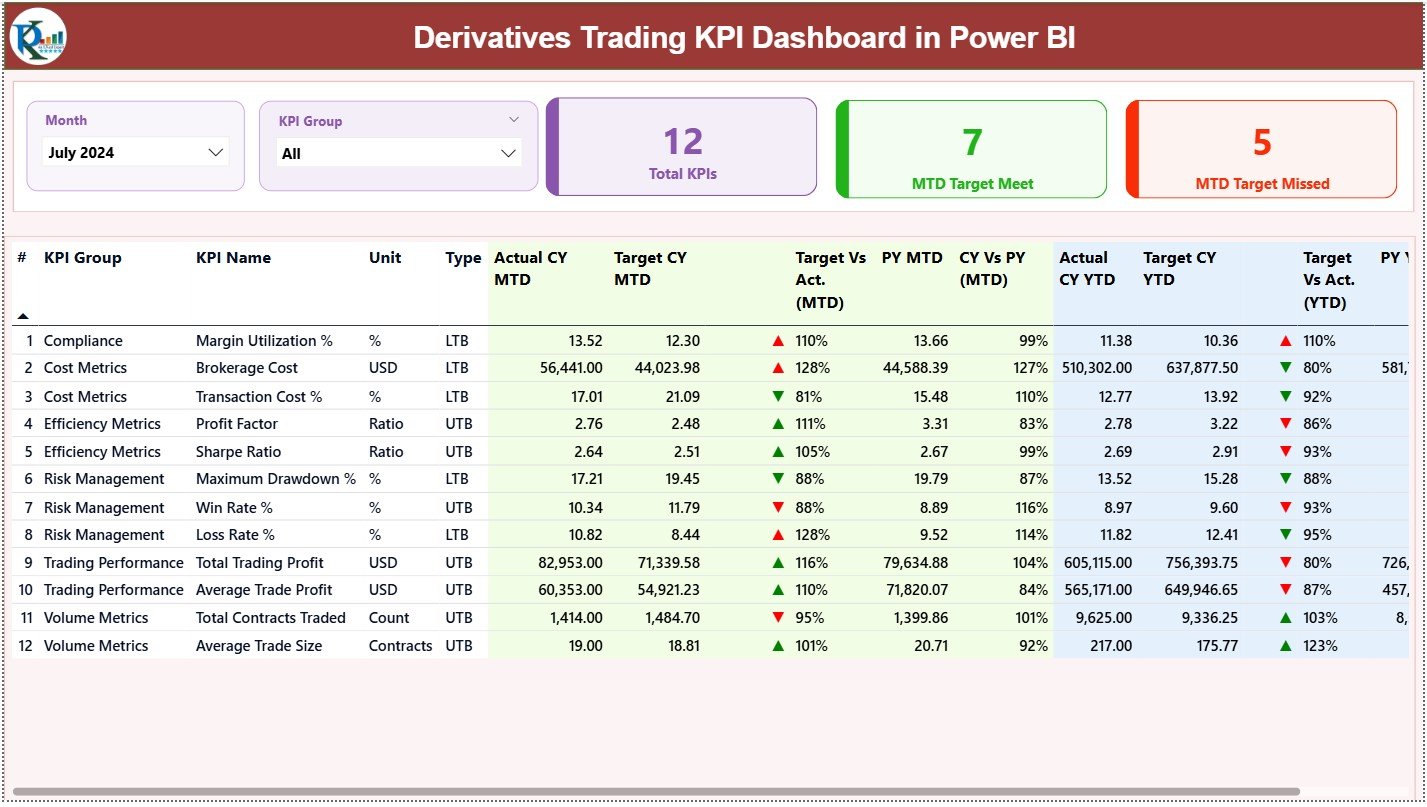
The Summary Page acts as the main control center of the dashboard.
Slicers Available
At the top of the page, you can select:
-
Month
-
KPI Group
As soon as you change these slicers, the entire dashboard updates instantly.
KPI Cards on the Summary Page
The dashboard shows three key KPI cards:
-
Total KPIs Count
-
MTD Target Met Count
-
MTD Target Missed Count
These cards provide an instant snapshot of performance health.
Detailed KPI Performance Table
Below the cards, the dashboard displays a detailed table with the following columns:
-
KPI Number – Sequence number of the KPI
-
KPI Group – Category or classification of the KPI
-
KPI Name – Name of the KPI
-
Unit – Unit of measurement
-
Type – LTB (Lower the Better) or UTB (Upper the Better)
MTD Performance Metrics
The table includes:
-
Actual CY MTD
-
Target CY MTD
-
MTD Icon (▲ / ▼) with green and red indicators
-
Target vs Actual (MTD) calculated as:
Actual MTD / Target MTD -
PY MTD
-
CY vs PY (MTD) calculated as:
CY MTD / PY MTD
YTD Performance Metrics
The table also shows:
-
Actual CY YTD
-
Target CY YTD
-
YTD Icon (▲ / ▼) with color indicators
-
Target vs Actual (YTD) calculated as:
Actual YTD / Target YTD -
PY YTD
-
CY vs PY (YTD) calculated as:
CY YTD / PY YTD
Because of this structure, users can analyze short-term and long-term performance in one place.
2) KPI Trend Page – How Do You Track Performance Over Time?
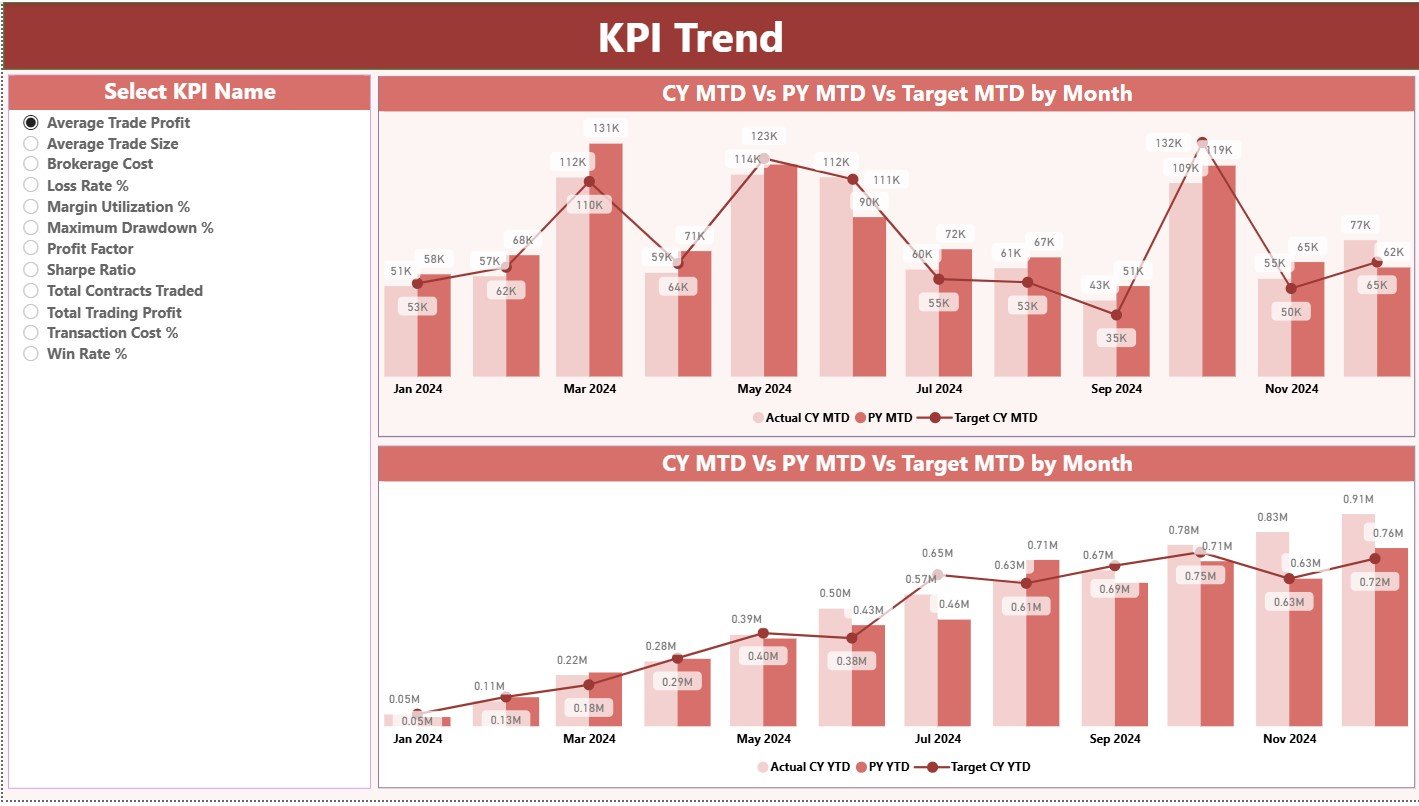
The KPI Trend Page focuses on time-based analysis.
What Does This Page Show?
This page displays two combo charts:
-
MTD trend: Actual CY, PY, and Target
-
YTD trend: Actual CY, PY, and Target
These charts clearly show performance movement over time.
KPI Selection Slicer
On the left side, you can select a specific KPI name.
Once selected, both charts update automatically.
As a result, users can:
-
Identify performance patterns
-
Detect volatility
-
Compare current trends with previous years
3) KPI Definition Page – Where Do You Find KPI Details?
The KPI Definition Page works as a drill-through page.
Key Highlights
-
This page remains hidden from the main navigation
-
Users can drill through from the Summary Page
-
It displays KPI Formula and Definition
Moreover, a Back button on the top-left corner allows users to return to the Summary Page easily.
What Makes This Derivatives Trading KPI Dashboard in Power BI Unique?
This dashboard stands out because it combines:
-
Structured KPI logic
-
Target vs Actual analysis
-
MTD and YTD tracking
-
Previous Year comparisons
-
Excel-driven simplicity
-
Power BI visualization power
As a result, it serves both operational teams and leadership effectively.
Advantages of Derivatives Trading KPI Dashboard in Power BI
Using this dashboard delivers several measurable benefits.
✅ Advantages
-
Centralized performance tracking across all derivative KPIs
-
Instant visibility into target achievement and gaps
-
Clear MTD and YTD analysis for short-term and long-term insights
-
Year-over-year comparison for trend evaluation
-
Visual KPI status indicators using arrows and colors
-
Easy maintenance through Excel data entry
-
Improved decision-making with data-driven insights
-
Reduced manual reporting effort
-
Better accountability across KPI owners
Opportunities for Improvement in Derivatives Trading KPI Dashboard
Although this dashboard is powerful, continuous improvement always adds value.
🔹 Opportunities for Improvement
-
Add risk exposure and Greeks-based KPIs
-
Include PnL attribution analysis
-
Introduce daily granularity in addition to MTD and YTD
-
Add alerts for threshold breaches
-
Integrate live market data feeds
-
Include segment-wise analysis by instrument or exchange
These improvements can further enhance analytical depth.
Click to Purchases Derivatives Trading KPI Dashboard in Power BI
Best Practices for the Derivatives Trading KPI Dashboard in Power BI
Following best practices ensures accuracy, reliability, and usability.
⭐ Best Practices
-
Use clear and consistent KPI definitions
-
Maintain clean and validated Excel data
-
Update Actual and Target data regularly
-
Keep KPI Groups well structured
-
Use LTB and UTB logic consistently
-
Limit KPI count to what truly matters
-
Review PY comparison logic periodically
-
Train users on slicers and drill-through features
-
Schedule regular dashboard reviews
When teams follow these practices, dashboard value increases significantly.
Who Should Use a Derivatives Trading KPI Dashboard in Power BI?
This dashboard benefits multiple roles across the organization.
Ideal Users
-
Derivatives Traders
-
Trading Desk Managers
-
Risk Management Teams
-
Portfolio Managers
-
Finance and Performance Analysts
-
Senior Management and Leadership
Because of its flexible design, both small teams and large trading organizations can use it effectively.
How Does This Dashboard Improve Decision-Making?
This dashboard improves decisions by:
-
Highlighting performance gaps early
-
Showing trends instead of static numbers
-
Enabling quick root-cause analysis
-
Supporting data-backed strategy changes
As a result, organizations gain speed, clarity, and confidence in trading decisions.
Conclusion
A Derivatives Trading KPI Dashboard in Power BI transforms complex trading data into clear, actionable insights. By combining structured Excel data with interactive Power BI visuals, this dashboard delivers complete visibility into MTD, YTD, target performance, and year-over-year trends.
Moreover, it reduces manual effort, improves accountability, and supports smarter decision-making. Whether you manage a trading desk or oversee enterprise-level performance, this dashboard acts as a reliable control panel for derivatives trading success.
Click to Purchases Derivatives Trading KPI Dashboard in Power BI
Frequently Asked Questions (FAQs)
1) What is the main purpose of a Derivatives Trading KPI Dashboard in Power BI?
The main purpose is to track, analyze, and monitor derivatives trading KPIs in a centralized and visual format.
2) Can I update the dashboard without Power BI expertise?
Yes. You only need to update the Excel input sheets and refresh Power BI.
3) What KPIs can I track in this dashboard?
You can track any derivatives-related KPI such as volume, exposure, PnL metrics, efficiency ratios, or risk indicators.
4) Does the dashboard support MTD and YTD analysis?
Yes. The dashboard fully supports both MTD and YTD performance tracking.
5) Can I compare current performance with the previous year?
Yes. The dashboard includes CY vs PY comparison for both MTD and YTD.
6) Is this dashboard suitable for large trading organizations?
Yes. The structure scales easily with more KPIs and data.
7) Can I customize KPI groups and definitions?
Absolutely. You can modify them directly in the KPI Definition Excel sheet.
Click to Purchases Derivatives Trading KPI Dashboard in Power BI
Visit our YouTube channel to learn step-by-step video tutorials