In today’s fast-paced work environment, project managers and team leaders need tools that can streamline task management, ensure accountability, and
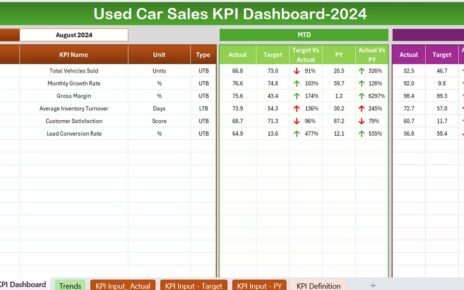
In today's competitive used car market, leveraging data effectively can be the difference between success and stagnation. A well-structured Key
Managing annual leaves of employees is a crucial task for every organization. It is essential to track employee leaves efficiently