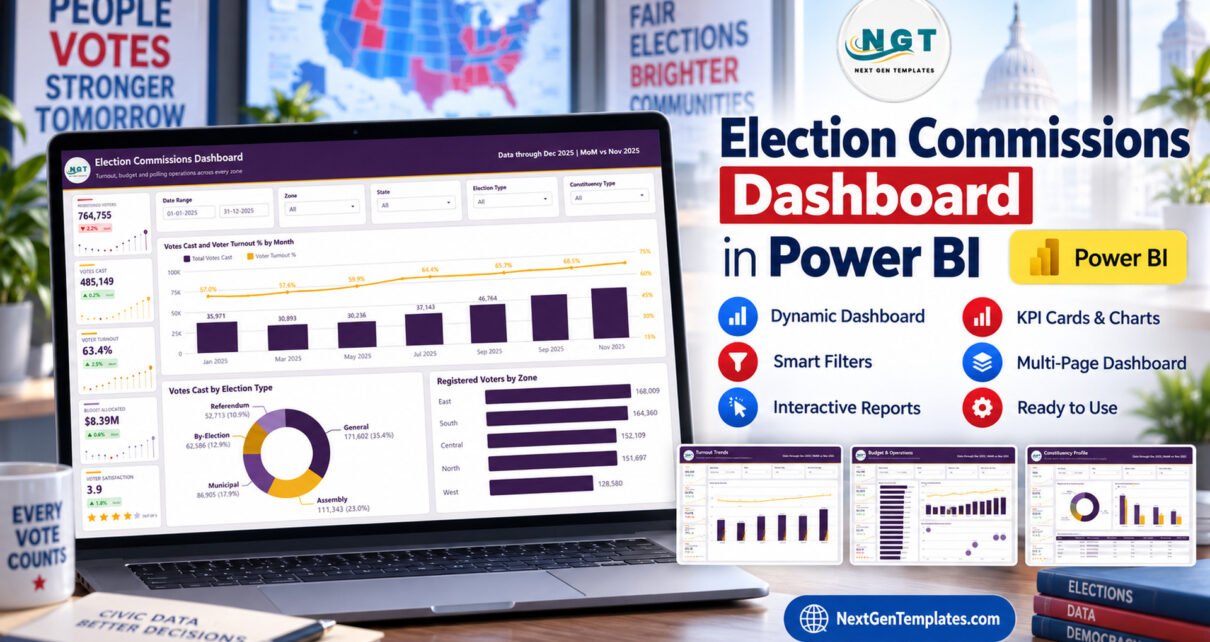
Election Commissions Dashboard in Power BI provides a five-page structure for reviewing entered voter, turnout, polling, budget, complaint, audit, and result-status data. It is intended for demonstration and internal reporting—not official election operations or public certification.
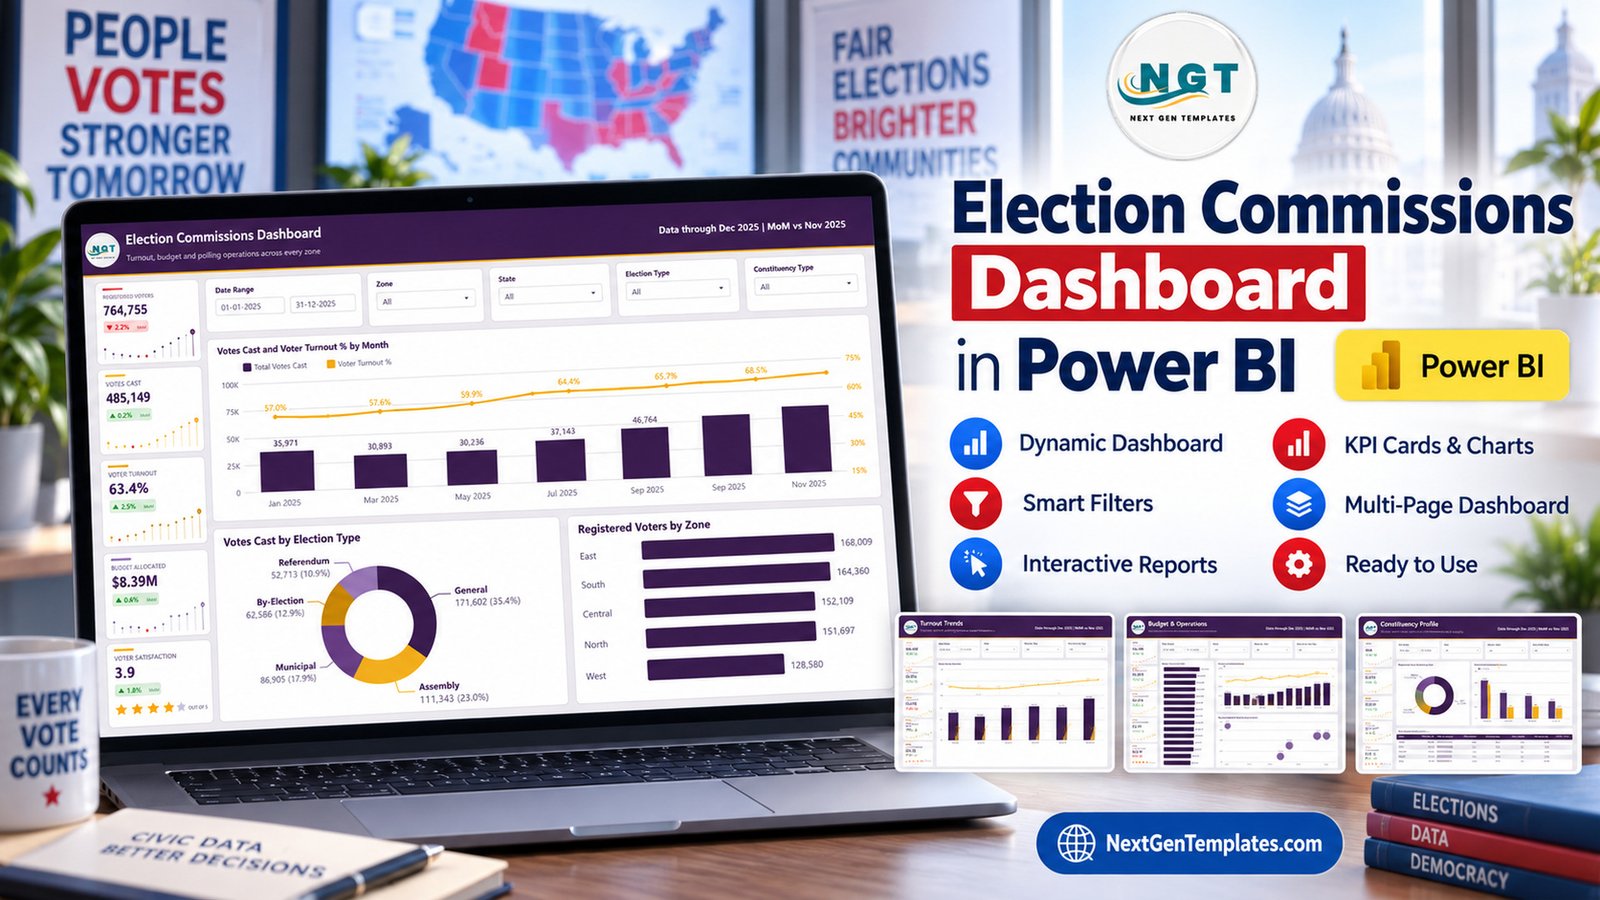
The package includes a PBIX report, Data.xlsx with 500 fictional sample records, and a user manual. It does not register voters, count votes, operate EVMs, resolve complaints, verify audits, detect fraud, predict winners, or declare results. Every output depends on the supplied data and definitions.
Why use an Election Commissions Dashboard in Power BI?
Election-administration reporting may involve participation, polling capacity, geographic coverage, budget use, complaints, incidents, and result workflows. A shared model can help authorized reviewers examine those areas consistently while preserving the context of the selected period and filters.
Five report pages
Overview
Headline cards cover registered voters, votes cast, voter turnout, budget allocated, and voter satisfaction. Charts compare monthly votes and turnout, votes by election type, and registration by zone.
Turnout Trends
Review monthly votes, quarterly voters and votes cast, postal ballots, and turnout in a month-level table.
Constituency Profile
Compare urban, semi-urban, and rural registration, polling booths and EVM units by election type, and votes across constituency and election categories.
Budget & Operations
Examine allocations by state, expenditure and utilization by month, cost per vote, variance, and voters per booth.
Integrity & Results
Review entered complaints, resolution rates, critical incidents, result statuses, audit statuses, and a zone-level scorecard. These labels describe source data; the dashboard performs no investigation or verification.
Prepare the data carefully
- Retain an untouched backup.
- Map only authorized source fields.
- Standardize dates, geographies, categories, statuses, currencies, and units.
- Refresh the report.
- Reconcile cards and selected visuals with official source systems.
- Record filters, exclusions, revisions, and approval status.
Handle election information responsibly
Election data is high-impact information. Access, storage, analysis, and publication should follow applicable law, electoral rules, security controls, privacy requirements, records policies, and official review. Remove unnecessary personal information and do not use the sample structure as a legal specification.
Turnout, complaints, audit status, and result status require precise definitions. A chart can summarize entered values but cannot establish eligibility, authenticity, chain of custody, compliance, or the validity of an election.
Questions for a review
Confirm whether reporting periods and geographic units are complete. Ask whether changes reflect real activity or delayed data, whether denominators are consistent, and whether filters alter the interpretation. Review totals before percentages and document any restatements.
Data-quality checks before presentation
Search for duplicate station or constituency records, blank categories, inconsistent geographic names, dates outside the intended period, and amounts stored in different currencies. Validate the denominator behind turnout, complaint-resolution, utilization, and audit percentages. A plausible-looking percentage may still be misleading if coverage changes between periods.
Compare several dashboard cards and table rows against the authorized source system. Keep a dated reconciliation note that records late submissions, excluded records, restatements, and definition changes. If a report is preliminary, label it clearly and keep it separate from certified public results.
Separate analysis from official decisions
The visuals can help reviewers locate patterns that deserve questions, such as unusual geographic movements, resource imbalances, delayed complaints, or budget variance. They cannot determine intent, establish misconduct, confirm equipment accuracy, or decide whether an election process is valid. Escalation and publication remain controlled official actions.
Maintain a documented data dictionary, refresh log, source owner, and approval record for every reporting cycle.
Related Power BI resources
For nearby reporting examples, see the Government Budget Dashboard in Power BI, Public Sector Dashboard in Power BI, and Political Campaign Dashboard in Power BI. Consult the responsible election authority and International IDEA for authoritative context.
Start with controlled reporting
Use the fictional records to learn the model, replace them with validated information, reconcile every output, and keep final interpretation and publication with authorized election professionals.