Eco-tourism businesses need to understand both commercial performance and the sustainability-related figures they choose to record. Booking spreadsheets can show individual reservations, but they rarely provide a clear view of revenue, guest volume, destination mix, channels, conservation funding, and reported carbon offsets together. The Eco Tourism Dashboard in Power BI organizes those subjects in a consistent five-page report.
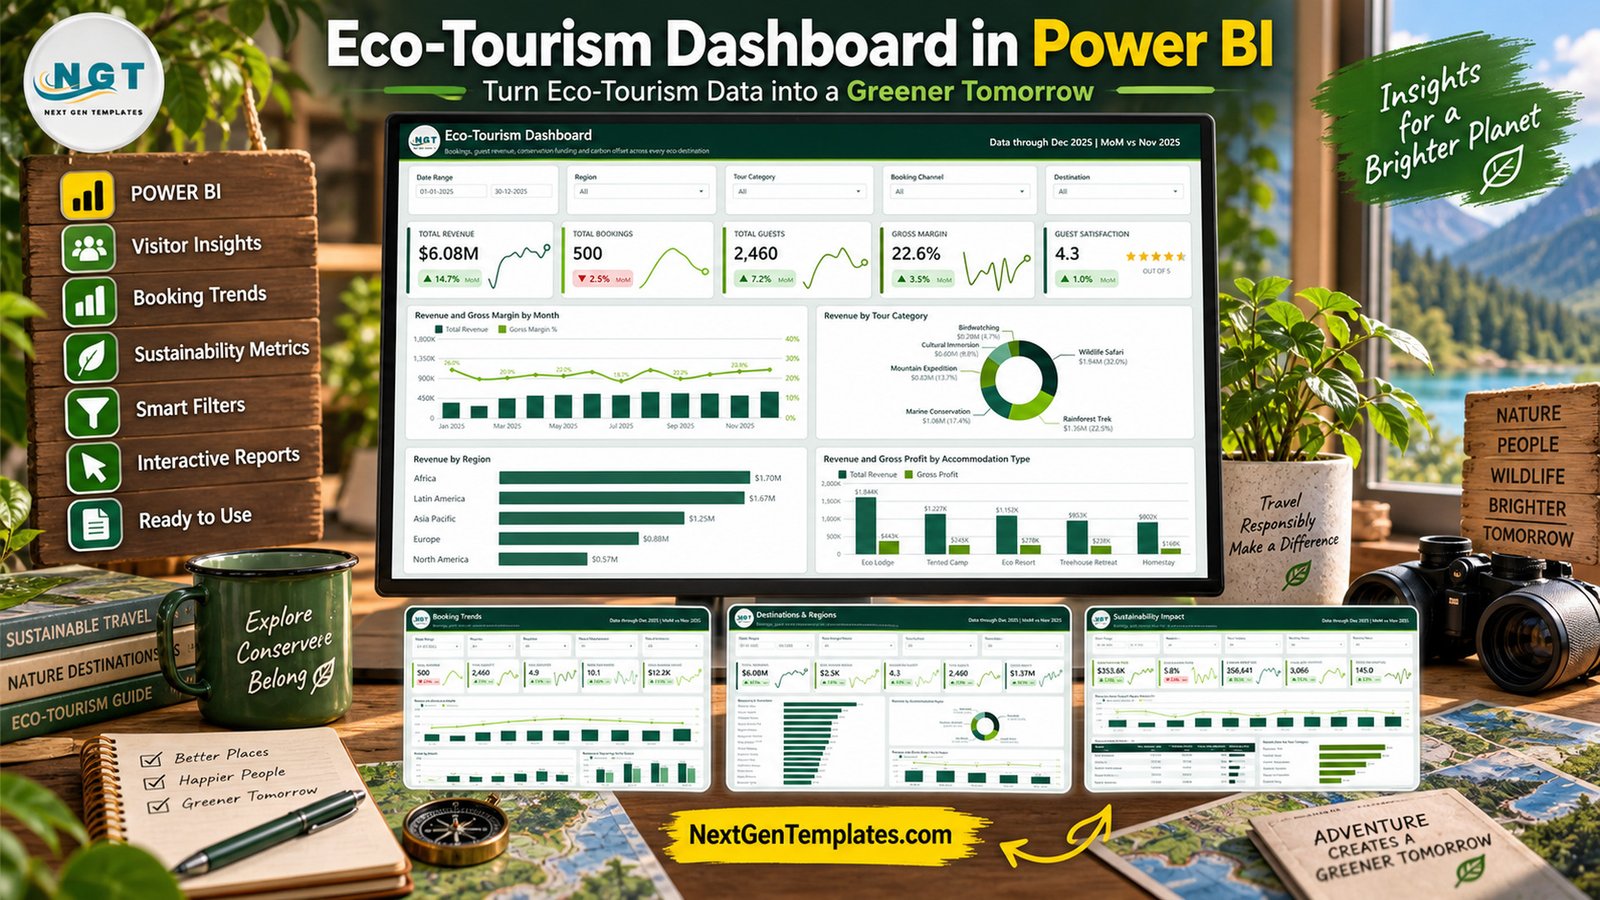
The template includes an editable Power BI report, a structured Excel source file, and a PDF user manual. It is designed for eco-tour operators, responsible-travel businesses, destination teams, tourism analysts, and Power BI learners. The report is descriptive: it summarizes the values supplied to it but does not verify impact, certify offsets, or determine whether an activity is sustainable.
Why eco-tourism reporting needs a connected view
Revenue and booking volume answer only part of the management question. A tour operator may also need to understand where guests travel, which accommodation types contribute the most revenue, how booking channels compare, and what conservation-fund or carbon-offset amounts have been recorded for each region or tour category.
When these fields are kept in disconnected files, review meetings can become a manual exercise in copying totals and rebuilding charts. A structured data table and Power BI model create a repeatable route from booking-level records to management views. The benefit is consistency: the same measures, definitions, filters, and report sequence can be used each time the data is refreshed.
What is included in the Eco Tourism Dashboard in Power BI?
The download contains a PBIX report with five pages, an Excel source table with 500 realistic sample bookings, and a Power BI user manual. Source fields cover booking ID, date, destination, region, tour category, tour operator, accommodation type, booking channel, booking status, guests, trip duration, revenue, operating cost, conservation fund, carbon offset, local jobs supported, and guest satisfaction.
The fictional demonstration dataset contains 2,460 guests across 15 destinations, five regions, and seven tour operators. It produces $6,078,600 of revenue, $4,706,592 of operating cost, $353,605 of conservation-fund entries, 356,641 units of carbon-offset entries, and 3,066 local-jobs-supported entries. Those sustainability-related values are sample inputs rather than independently verified outcomes.
Page 1: Overview
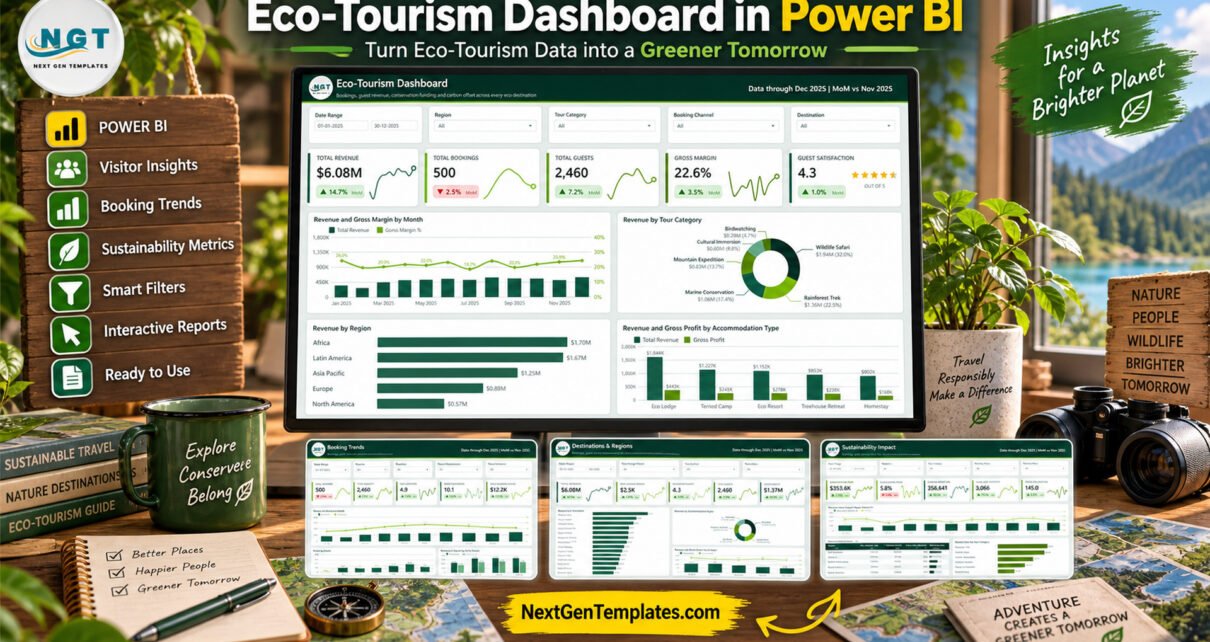
The Overview is the main report page. It shows total revenue, total bookings, total guests, gross margin, and average guest satisfaction. Monthly revenue and gross-margin trends give time context, while tour-category, regional, and accommodation-type visuals explain the composition of results.
With all sample records selected, the headline cards display $6.08M of revenue, 500 bookings, 2,460 guests, a 22.6% gross margin, and a 4.3 average guest rating. Filters for date, region, tour category, booking channel, and destination let users narrow the view before examining supporting pages.
Page 2: Booking Trends
The Booking Trends page focuses on demand and reservation value. Cards show total bookings, total guests, average group size, average trip days, and average booking value. A monthly combination chart compares revenue and booking count, a second visual tracks guests, and a quarterly chart compares revenue with operating cost.
This structure helps users distinguish volume from value. A month with more bookings does not automatically have the highest average booking value, and a quarter with higher revenue may also carry higher operating costs. The dashboard makes these relationships visible without presenting them as forecasts.
Page 3: Destinations & Regions
Destination and regional mix can strongly influence a tourism business. This page presents total revenue, average booking value, revenue per guest, total guests, and gross profit. A destination ranking shows where revenue is concentrated, an accommodation-type chart shows the commercial mix, and a regional visual compares revenue and gross margin.
The sample includes locations such as Okavango Delta, Kenya Savannah, Galapagos Islands, Palawan Marine Park, Nepal Himalaya, Costa Rica Rainforest, and Yellowstone Corridor. These are fictional business records used to demonstrate the report and do not represent actual performance by any destination or operator.
Page 4: Sustainability Impact
The Sustainability Impact page summarizes conservation-fund amounts, conservation share, carbon-offset values, local-jobs-supported values, and offset per guest. Monthly, regional, and category breakdowns help users inspect how recorded figures are distributed.
It is important to interpret this page correctly. The dashboard calculates aggregations from the values entered into the spreadsheet; it does not calculate a carbon footprint, confirm additionality, validate an offset project, audit conservation spending, verify employment, or provide ESG assurance. Organizations should establish their own definitions, units, evidence, boundaries, and review processes before reporting any sustainability claim externally.
Page 5: Channels & Guests
The final page explores total bookings, average booking value, guest satisfaction, completion rate, and cancellation rate. Revenue and satisfaction are compared across booking channels, booking status is shown as a share of the total, and a tour-operator scorecard displays revenue, bookings, average value, and guest-rating context.
In the sample data, 321 bookings are completed, 85 confirmed, 50 rescheduled, and 44 cancelled. This produces a 64.2% completion rate and an 8.8% cancellation rate. The chart is descriptive and does not predict cancellations or guest behavior.
How the filters support analysis
Each page uses filters appropriate to its subject. Date, region, tour category, and booking channel are common across the report, while destination, operator, accommodation type, or booking status appear where relevant. This makes it possible to start with a broad executive review and then investigate one market, tour type, channel, operator, or destination.
A practical review sequence is to start on Overview, open Booking Trends when volume or value changes, use Destinations & Regions to examine mix, review the sustainability-related inputs separately, and finish with Channels & Guests to understand acquisition and booking outcomes.
How to replace the sample data
- Keep an untouched backup of the downloaded package.
- Open Data.xlsx and preserve the existing headers and compatible data types.
- Replace or append rows with clean booking-level records.
- Open the report using Microsoft Power BI Desktop.
- Update the Excel source location if Power BI requests it.
- Refresh the model and reconcile bookings, revenue, cost, guests, and sustainability-related fields.
- Test every slicer and visual before publishing or sharing.
Power BI Desktop can be used to edit the local report. Publishing and collaboration through the Power BI service may require an appropriate Microsoft license.
Ways to adapt the report
Users can rename destinations, operators, channels, categories, and accommodation types to reflect their own structure. Advanced users may add approved measures, change the theme, or connect a governed data source. Any modification should be tested against source totals, especially when changing units or definitions for environmental and social fields.
For related options, explore the Eco-Tourism Dashboard in Excel, the Eco-Tourism KPI Dashboard in Power BI, the Eco Lodges Dashboard in Excel, and our other business dashboard templates.
Who will benefit from this template?
- Eco-tour operators reviewing bookings, guests, and commercial results
- Destination and accommodation managers comparing markets and products
- Analysts standardizing tourism performance reporting
- Teams organizing self-reported conservation and carbon-offset fields
- Power BI learners who want a complete multi-page portfolio example
Get the five-page Power BI template
The Eco Tourism Dashboard in Power BI offers a polished starting point for recurring tourism reporting. It combines a clear Overview with booking, destination, sustainability-input, and guest-channel pages, plus editable sample data and a setup manual.
View the Eco Tourism Dashboard in Power BI on NextGenTemplates to review the product images and get the complete downloadable package.
Responsible reporting reminder
Validate every source field and calculation before using the report for decisions or public communication. This template is not a booking engine, accounting platform, emissions calculator, carbon registry, impact assessment, sustainability certification, or regulatory reporting system. Do not present sample or unverified values as evidence of environmental or social performance.