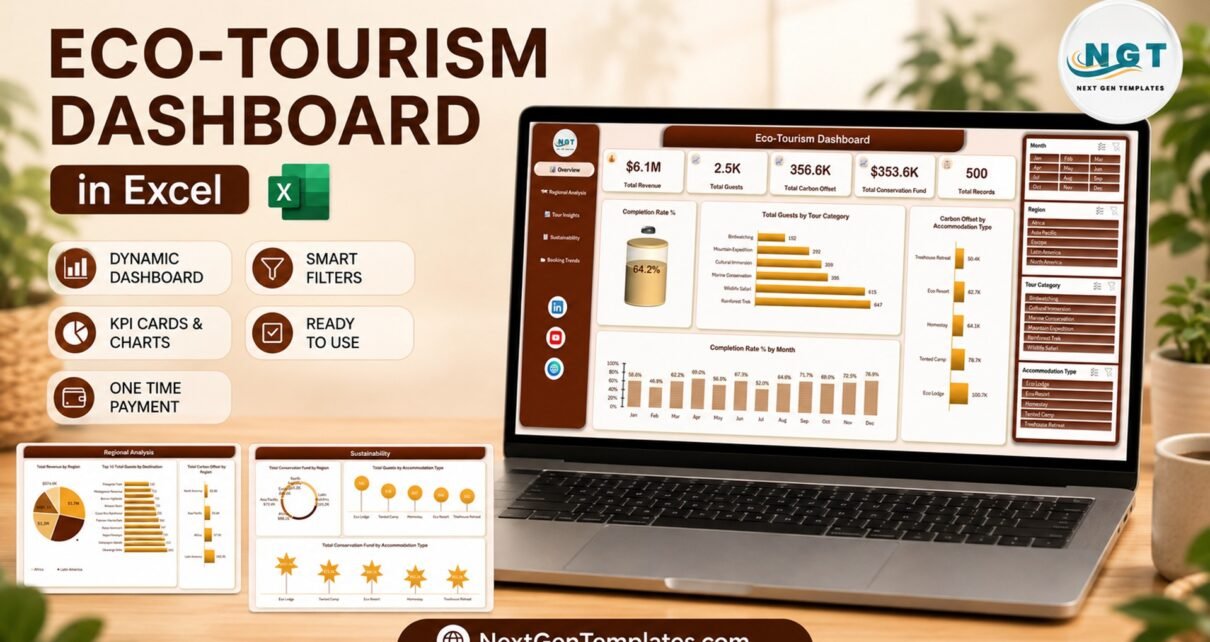
Running a responsible-travel business means answering two questions at once: did the season pay, and did it do what it promised the destination. Most operators end up with a revenue report in one file and a sustainability note in another, and nobody can put them on the same page. The Eco-Tourism Dashboard in Excel puts them side by side – 500 tour bookings, five linked report pages, and conservation fund and carbon offset sitting next to the $6.1M of revenue that generated them.
This is the analytical line – pivot tables and slicers you explore, not a monthly scorecard with traffic lights. It is a plain .xlsx: no macros, no add-ins, no subscription. Below is a page-by-page walkthrough of what the workbook actually contains, read straight off the build.
Key Features of the Eco-Tourism Dashboard in Excel
- Five report pages – Overview, Regional Analysis, Tour Insights, Sustainability and Booking Trends – plus a Data sheet and a hidden Support sheet holding the pivot tables.
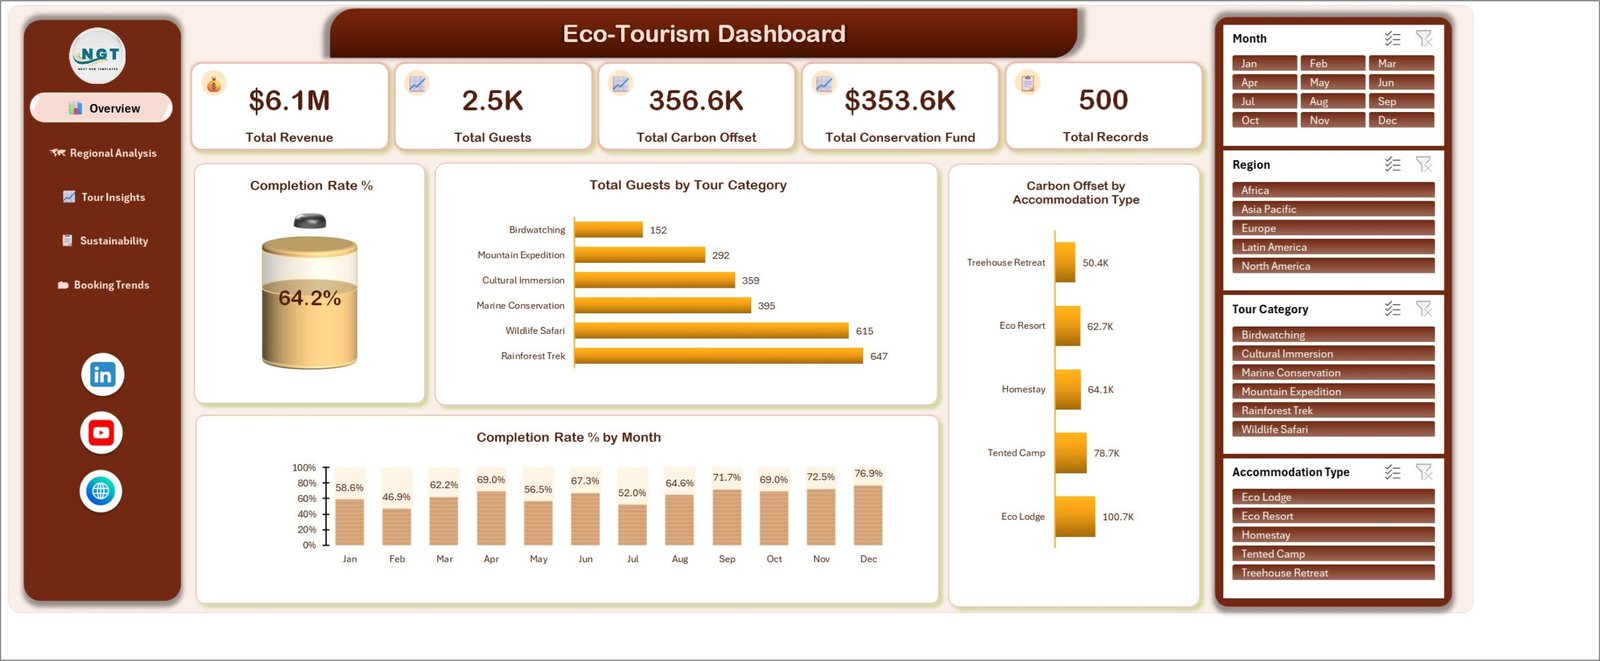
- Five KPI cards on the Overview page: Total Revenue $6.1M, Total Guests 2.5K, Total Carbon Offset 356.6K, Total Conservation Fund $353.6K and Total Records 500.
- Four slicers – Month, Region, Tour Category and Accommodation Type – repeated on all five pages and driven by one shared cache each, so a filter set on any page is already applied on the next.
- 20 charts, four per page, each titled for the metric it displays rather than the chart type.
- 25 pivot tables on a single Support sheet, all fed by one pivot cache built over the 500-row table.
- 500 sample booking rows across 23 fields, dated 1 January to 30 December 2025.
- Six tour categories, five accommodation types, five regions, 15 destinations, seven tour operators, five booking channels and four booking statuses in the sample data.
- Works in Excel 2016, 2019, 2021, 2024, Microsoft 365 and Excel for Mac, with a PDF user manual in the download ZIP.
Dashboard Pages Explanation
Page 1 – Overview
The Overview page opens with the five KPI cards and a Completion Rate % cylinder gauge reading 64.2% – the 321 bookings that completed out of 500. Next to it, Total Guests by Tour Category ranks the six categories: Rainforest Trek 647 guests, Wildlife Safari 615, Marine Conservation 395, Cultural Immersion 359, Mountain Expedition 292 and Birdwatching 152. Carbon Offset by Accommodation Type runs down the right side – Eco Lodge 100.7K, Tented Camp 78.7K, Homestay 64.1K, Eco Resort 62.7K and Treehouse Retreat 50.4K. Along the bottom, Completion Rate % by Month shows the year is not flat: 46.9% in February against 76.9% in December, with a second dip to 52.0% in July.
That February-to-December spread is the first thing worth acting on. It is not a revenue problem – it is bookings that were made and then rescheduled or cancelled, and the month breakdown tells you where to look.
Page 2 – Regional Analysis
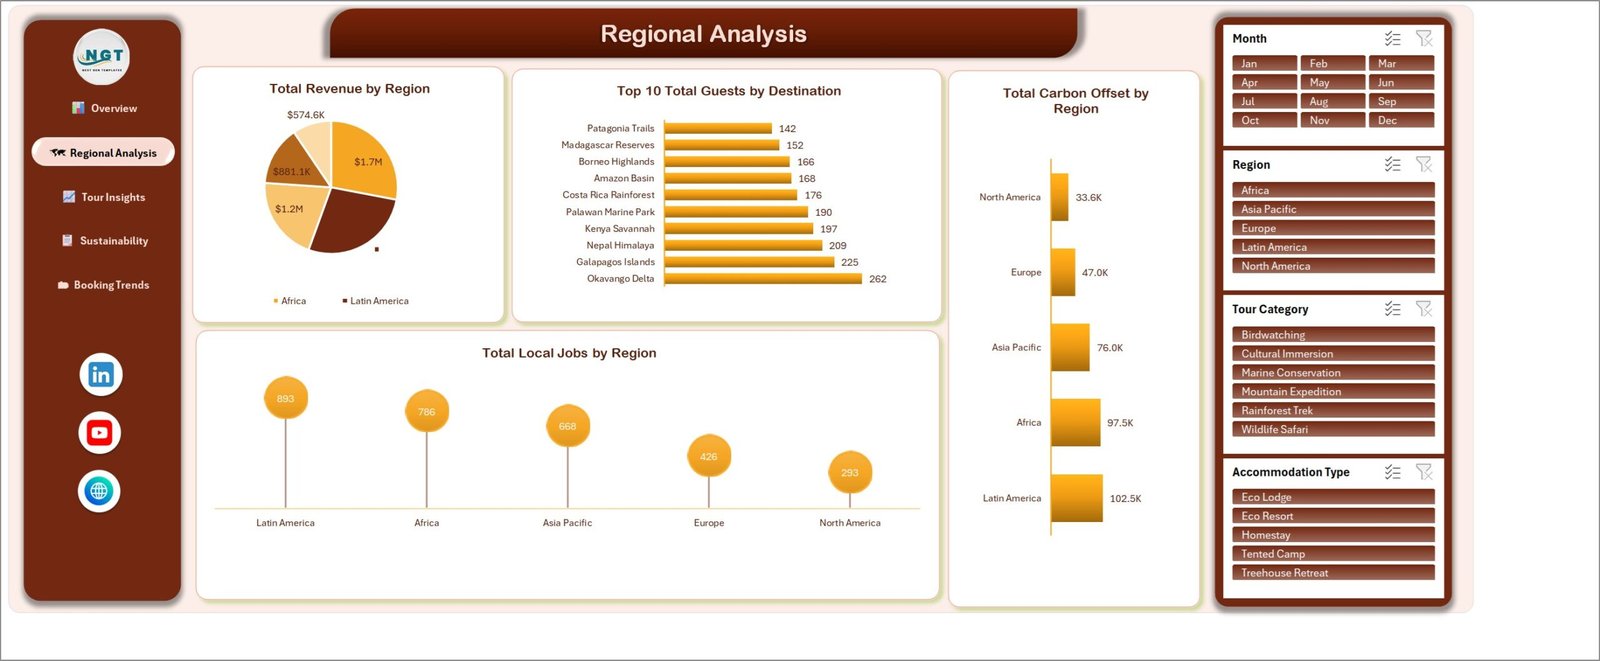
Total Revenue by Region is a pie splitting the $6.1M: Africa and Latin America both at $1.7M, Asia Pacific $1.2M, Europe $881.0K and North America $574.6K. Top 10 Total Guests by Destination then drills through to the places themselves – Okavango Delta 262, Galapagos Islands 225, Nepal Himalaya 209, Kenya Savannah 197, Palawan Marine Park 190, Costa Rica Rainforest 176, Amazon Basin 168, Borneo Highlands 166, Madagascar Reserves 152 and Patagonia Trails 142. Five more destinations sit in the data behind that top ten.
The two charts on the right are the interesting pair. Total Carbon Offset by Region reads Latin America 102.5K, Africa 97.5K, Asia Pacific 76.0K, Europe 47.0K, North America 33.6K, while Total Local Jobs by Region reads 893, 786, 668, 426 and 293 in the same order. Latin America and Africa produce almost identical revenue, but Latin America carries more offset and more local employment – a distinction a single revenue chart would hide entirely.
Page 3 – Tour Insights
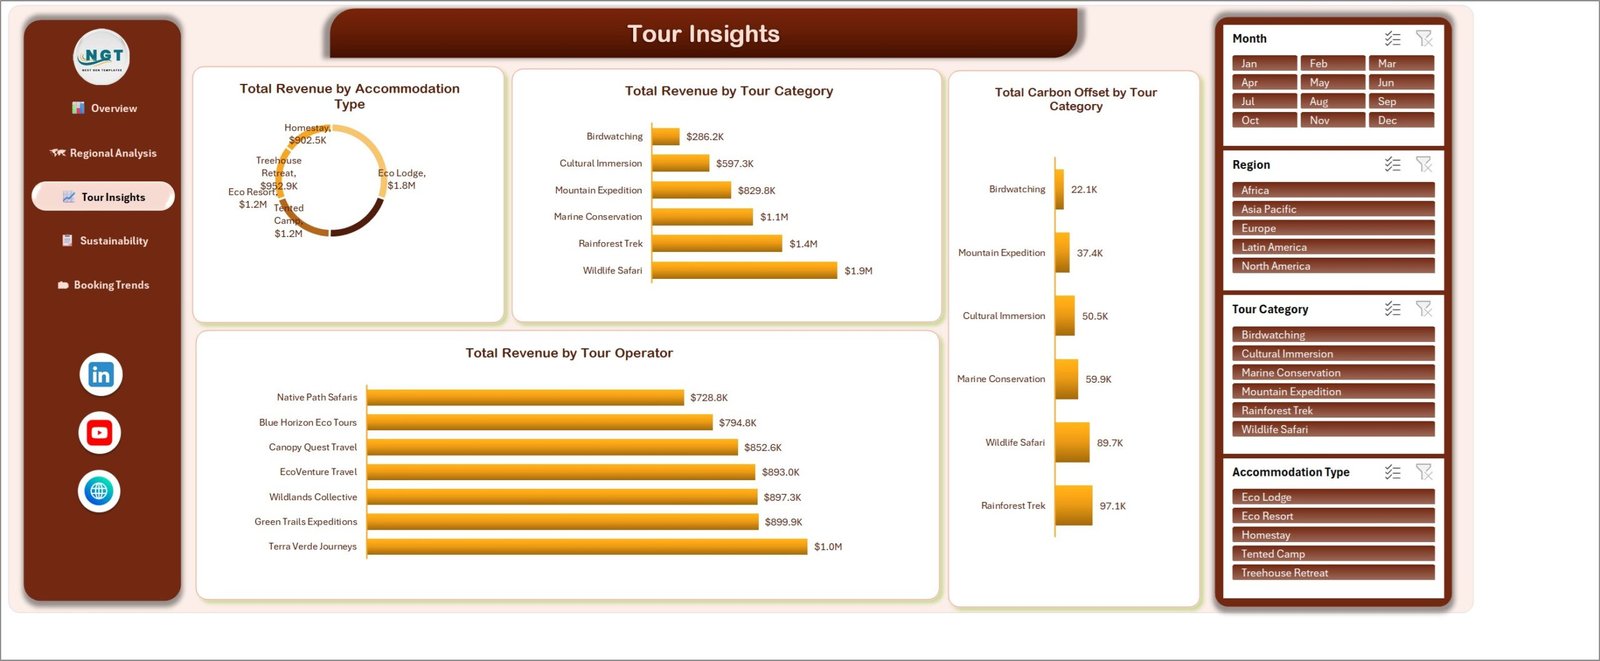
Total Revenue by Accommodation Type is a donut: Eco Lodge $1.8M, Eco Resort $1.2M, Tented Camp $1.2M, Treehouse Retreat $952.9K and Homestay $902.5K. Total Revenue by Tour Category ranks Wildlife Safari $1.9M, Rainforest Trek $1.4M, Marine Conservation $1.1M, Mountain Expedition $829.8K, Cultural Immersion $597.3K and Birdwatching $286.2K.
Directly beside it, Total Carbon Offset by Tour Category flips the top two – Rainforest Trek 97.1K against Wildlife Safari’s 89.7K, then Marine Conservation 59.9K, Cultural Immersion 50.5K, Mountain Expedition 37.4K and Birdwatching 22.1K. Reading the two charts together is the point of the page: the biggest earner is not the biggest offsetter. Total Revenue by Tour Operator closes the page with seven suppliers packed into a narrow band – Terra Verde Journeys $1.0M, Green Trails Expeditions $899.9K, Wildlands Collective $897.3K, EcoVenture Travel $893.0K, Canopy Quest Travel $852.6K, Blue Horizon Eco Tours $794.8K and Native Path Safaris $728.8K.
Page 4 – Sustainability
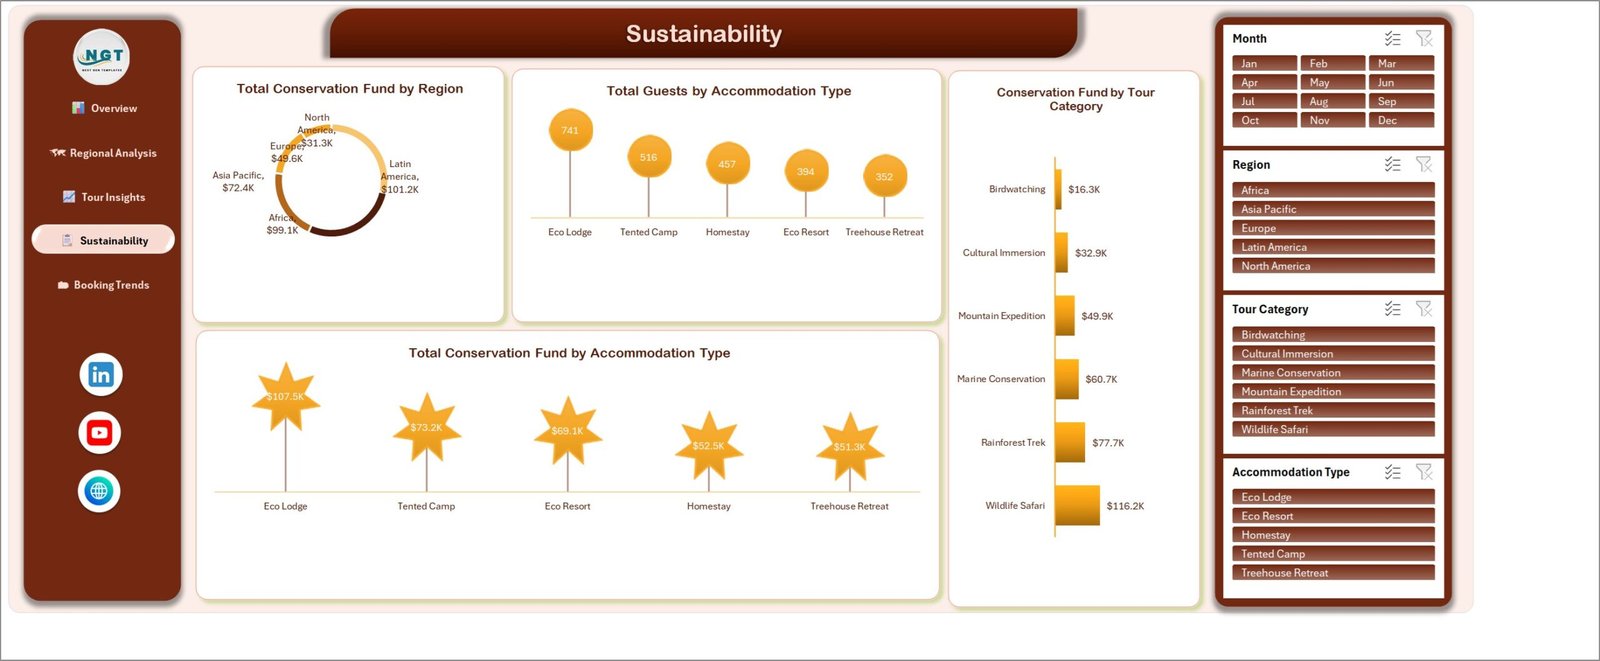
This is the page that separates this workbook from a general travel dashboard. Total Conservation Fund by Region is a donut reading Latin America $101.2K, Africa $99.1K, Asia Pacific $72.4K, Europe $49.6K and North America $31.3K. Total Guests by Accommodation Type counts 741 guests in Eco Lodges, 516 in Tented Camps, 457 in Homestays, 394 in Eco Resorts and 352 in Treehouse Retreats.
Conservation Fund by Tour Category gives Wildlife Safari $116.2K, Rainforest Trek $77.7K, Marine Conservation $60.7K, Mountain Expedition $49.9K, Cultural Immersion $32.9K and Birdwatching $16.3K. Total Conservation Fund by Accommodation Type finishes with Eco Lodge $107.5K, Tented Camp $73.2K, Eco Resort $69.1K, Homestay $52.5K and Treehouse Retreat $51.3K. Put that last chart next to the guest counts above it and the contribution per guest is visible without a single extra formula.
Page 5 – Booking Trends
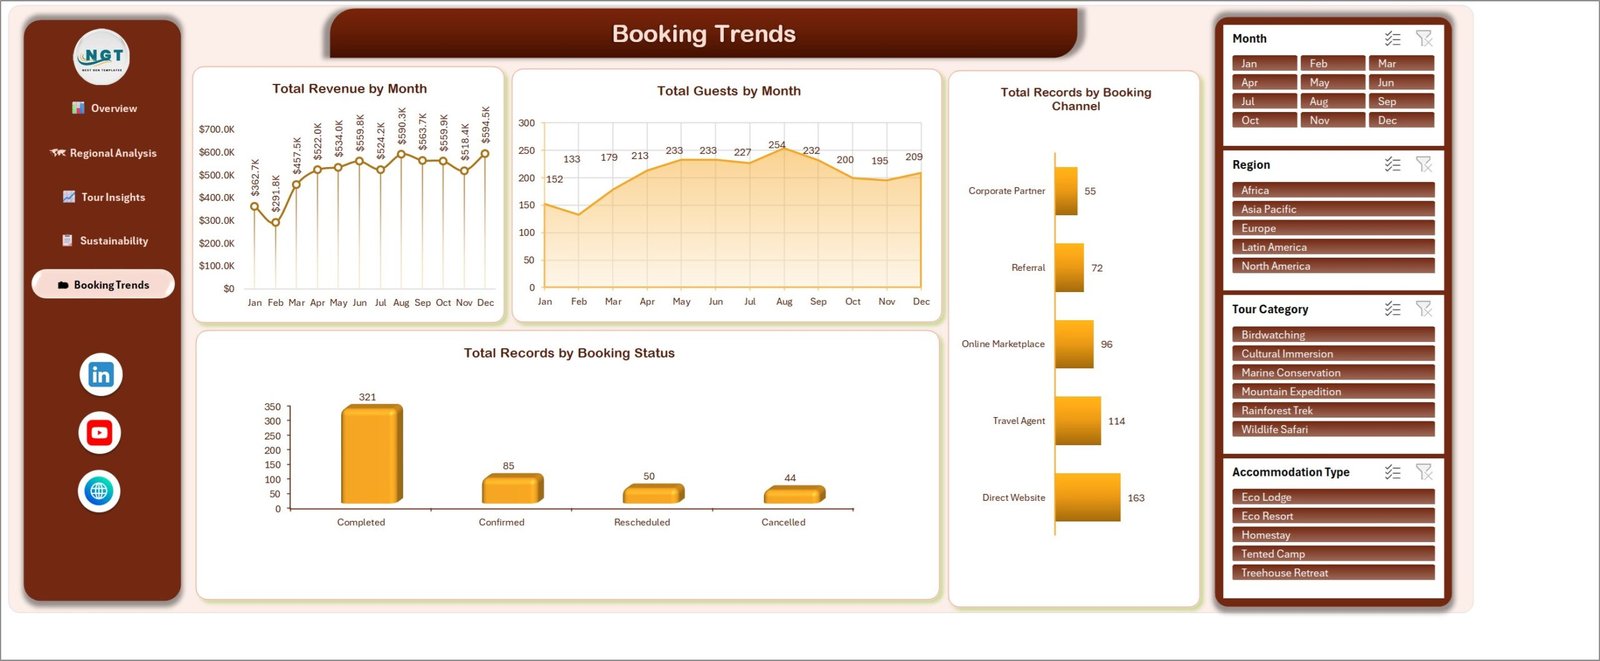
Total Revenue by Month traces the year: $362.7K in January, a $291.8K trough in February, then a climb through $457.5K, $522.0K, $534.0K, $559.8K, $524.2K, an $590.3K August peak, $563.7K, $559.9K, $518.4K and $594.5K in December. Total Guests by Month tells the volume story – 152, 133, 179, 213, 233, 233, 227, 254, 232, 200, 195 and 209 – so August is the busiest month by guests while December is the strongest by revenue.
Total Records by Booking Channel ranks Direct Website 163, Travel Agent 114, Online Marketplace 96, Referral 72 and Corporate Partner 55. Total Records by Booking Status counts 321 completed, 85 confirmed, 50 rescheduled and 44 cancelled – the 94 rescheduled-or-cancelled bookings that pull the completion gauge down to 64.2%.
Eco-Tourism Dashboard in Excel vs. Google Sheets vs. Paid Tourism Analytics SaaS – Feature Comparison
| What matters | This Excel dashboard | Google Sheets equivalent | Paid SaaS (booking-platform BI, sustainability suites) |
|---|---|---|---|
| Cost | $17.99 once | $9.99 once | $6,000-$40,000 per year |
| Platform | Excel 2016+, Microsoft 365, Mac | Browser, any device | Vendor cloud only |
| Setup time | Under 15 minutes | Under 15 minutes | 4-12 weeks |
| Team collaboration | OneDrive or SharePoint co-authoring | Native, simultaneous | Native, with approvals |
| Works with your own booking export | Yes, paste and refresh | Yes, paste and refresh | Requires a reservation-system integration |
| Carbon offset and conservation fund beside revenue | Built in | Built in | Usually a separate sustainability module |
| Offline use | Yes | Limited | No |
| Data leaves your organisation | No | Stays in your Google account | Yes, vendor-hosted |
| Year-1 cost at 5 users | $17.99 | $9.99 | $10,000+ |
Who Should Use This Template
Eco-tourism and responsible-travel operators running several destinations and tour styles who need one file that answers both the commercial and the impact question. Lodge, camp and homestay groups comparing performance across property types. Destination management companies reporting regional results back to partners and boards. Sustainability and impact managers who have to place carbon offset and local jobs supported alongside the revenue that funded them. And consultants and analysts who want a working five-page pivot-and-slicer model to adapt rather than build from an empty sheet.
Real-World Use Cases
A quarterly board pack. Filter Region to Latin America and one page carries $1.7M of revenue, 893 local jobs supported and $101.2K of conservation fund. The same filter is already applied when you move to Booking Trends, so the channel mix behind those numbers takes one click, not one rebuild.
A capital request for lodge upgrades. Eco Lodge shows 741 guests, $1.8M of revenue, 100.7K of carbon offset and $107.5K of conservation fund – four charts on two pages that together make the case, without anyone having to trust a summary slide.
A shoulder-season campaign. February is the weakest month on revenue ($291.8K), the weakest on guests (133) and the worst on completion (46.9%). Birdwatching is the lightest-footprint category at 22.1K of offset. Pairing the two is a concrete promotion, not a hunch.
An operator review. Seven tour operators sit inside a $272K revenue band. Slicing by operator and reading conservation fund and carbon offset next to that revenue is how you tell a genuinely low-impact supplier from one that is simply smaller.
Advantages of the Eco-Tourism Dashboard in Excel
- Impact and revenue in one model. Conservation fund, carbon offset and local jobs supported are columns in the same table as revenue, so every chart can be cut by the same four slicers.
- Genuinely synchronised filtering. The four slicer fields share one cache each across all five pages, which is what makes a filtered walk-through possible.
- No macros. A plain .xlsx opens without a security prompt, e-mails cleanly and survives corporate policy that blocks .xlsm files.
- Chart titles you can screenshot. Every chart is named for its metric, so a slide needs no caption written after the fact.
- You own the file. No login, no seat count, no renewal, and nothing about your bookings leaves your machine.
- Fully editable. Add a column, add a chart, restyle the pages – it is an ordinary workbook, not a locked template.
Opportunities for Improvement
Three honest limitations, so nobody is surprised after buying:
- The workbook does not refresh on open. There is no refresh-on-load flag set on the pivot cache, so after pasting new rows you must press Ctrl + Alt + F5 (Data > Refresh All). Skip it and the pages still show the old numbers.
- Two data fields are not charted. Operating Cost and Guest Satisfaction are collected on every row but no page plots them, so margin and satisfaction analysis needs a pivot you add yourself. The fields are there; the visuals are not.
- Carbon offset is an unlabelled number. The column sums whatever you enter and the workbook does not state a unit. Decide on kilograms or tonnes of CO2e, apply it consistently, and treat the result as internal tracking – it is not a GHG Protocol or ISO 14064 inventory, and it should not be presented to a regulator or in a certified claim as though it were.
Best Practices
- Keep the 23 column headers on the Data sheet exactly as they are – the 25 pivot tables are built on those names.
- Paste values, not formatted cells, when you replace the sample rows, then refresh once rather than after every paste.
- Standardise your region, category and accommodation labels before you import. Two spellings become two slicer buttons.
- Keep a clean master copy of the workbook and work on a dated duplicate each reporting period.
- Clear all slicers before you save and close, so the next person opens the full picture rather than someone else’s filter.
- Record your carbon-offset unit in a cell on the Data sheet so a colleague reading it in six months does not have to guess.
- Export each page to PDF for the report pack rather than sharing the live file – it keeps your data and your cost columns to yourself.
Explore Relevant Templates
- Eco Lodges Dashboard in Excel – the property-level view of the same business.
- Outdoor Adventure Parks Dashboard in Excel – visitor, activity and safety analytics for park operators.
- Medical Tourism Dashboard in Excel – inbound treatment travel instead of nature travel.
- Eco-Tourism KPI Dashboard in Excel – the scorecard edition, with targets and traffic lights.
- Wildlife Conservation KPI Scorecard in Excel – conservation outcomes on a one-page scorecard.
- Eco Lodges Dashboard in Power BI – the Power BI route if your data already sits in a model.
- Hotel Revenue RevPAR Dashboard in Power BI – accommodation revenue management in depth.
Frequently Asked Questions
Which Excel versions does the Eco-Tourism Dashboard in Excel support?
Excel 2016, 2019, 2021, 2024 and Microsoft 365 on Windows, plus Excel for Mac. It is a standard .xlsx built on pivot tables and slicers – there are no macros to enable and no add-ins to install.
How is this different from an Eco-Tourism KPI dashboard or KPI scorecard?
This is the analytical line: five exploration pages, 20 charts and free-form slicing across 500 booking records. A KPI dashboard is a month-picker scorecard with targets and red/amber/green lights; a KPI scorecard is a one-page summary. Near-identical names exist across all three lines – they answer different questions, and this is the one you slice.
Can I add my own destinations, tour categories or operators?
Yes. Type your own values into the Data sheet and refresh – the slicers and every chart rebuild around whatever list they find. Nothing is hard-coded to the 15 sample destinations or the seven sample operators.
Do the charts update automatically?
They update on refresh, not on open. Paste your rows, then press Ctrl + Alt + F5 (Data > Refresh All) and all five pages redraw in one step.
How many booking records can it handle?
It ships with 500 rows covering 1 January to 30 December 2025 and stays responsive into the tens of thousands. Past roughly 100,000 rows, refresh times start to be noticeable on an average laptop.
What is in the download?
A ZIP containing the .xlsx workbook and a PDF user manual. Nothing else to install.
Is any of the sample data real?
No. Destination names, operator names, guest counts and every financial and carbon figure are realistic sample data used to demonstrate the charts. Replace them before you share anything externally.
About the Author
Built by PK – Microsoft Certified Professional with 15+ years of Excel, Google Sheets and Power BI experience, and founder of NextGenTemplates, reaching 300K+ subscribers across YouTube channels. Every template is hand-built and tested before release.
Conclusion
The Eco-Tourism Dashboard in Excel is worth having when your reporting has to satisfy a finance conversation and a sustainability conversation in the same meeting. Five pages, 20 charts and four synchronised slicers cover revenue, guests, carbon offset, conservation fund and local jobs from one 500-row table – and because it is a plain .xlsx, adapting it to your own destinations takes an afternoon, not a project.
Get the Eco-Tourism Dashboard in Excel for $17.99 (regular $29.99) – instant download, one-time payment, lifetime access, no subscription.