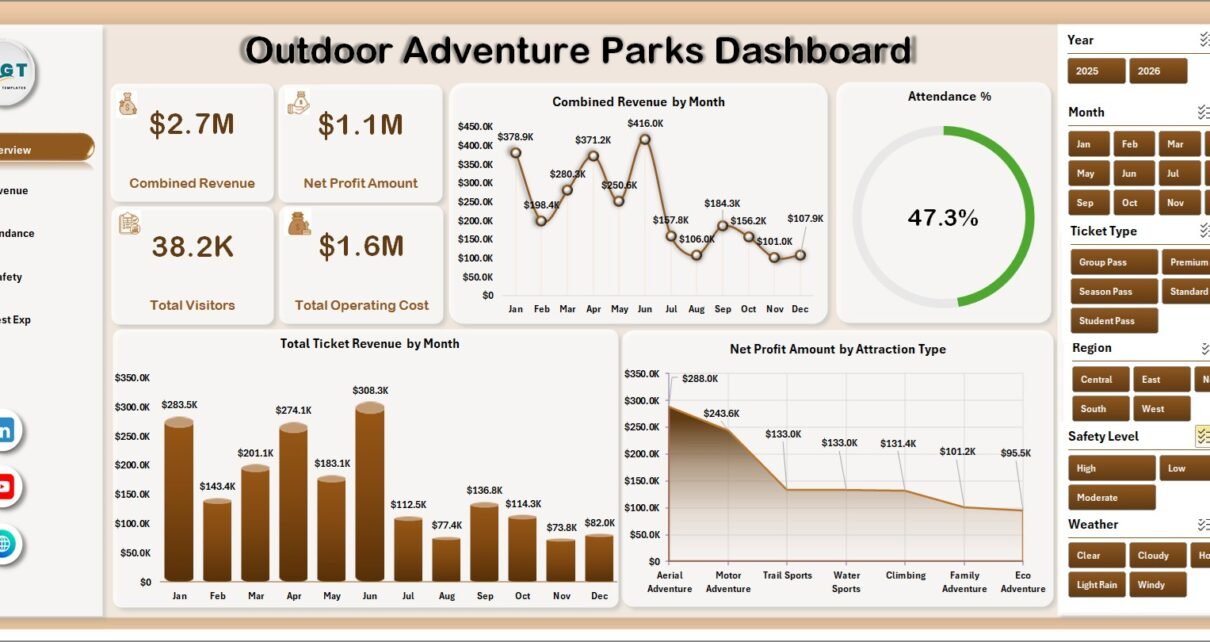
The Outdoor Adventure Parks Dashboard in Excel gives adventure park teams a ready workbook for tracking revenue, visitors, operating cost, net profit, ticket revenue, attendance percentage, retail revenue, safety level, weather, regions, booking channels, visitor segments, and activity performance. Outdoor parks can handle hundreds or thousands of visits across zip lines, climbing areas, rope courses, rides, and group events, but analysis becomes slow when ticketing, staffing, retail, and operations data is reviewed in separate files.
This template brings the main business signals into one Excel file with 5 dashboard pages, 5 high-level KPI cards, interactive slicers, a Data sheet, and a pivot-backed Support sheet. Replace the sample data, click Refresh All, and use the pages to review revenue, attendance, safety, guest experience, and park-level performance without building the dashboard from scratch.
Key Features of Outdoor Adventure Parks Dashboard in Excel
- 5 dashboard pages: Overview, Revenue, Attendance, Safety, and Guest Exp.
- 5 KPI cards: Combined Revenue, Net Profit Amount, Total Visitors, Total Operating Cost, and Attendance %.
- Interactive slicers: Filter the dashboard quickly by available park, month, ticket, activity, weather, safety, region, channel, or visitor fields.
- Revenue analysis: Review ticket revenue, combined revenue, visitors, operating cost, booking channels, regions, and park performance.
- Attendance analysis: Compare visitor volume, attendance percentage, visitor segments, activities, safety levels, and quarters.
- Safety and weather visibility: Understand how weather, staff teams, retail revenue, parks, and regional visits relate to operations.
- Editable Excel file: Customize the workbook, charts, pivots, fields, formulas, and visual layout as your reporting needs change.
Dashboard Pages Explanation
1 – Overview Page
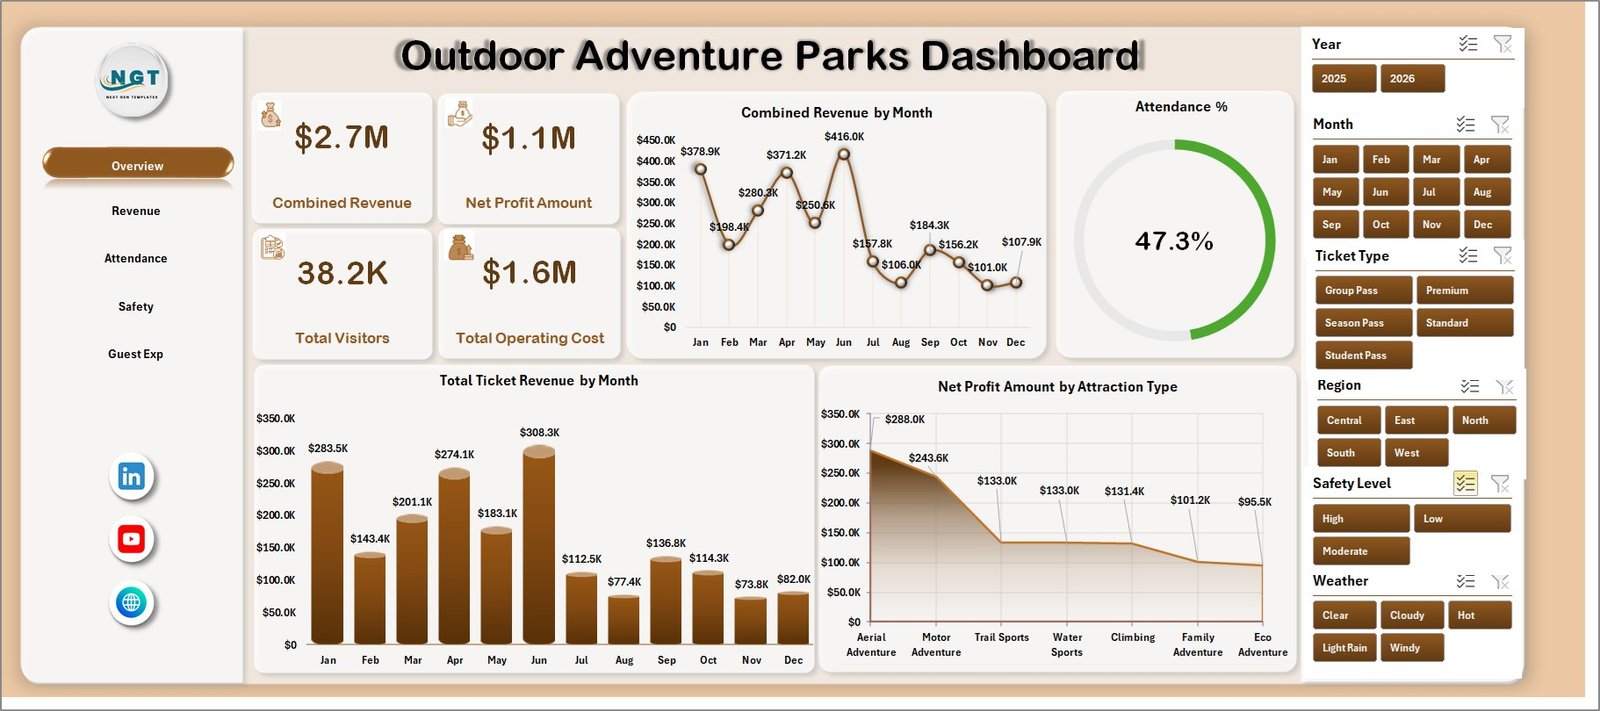
The Overview page is the main leadership summary. The top cards show Combined Revenue, Net Profit Amount, Total Visitors, Total Operating Cost, and Attendance %, so the team can quickly understand commercial performance, demand, cost pressure, and attendance health.
Combined Revenue by Month: This chart shows how total revenue moves month by month. It helps managers see peak season, low-demand periods, and months where marketing or pricing strategy may need review.
Attendance % by Overall Dashboard Selection: This visual updates with the dashboard filters. It helps users compare attendance performance for selected parks, activities, visitor segments, weather conditions, or booking channels.
Total Ticket Revenue by Month: This chart focuses on ticket income across the year. It is useful for understanding admission demand separately from wider combined revenue.
Net Profit Amount by Attraction Type: This chart compares net profit across attraction types. It helps operators identify which attractions produce stronger financial contribution after operating costs.
2 – Revenue
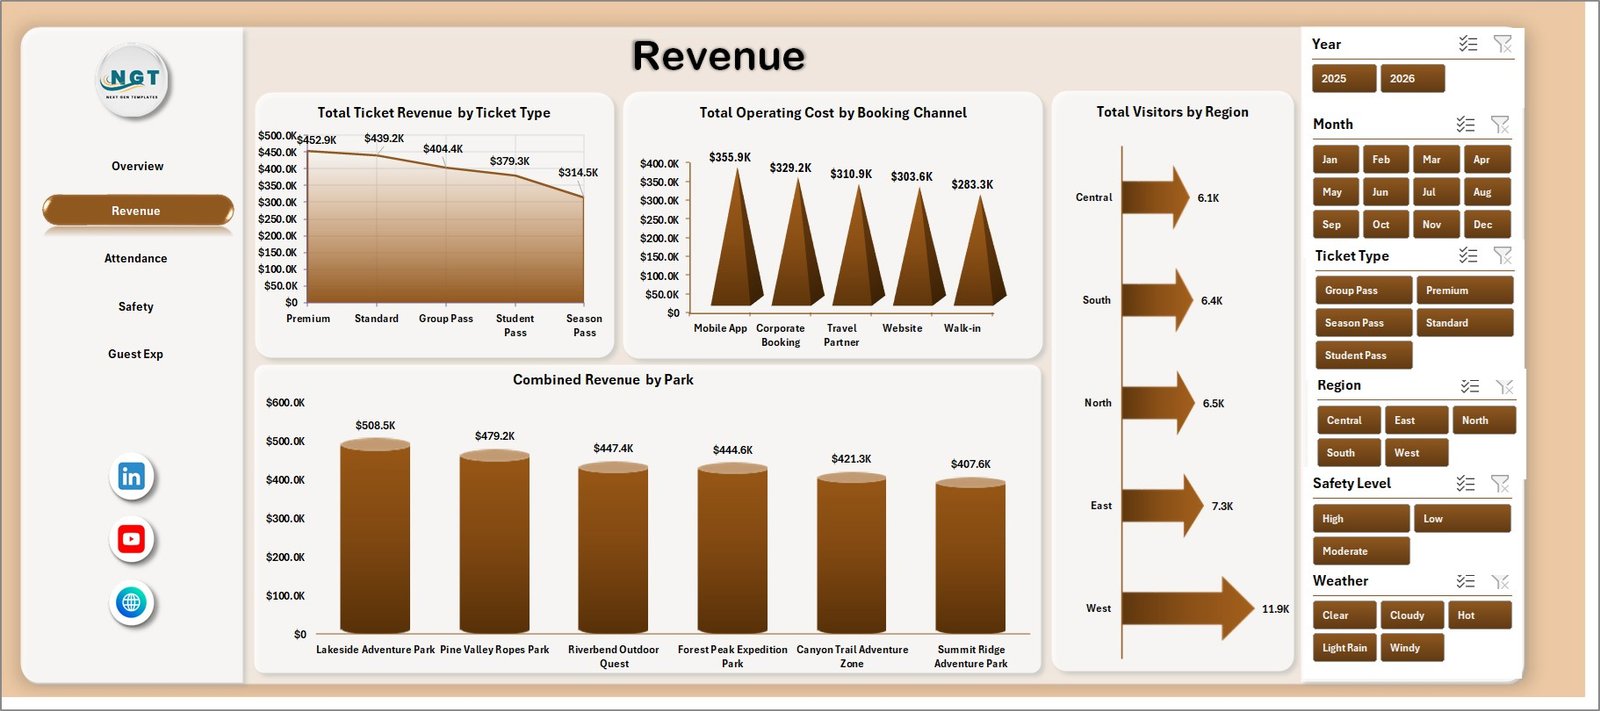
The Revenue sheet is built for financial and visitor demand analysis. Total Ticket Revenue by Ticket Type helps teams compare ticket categories such as adult, child, family, group, or premium packages. Total Operating Cost by Booking Channel shows which channels carry higher cost impact. Total Visitors by Region reveals where demand is coming from. Combined Revenue by Park compares park-level revenue contribution for multi-location operators.
3 – Attendance
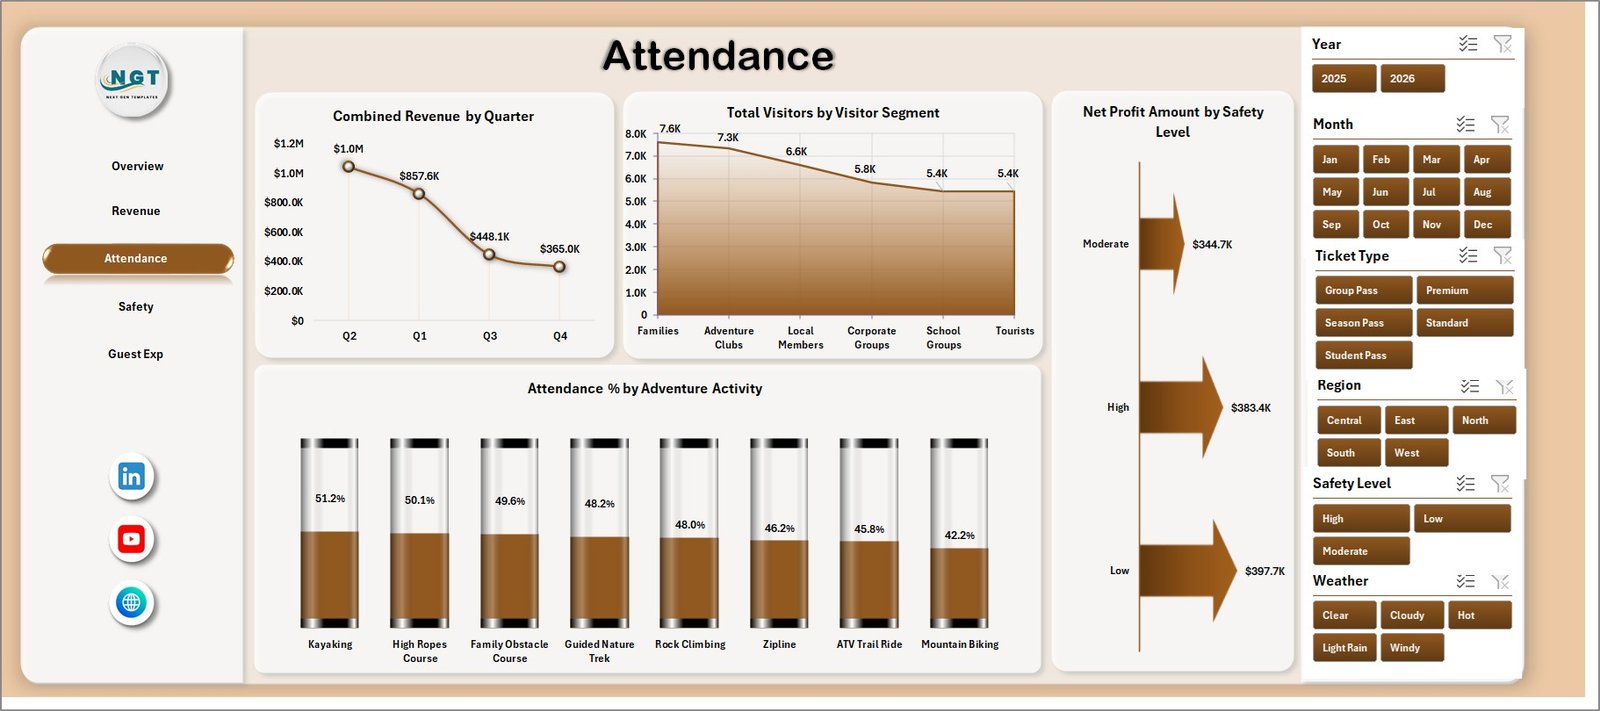
The Attendance sheet helps the team review when guests arrive, which segments participate, and which activities attract stronger attendance. Combined Revenue by Quarter shows quarterly business movement. Total Visitors by Visitor Segment compares visitor groups such as families, schools, tourists, or corporate groups. Net Profit Amount by Safety Level connects safety classification with profitability. Attendance % by Adventure Activity shows activity-level engagement.
4 – Safety
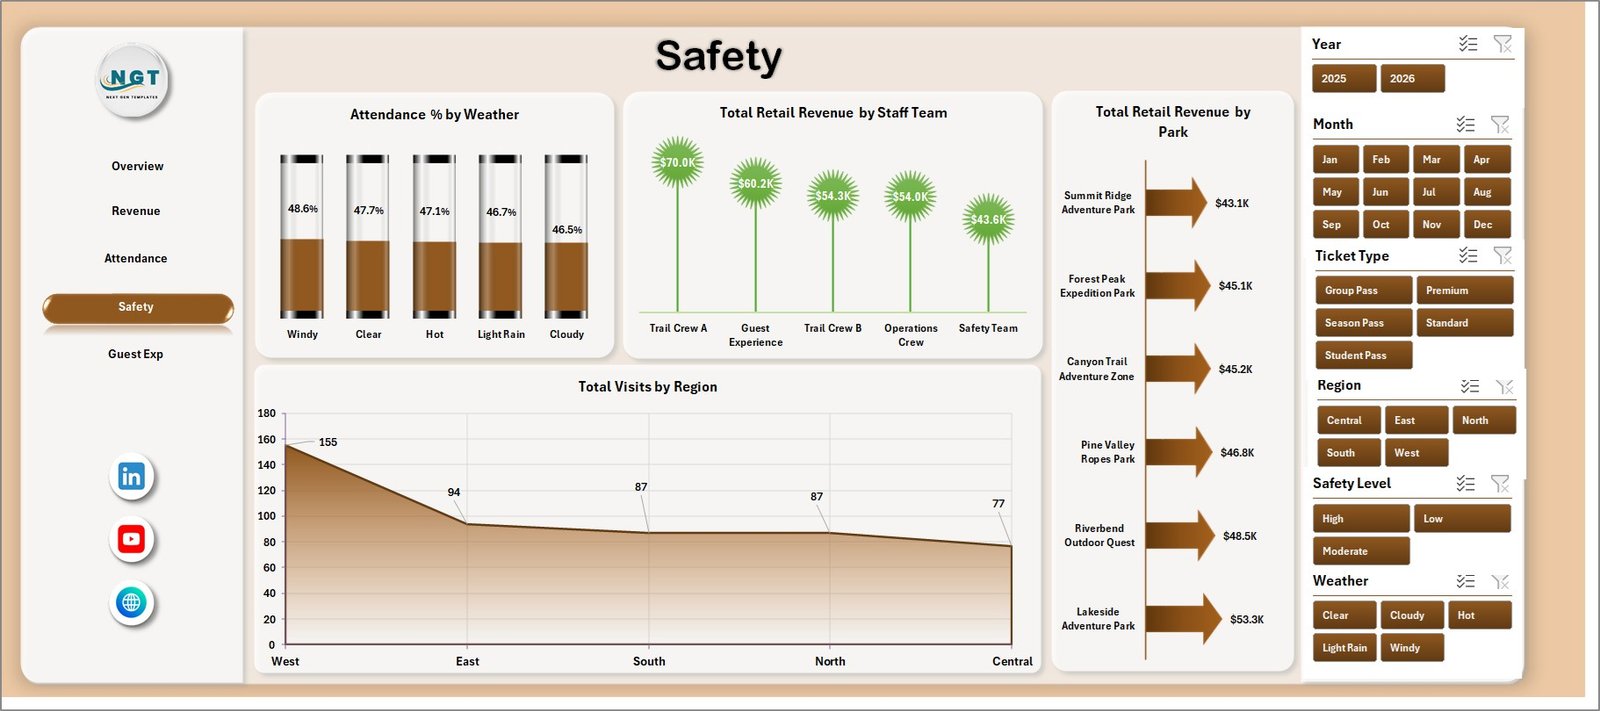
The Safety sheet connects operational context with performance. Attendance % by Weather helps users see how weather conditions affect participation. Total Retail Revenue by Staff Team compares team-level retail contribution. Total Retail Revenue by Park highlights which locations drive add-on sales. Total Visits by Region supports regional demand planning and promotion review.
5 – Guest Exp
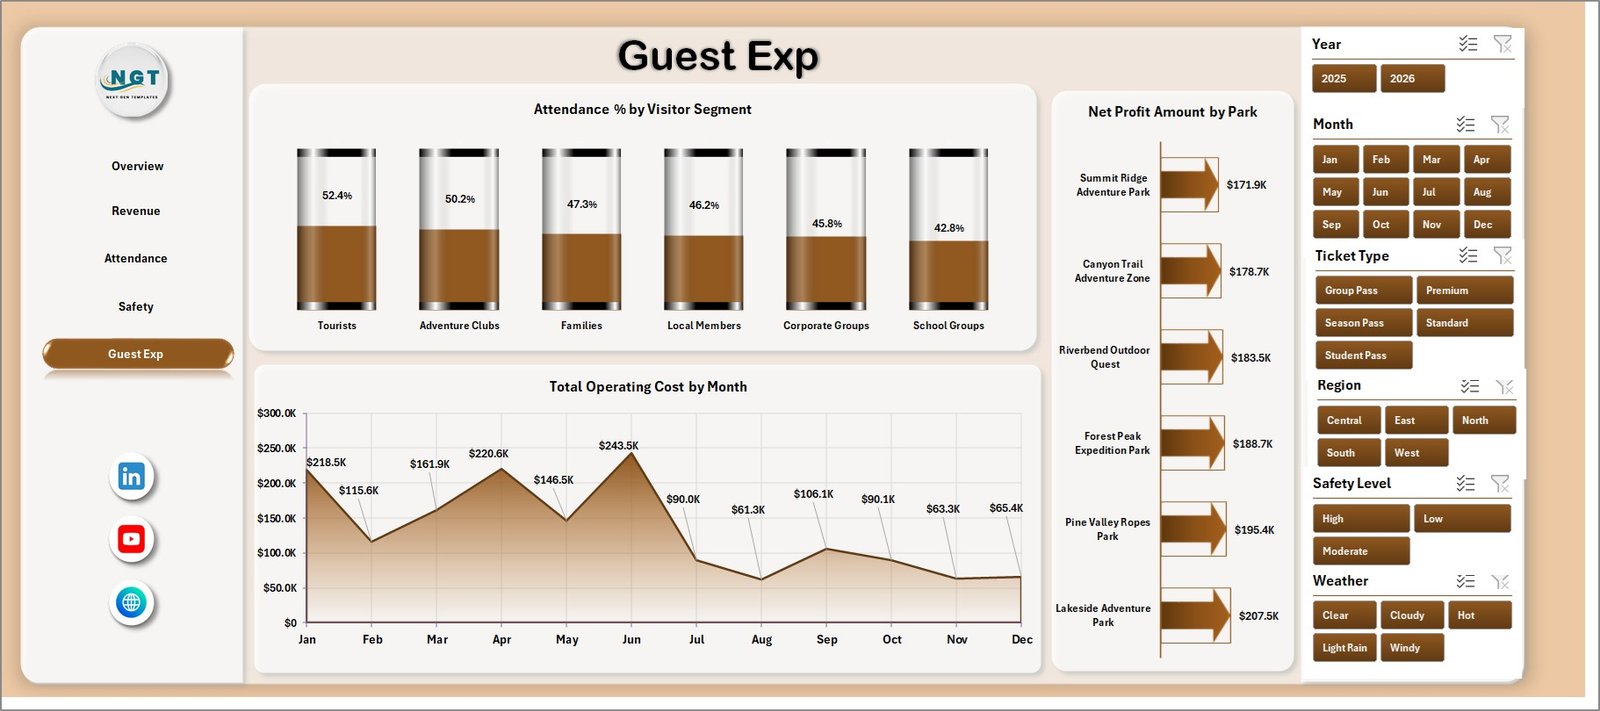
The Guest Exp page focuses on visitor experience and park profitability. Attendance % by Visitor Segment helps managers understand which guest groups are most engaged. Total Operating Cost by Month shows cost movement across the reporting period. Net Profit Amount by Park compares park-level profit so leaders can spot strong and weak locations.
6 – Data Sheet Tab
The Data sheet is the input area for your records. Add your adventure park data in the same format as the sample table, keeping the same field names and structure so the pivot tables and charts can refresh properly.

7 – Support Sheet
The Support sheet contains the pivot tables used to create the dashboard dynamically. After updating the Data sheet, go to the Data tab in the Excel ribbon and click Refresh All. Microsoft also documents the PivotTable refresh workflow here: Refresh PivotTable data. You can keep this sheet hidden for normal end users.

Outdoor Adventure Parks Dashboard in Excel vs. Google Sheets vs. Paid CRM/SaaS – Feature Comparison
| Feature | This Excel dashboard | Google Sheets alternative | Paid park SaaS |
|---|---|---|---|
| Cost | One-time template purchase | Low software cost plus dashboard build time | Monthly or annual subscription |
| Platform | Microsoft Excel | Browser spreadsheet | Vendor cloud system |
| Setup time | Replace data and refresh | Build formulas, pivots, slicers, and charts | Implementation and onboarding |
| Real-time team collaboration | Available through OneDrive or SharePoint | Native collaboration | Usually included by plan |
| Mobile access | Limited through Excel mobile or shared files | Good browser access | Usually included |
| Customizable fields | Editable workbook, pivots, and charts | Editable but manual | Often limited by vendor settings |
| Share with link | Possible through Microsoft sharing | Native sharing | Login-controlled sharing |
| Year-1 cost at 5 users | Template price plus any Microsoft licensing | Low license cost plus setup time | Often hundreds or thousands |
| Park analytics | Pre-built views for revenue, visitors, cost, profit, attendance, safety, weather, retail, parks, and activities | Requires manual dashboard design | Depends on reporting module |
Who Should Use This Template
This template is best for outdoor adventure park owners, attraction managers, tourism operators, finance analysts, operations managers, safety coordinators, guest experience teams, and consultants who already have structured data and want a repeatable Excel reporting layer.
It is not a ticketing platform, waiver system, incident logging product, reservation engine, POS system, or CRM. Use it after your operational data has been exported or entered into the Data sheet.
Real-World Use Cases
Weekly operations review: A park manager filters by weather, activity, and visitor segment to understand which conditions are helping or hurting attendance.
Finance review: A finance analyst compares ticket revenue, retail revenue, operating cost, combined revenue, and net profit by month, park, and attraction type.
Guest experience planning: A guest experience lead reviews visitor segment attendance and net profit by park before planning staffing, signage, upsells, and activity promotions.
Advantages of Outdoor Adventure Parks Dashboard in Excel
- It gives parks a ready structure instead of starting from a blank workbook.
- It connects finance, visitor demand, safety context, retail revenue, and guest experience in one file.
- It can be refreshed after new records are added to the Data sheet.
- It uses familiar Excel tools, so users can customize the workbook without buying another reporting platform.
- It supports recurring reviews because the same metrics can be compared by month, quarter, park, activity, and region.
Opportunities for Improvement
- Add data validation to the Data sheet so ticket types, regions, weather values, and activities remain consistent.
- Create clear KPI definitions for attendance percentage, combined revenue, net profit, and operating cost.
- Keep a clean monthly export from ticketing, retail, and operations systems before refreshing the dashboard.
- Use Power Query if your source data comes from multiple files or systems.
Best Practices
- Use the same park names, regions, ticket types, visitor segments, and activity names every month.
- Keep one row per transaction, visit, activity, or reporting record based on the template structure.
- Refresh all pivots after changing the Data sheet.
- Review attendance together with visitor count so percentages do not mislead the analysis.
- Protect or hide the Support sheet after setup so end users do not accidentally change pivot tables.
Explore Relevant Templates
You can download the Outdoor Adventure Parks Dashboard in Excel from NextGenTemplates. You may also like Adventure Tourism Dashboard in Power BI, Eco Lodges Dashboard in Power BI, and Destination Management Companies Dashboard in Power BI.
Frequently Asked Questions
What is included in the Outdoor Adventure Parks Dashboard in Excel?
It includes Overview, Revenue, Attendance, Safety, Guest Exp, Data Sheet, and Support Sheet tabs, with KPI cards, slicers, charts, and pivot-backed analysis.
Can I use my own park data?
Yes. Replace the sample records in the Data sheet using the same format, then refresh the workbook.
Do I need macros?
No macro requirement is described for this dashboard. The workflow is based on Excel data, slicers, charts, pivots, and Refresh All.
Can I customize the dashboard?
Yes. You can edit charts, pivots, formulas, colors, fields, and sheet layout in Excel.
Is this a reservation or ticketing system?
No. It is a reporting dashboard template, not a live booking, ticket scanning, waiver, incident, POS, or CRM system.
Can I hide the Support sheet?
Yes. The Support sheet contains pivot tables and can be hidden after setup.
About the Author
Built by PK – Microsoft Certified Professional with 15+ years of Excel, Google Sheets, and Power BI experience. Founder of NextGenTemplates, reaching 300K+ subscribers across YouTube channels. Every template is hand-built and tested before release.
Conclusion
The Outdoor Adventure Parks Dashboard in Excel gives park teams a practical way to review revenue, visitors, operating cost, net profit, attendance, ticket revenue, retail revenue, weather, safety level, regions, activities, and park performance in one editable workbook. It is a strong fit when you already have structured data and need a faster way to turn it into recurring management insight.
For more tutorials and templates, visit PK An Excel Expert on YouTube.
Last updated: July 19, 2026