According to the World Wildlife Fund, global wildlife populations have declined by 69% since 1970, making data-driven conservation tracking more critical than ever. The Wildlife Conservation KPI Scorecard in Excel monitors 15+ conservation KPIs across 4 structured worksheets, delivering MTD and YTD trend charts, actual vs target comparisons, and color-coded performance indicators — all in a single Excel file that takes under 10 minutes to set up.
Click here to Purchase the Wildlife Conservation KPI Scorecard in Excel
Whether you manage a national park, run a wildlife NGO, or coordinate habitat restoration projects, tracking species populations, funding utilization, patrol coverage, and volunteer engagement manually is inefficient and error-prone. This ready-to-use scorecard template replaces scattered spreadsheets and expensive conservation software with a structured, formula-driven performance monitoring system.
Key Features of Wildlife Conservation KPI Scorecard in Excel
Click here to Purchase the Wildlife Conservation KPI Scorecard in Excel
The Wildlife Conservation KPI Scorecard in Excel includes 4 worksheets designed for structured conservation performance monitoring. The Scorecard sheet displays all KPIs with Actual vs Target values and conditional formatting. The KPI Trend sheet provides individual metric analysis with MTD and YTD trend charts. Here are the main features:
- Scorecard Dashboard View — Displays all conservation KPIs with Actual vs Target values, MTD and YTD comparisons, and visual performance indicators using conditional formatting. Select any month from the dropdown to update all metrics instantly.
- KPI Trend Analysis — Select any individual KPI from a dropdown to view its Group, Unit, Type (Lower the Better or Upper the Better), Formula, and Definition alongside MTD and YTD trend charts comparing Actual, Target, and Previous Year numbers.
- Structured Data Entry — The Input Data sheet provides a clean layout for recording monthly actual values, targets, and historical data for each KPI.
- Built-in KPI Knowledge Base — The KPI Definition sheet stores each KPI’s name, group, unit, formula, and definition so every team member understands what each metric measures.
- Automatic Calculations — All MTD, YTD, variance, and trend calculations are formula-driven with no manual computation needed.
- Conservation-Specific Metrics — Track species population counts, habitat restoration acres, anti-poaching patrol coverage, funding utilization rates, volunteer engagement hours, and endangered species recovery indices.
Scorecard Pages Explanation
1. Scorecard Sheet
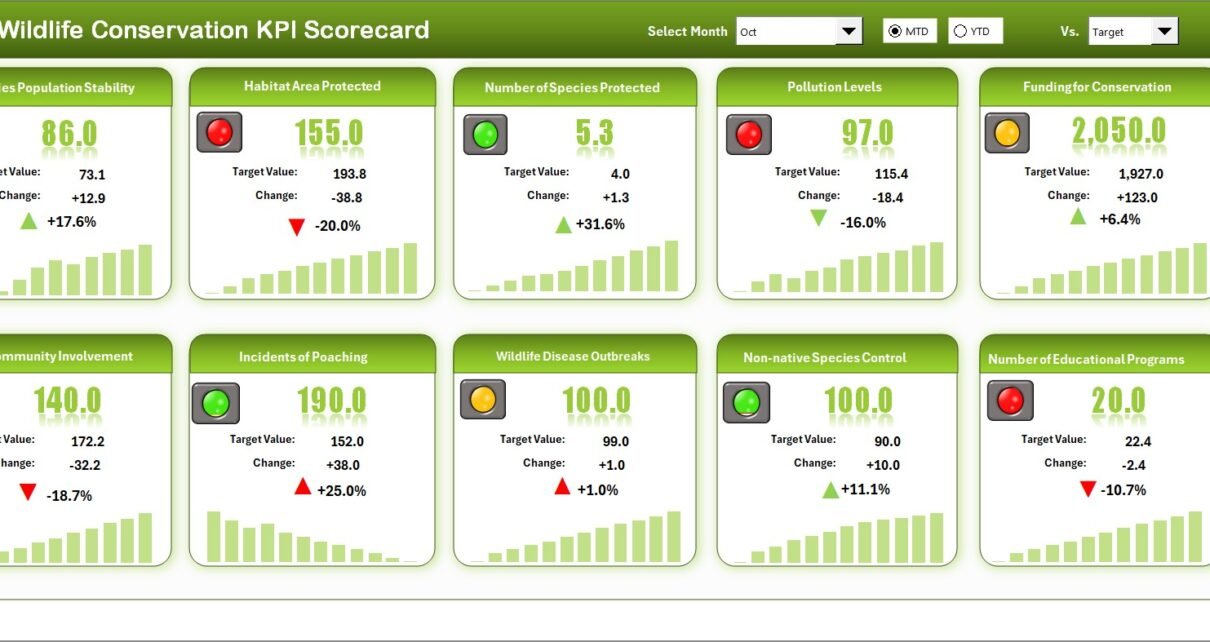
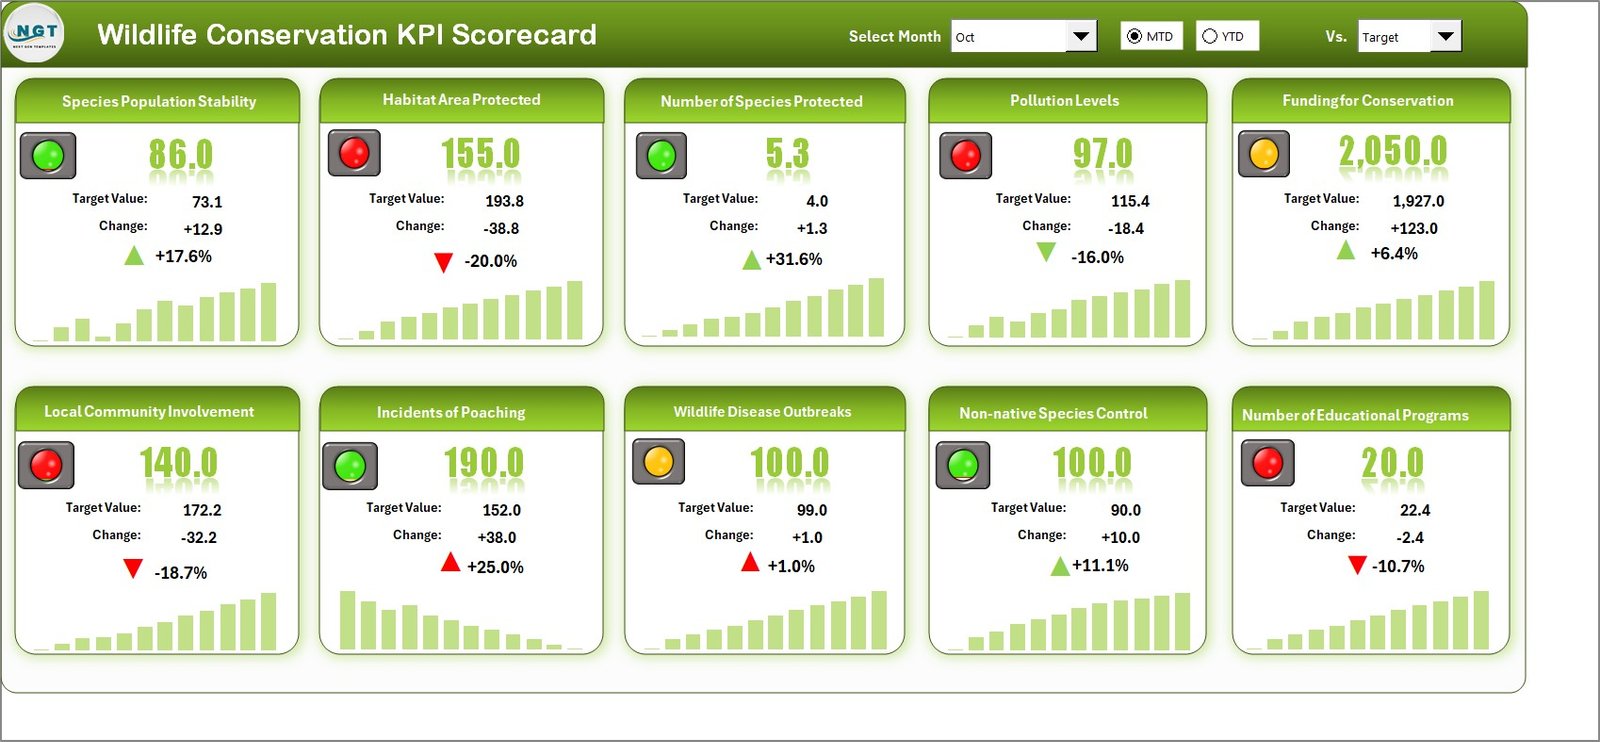
Wildlife Conservation KPI Scorecard in ExcelThe Scorecard sheet is the main interface where you can view KPI performance. Key features include:
- Dropdown Menus: Select the month, MTD (Month-to-Date), or YTD (Year-to-Date) for performance analysis.
- Actual vs Target Values: Compare actual performance against targets for each KPI.
- Visual Indicators: Quickly see performance status using color-coded visuals or conditional formatting.
- Comprehensive KPI Overview: Display all relevant information about KPIs, including MTD and YTD comparisons.
2. KPI Trend Sheet
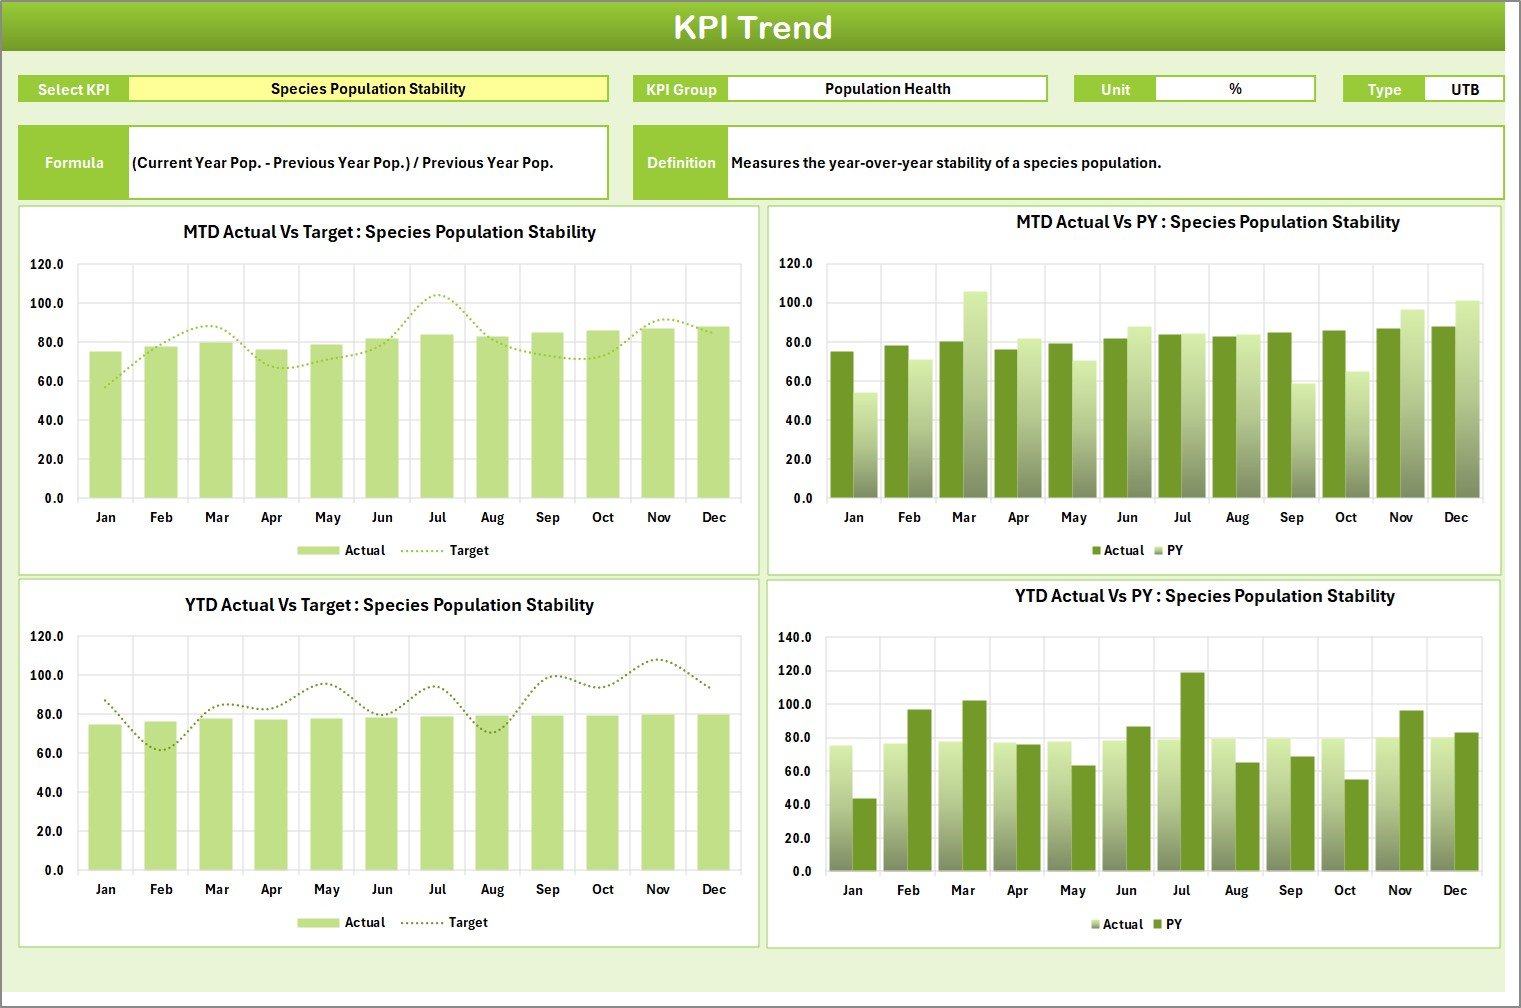 KPI Trend Sheet
Here you can select the KPI name from the dropdown available on range C3. The sheet displays the KPI Group, Unit of KPI, Type of KPI (Lower the Better or Upper the Better), Formula of the KPI, and Definition of the KPI. MTD and YTD trend charts show Actual, Target, and Previous Year numbers side by side for detailed performance analysis.
3. Input Data Sheet
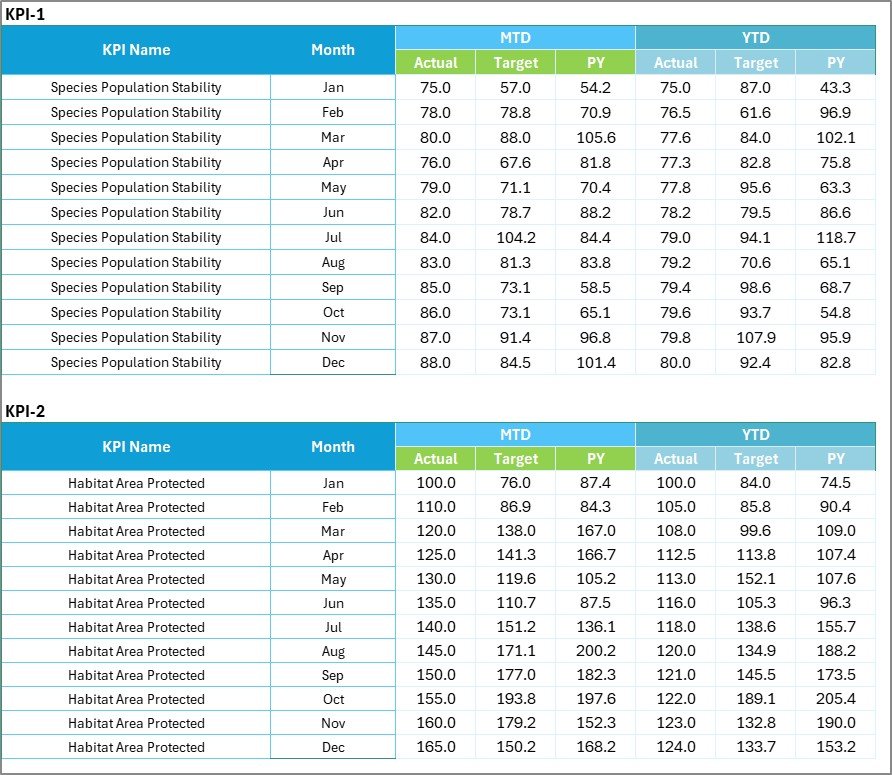 Input Data Sheet
The Input Data sheet is where you enter all KPI data. Record actual values, targets, and other metrics for each KPI. The sheet offers flexibility to easily update data as new results become available, ensuring the scorecard remains current with the latest conservation performance numbers.
4. KPI Definition Sheet
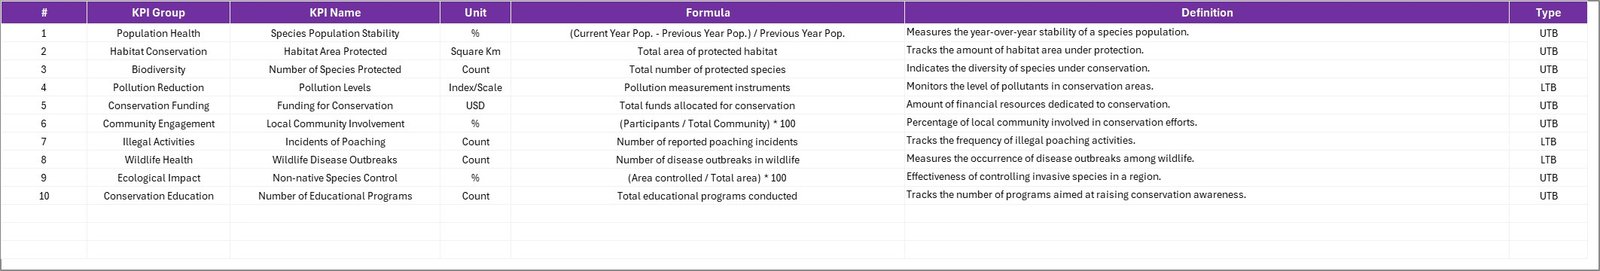 KPI Definition Sheet
In this sheet, you enter the KPI Name, KPI Group, Unit, Formula, and KPI Definition. This serves as a reference guide so all stakeholders — from field officers to donors — understand exactly what each conservation metric tracks and how it is calculated.
Wildlife Conservation KPI Scorecard vs. Google Sheets Scorecard vs. Paid Conservation Software — Feature Comparison
| Feature | Wildlife Conservation KPI Scorecard in Excel | Google Sheets Scorecard | SMART Conservation Software |
|---|---|---|---|
| Cost | $12.99 one-time | Free (limited features) | $50-200/user/month |
| Platform | Microsoft Excel (desktop + web) | Google Sheets (web only) | Cloud-based SaaS |
| Setup Time | Under 10 minutes | 30-60 minutes (build from scratch) | 2-4 weeks onboarding |
| Real-time Collaboration | Via SharePoint/OneDrive | ✅ Native | ✅ Native |
| Offline Access | ✅ Full offline | ❌ Requires internet | ❌ Requires internet |
| Customizable KPIs | ✅ Unlimited | ✅ Manual setup | Limited to plan tier |
| MTD/YTD Trend Charts | ✅ Built-in | Manual chart creation | ✅ Built-in |
| Year-1 Cost (5 users) | $12.99 total | $0 | $3,000-12,000 |
For conservation teams that want structured KPI tracking without paying thousands for enterprise software, the Wildlife Conservation KPI Scorecard in Excel sits in the sweet spot.
Who Should Use This Template
Click here to Purchase the Wildlife Conservation KPI Scorecard in Excel
Perfect for:
- Wildlife conservation NGOs and field project managers tracking species recovery and habitat restoration
- Government wildlife departments monitoring anti-poaching operations and funding allocation
- Environmental consultants reporting conservation KPIs to donors and grant providers
- Zoo and sanctuary managers measuring animal welfare and breeding program outcomes
- University researchers tracking biodiversity indices and ecological monitoring KPIs
Not a fit if:
- You need GIS-integrated spatial conservation tracking with satellite data feeds and real-time mapping
- Your team requires real-time IoT sensor integration for live wildlife movement monitoring
- You need multi-language regulatory compliance reporting for international conservation bodies
Real-World Use Cases
Priya manages conservation projects for a wildlife NGO in East Africa. She uses the Wildlife Conservation KPI Scorecard in Excel to track 18 KPIs including species sighting frequency, anti-poaching patrol hours, habitat acres restored, and donor fund utilization rate. Each quarter, she generates MTD and YTD reports for her board — replacing a $4,800/year conservation SaaS platform with a $12.99 one-time Excel template.
James coordinates a marine turtle conservation program in Southeast Asia. He tracks nest counts, hatchling survival rates, beach patrol coverage, and volunteer engagement hours. The KPI Trend sheet helps him identify seasonal patterns and adjust patrol schedules. His entire team accesses the file via OneDrive without per-user licensing fees.
Dr. Anika runs a government wildlife department in South America. She monitors endangered species recovery indices, protected area expansion, illegal logging incidents, and community engagement scores. The Scorecard sheet gives her a single-page overview for monthly briefings with ministry officials — no training or software installation needed.
Advantages of Wildlife Conservation KPI Scorecard in Excel
Click here to Purchase the Wildlife Conservation KPI Scorecard in Excel
- One-time $12.99 cost with no recurring subscription fees — significantly cheaper than SMART, WildTrack, or custom conservation databases
- Works offline — essential for field stations and remote conservation sites with limited internet connectivity
- No technical training needed — anyone familiar with basic Excel can start using the scorecard in minutes
- Fully customizable — add, remove, or modify KPIs to match your specific conservation project requirements
- Shareable across teams — save to OneDrive or SharePoint for real-time collaboration without per-user costs
- Built-in trend analysis — MTD and YTD charts let you spot seasonal patterns and long-term performance trends
Opportunities for Improvement
- The template does not include GIS mapping or spatial data visualization — teams needing geographic analysis should pair it with a dedicated GIS tool
- No automated data import from IoT sensors, camera traps, or GPS collars — data entry is manual
- The scorecard tracks monthly data — weekly or daily tracking would require structural modifications to the worksheets
- No built-in multi-language support — column headers and labels are in English only
Best Practices
Click here to Purchase the Wildlife Conservation KPI Scorecard in Excel
- Define KPIs before entering data — Complete the KPI Definition sheet first so the scorecard structure is clear for all team members
- Update data monthly — Enter actual values by the 5th of each month for consistent MTD and YTD comparisons
- Use the KPI Trend sheet for board presentations — Select individual KPIs to show detailed trend analysis with historical context
- Back up regularly — Save copies to OneDrive or SharePoint and maintain monthly backups of the master file
- Customize for your conservation focus — Modify KPI names, groups, and formulas to match your specific project (marine, terrestrial, freshwater, etc.)
- Refer to Microsoft Excel Support for advanced formula customization and conditional formatting tips
Explore Relevant Templates
📊 Wildlife Conservation KPI Dashboard in Excel — A 7-page interactive dashboard version with detailed charts, analysis pages, and data sheets for deeper conservation analytics.
🌿 Eco-Tourism KPI Dashboard in Excel — Track sustainability, financial, and visitor performance metrics for eco-tourism and sustainable travel operations.
🐾 Animal Shelter KPI Scorecard in Excel — Monitor animal intake, adoption rates, medical outcomes, and shelter capacity utilization with MTD/YTD tracking.
Browse all Excel Dashboard Templates and KPI Dashboard Templates on NextGenTemplates.
Also check: Animal Shelter KPI Scorecard Blog Post
Frequently Asked Questions
Click here to Purchase the Wildlife Conservation KPI Scorecard in Excel
What KPIs does the Wildlife Conservation KPI Scorecard track?
The Wildlife Conservation KPI Scorecard in Excel tracks 15+ conservation metrics including species population counts, habitat restoration progress, anti-poaching coverage, funding utilization, volunteer hours, and endangered species recovery indices. All KPIs are customizable from the KPI Definition sheet.
How long does setup take?
Setup takes under 10 minutes. Enter your KPI definitions, add monthly actual and target values in the Input Data sheet, and the Scorecard and Trend sheets update automatically with formulas and charts.
Can I add my own custom conservation KPIs?
Yes. The KPI Definition sheet accepts unlimited custom KPIs. Add your KPI name, group, unit, formula, and definition — the scorecard structure automatically incorporates new metrics.
How does this compare to paid conservation management software like SMART?
SMART and similar platforms cost $50-200 per user per month and require weeks of onboarding. The Wildlife Conservation KPI Scorecard in Excel costs $12.99 one-time, works offline, and delivers MTD/YTD tracking with trend charts — without subscription fees or per-user costs.
Does the scorecard work on Mac?
Yes. The Wildlife Conservation KPI Scorecard works on Microsoft Excel for Mac, Windows, and Excel Online. All formulas, charts, and conditional formatting are fully compatible across platforms.
Can multiple team members use the same scorecard?
Yes. Save the file to OneDrive or SharePoint and multiple users can edit simultaneously. There are no per-user fees or seat limits — share with your entire conservation team.
What Excel version do I need?
The scorecard works with Excel 2016 and later versions, including Microsoft 365. All features including conditional formatting, dropdown menus, and trend charts are supported.
About the Author
Built by PK — Microsoft Certified Professional with 15+ years of Excel, Google Sheets, and Power BI experience. Founder of NextGenTemplates, reaching 300K+ subscribers across YouTube channels. Every template is hand-built and tested before release.
Conclusion
The Wildlife Conservation KPI Scorecard in Excel gives conservation teams a structured, affordable, and easy-to-use system for tracking species recovery, habitat restoration, funding allocation, and operational KPIs. With 4 organized worksheets, built-in trend charts, and automatic calculations, it replaces manual tracking and expensive software with a one-time $12.99 Excel template.
Click here to Purchase the Wildlife Conservation KPI Scorecard in Excel
✅ Instant download · One-time payment · No subscription
Visit our YouTube channel for step-by-step video tutorials: Youtube.com/@PK-AnExcelExpert