Eco Lodges Dashboard in Power BI is built for eco-lodge owners, hospitality managers, sustainable tourism operators, revenue analysts, and finance teams who need a clear way to review lodge revenue, operating cost, net profit, guest behavior, booking channels, review scores, and monthly trends. Eco-lodge teams often work with bookings from direct channels, online travel agencies, group reservations, repeat guests, and different lodge types. When this data is scattered across exports and manual reports, it becomes difficult to see what is actually driving profit.
This Power BI dashboard turns those records into KPI cards, slicers, charts, and five focused report pages. It helps users answer practical questions: Which lodge is producing the best revenue? Which guest type is staying longer? Which channel is bringing profitable bookings? Which month needs deeper attention? For official guidance on using Power BI Desktop and publishing reports, see Microsoft Power BI documentation.
Key Features of Eco Lodges Dashboard in Power BI
- 5 Power BI report pages covering Overview, Lodge Performance, Guest Analysis, Channel Analysis, and Monthly Trend.
- 5 executive KPI cards for Total Revenue, Total Operating Cost, Net Profit, Avg Review Score, and Total Nights.
- Revenue and operating cost analysis to compare financial movement across months and lodge categories.
- Lodge-level reporting for revenue, profit, and review score by lodge.
- Guest segment insights for revenue, nights, and review score by guest type.
- Booking channel reporting for channel revenue, booking status, and profit margin.
- Monthly trend visuals for net profit, bookings, and nights by month name.
- Interactive slicers so managers can filter the report quickly during business reviews.
- Editable PBIX file that can be customized in Power BI Desktop.
Dashboard Pages Explanation
1. Overview Page
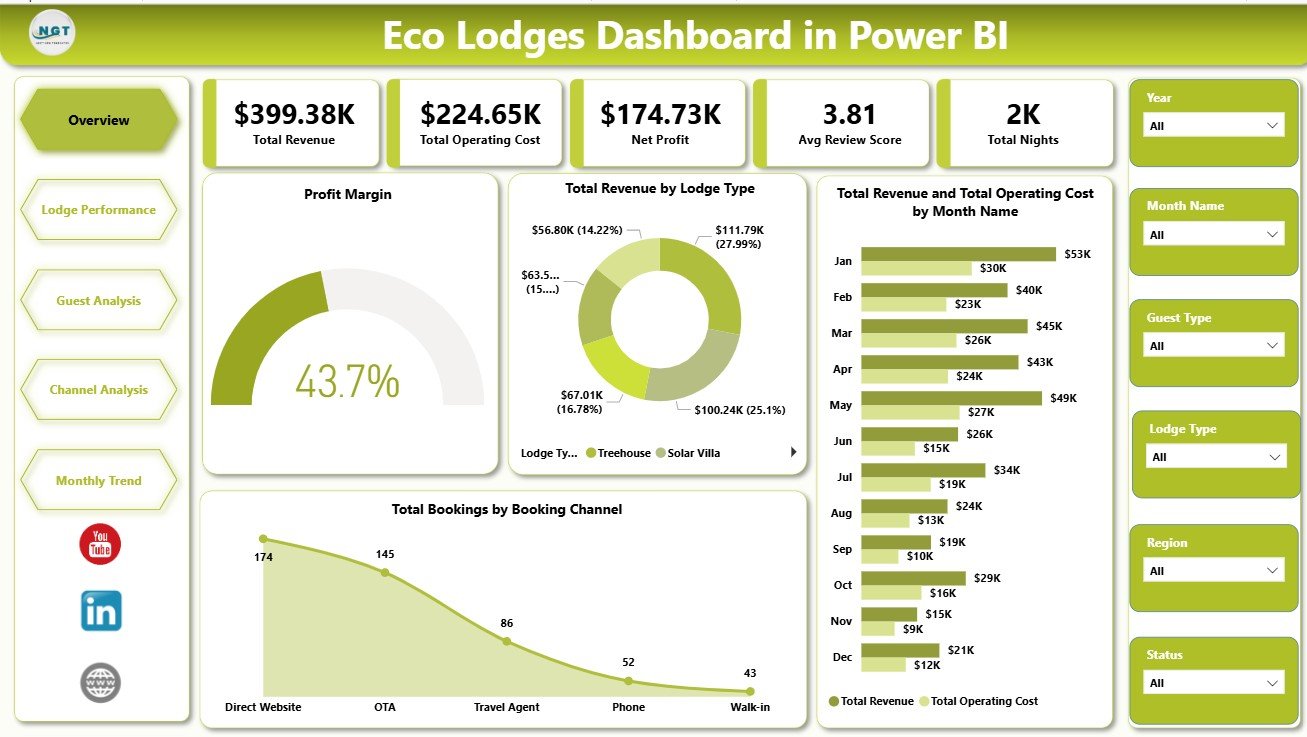
The Overview Page gives a high-level snapshot of eco-lodge performance. At the top, KPI cards show Total Revenue, Total Operating Cost, Net Profit, Avg Review Score, and Total Nights. These cards help owners and managers understand revenue, cost pressure, profitability, guest satisfaction, and stay volume before moving into deeper pages.
Profit Margin by Overall Bookings: This chart shows how efficiently bookings are converting into profit. It helps users check whether a high booking count is also producing a healthy margin.
Total Revenue by Lodge Type: This chart compares revenue by accommodation type. It helps identify which lodge types, cabins, villas, tents, cottages, or other categories are contributing the most revenue.
Total Revenue and Total Operating Cost by Month Name: This chart compares monthly income and operating cost. It helps managers spot months where revenue grew but cost increased faster.
Total Bookings by Booking Channel: This chart shows booking volume by source. It helps teams compare direct bookings, OTA bookings, agency bookings, corporate bookings, and other channels.
2. Lodge Performance
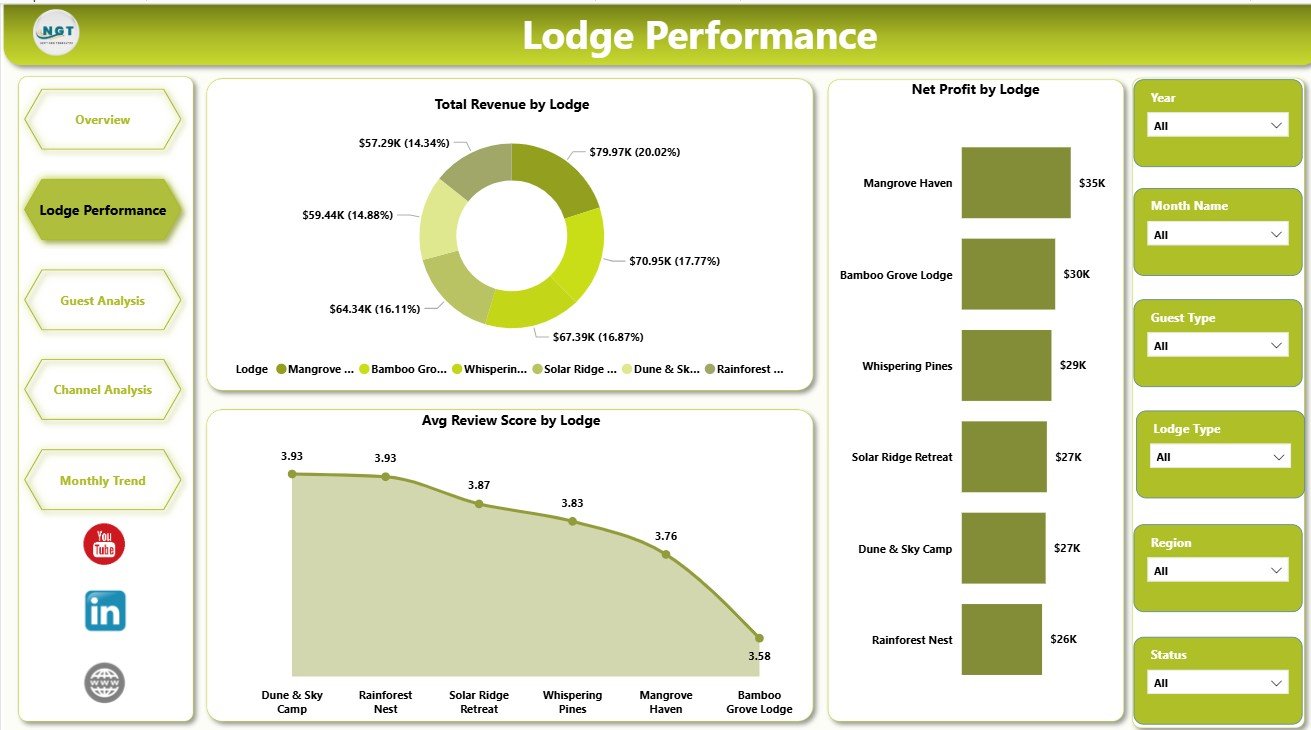
The Lodge Performance page compares individual lodges or properties. It includes Total Revenue by Lodge, Net Profit by Lodge, and Avg Review Score by Lodge. This page helps users identify high-performing locations, lodges with strong reviews, and properties where profit may need better pricing or cost control.
3. Guest Analysis
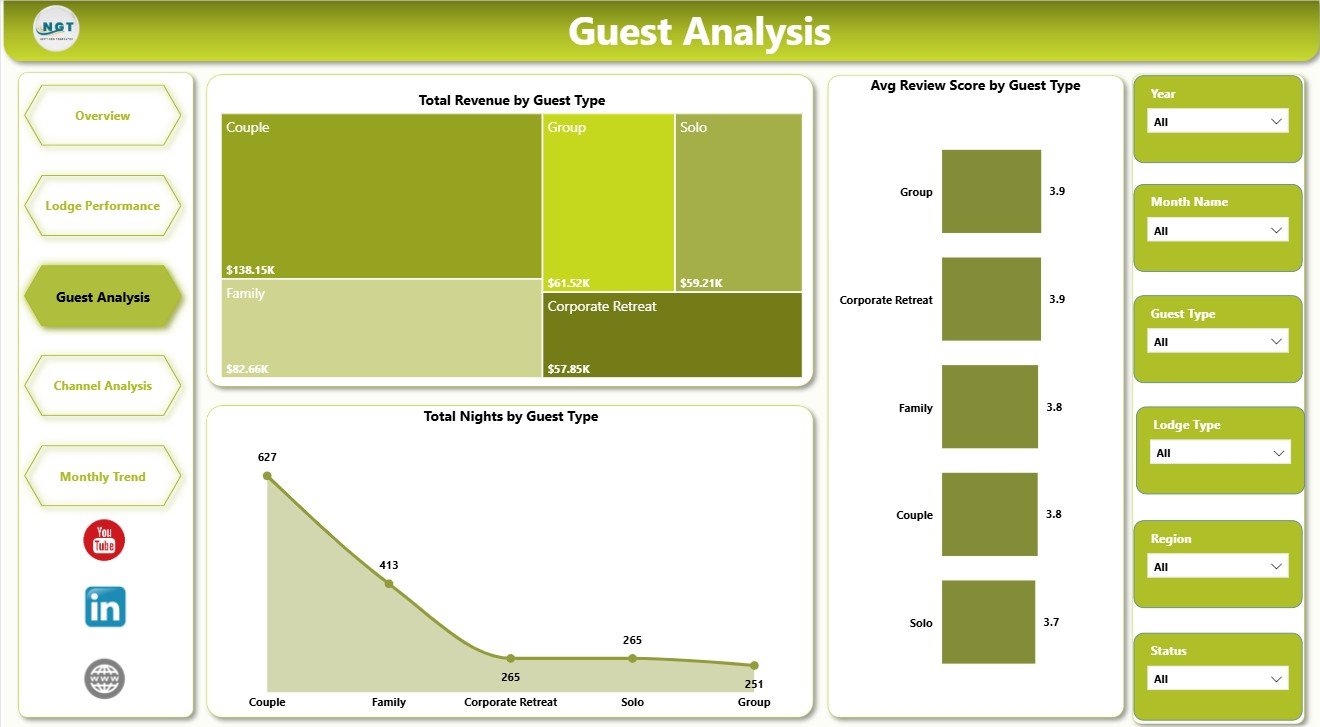
The Guest Analysis page focuses on guest segments. It includes Total Revenue by Guest Type, Total Nights by Guest Type, and Avg Review Score by Guest Type. This helps teams understand which guests stay longer, which segments generate stronger revenue, and which guest types report better experiences.
4. Channel Analysis
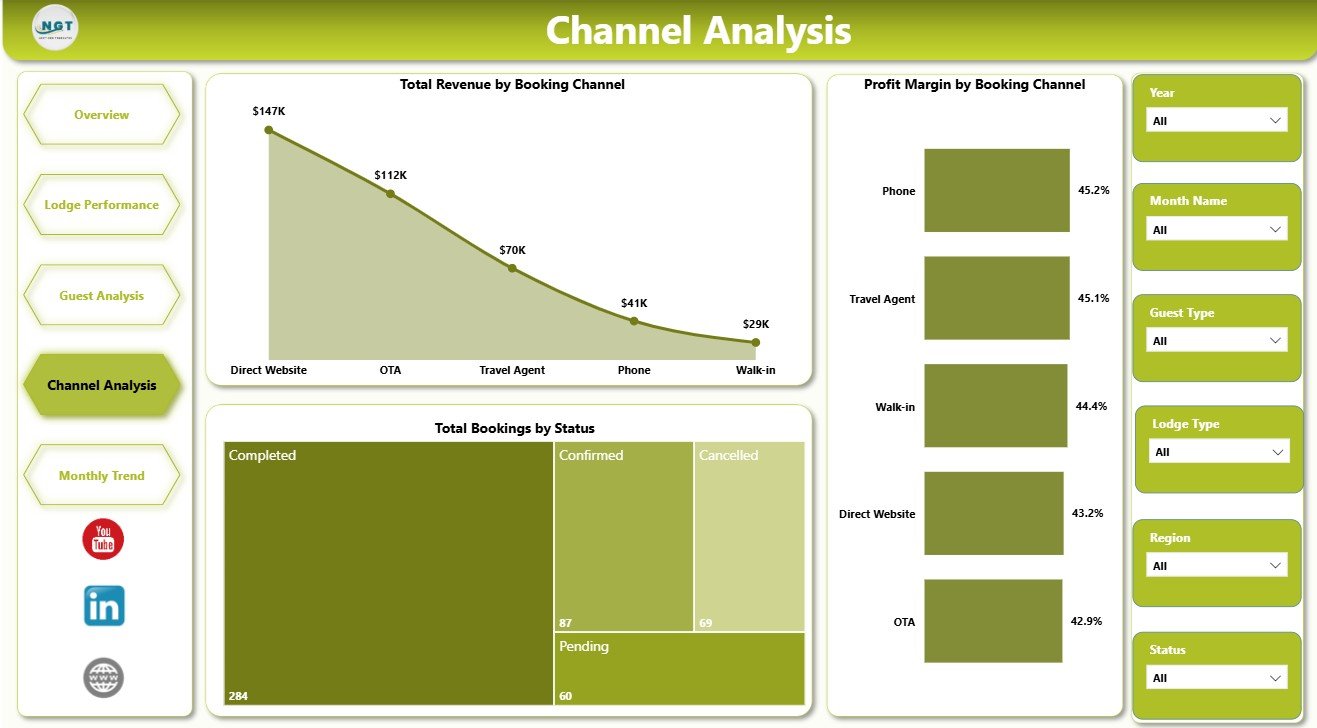
The Channel Analysis page reviews booking-source performance. It includes Total Revenue by Booking Channel, Total Bookings by Status, and Profit Margin by Booking Channel. This is useful for comparing channel quality, cancellation or booking status mix, and the real value of each source.
5. Monthly Trend
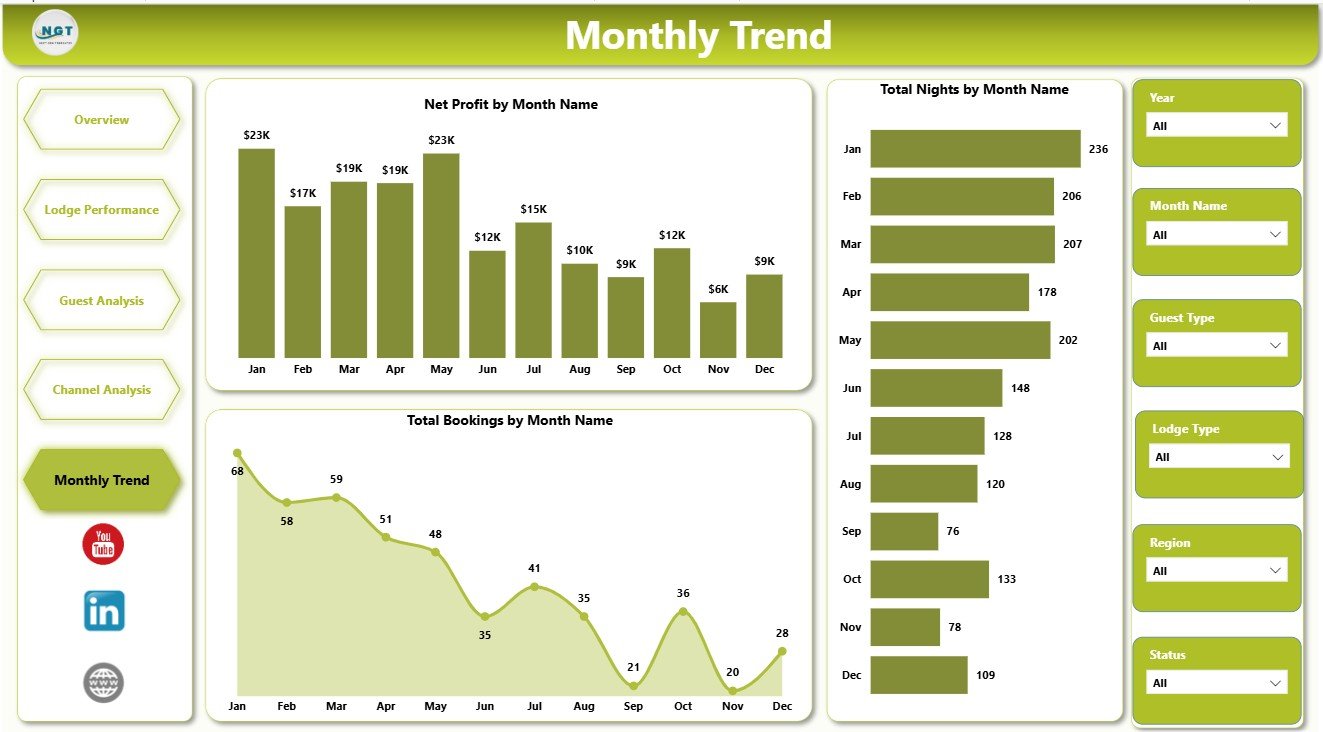
The Monthly Trend page shows movement across the year. It includes Net Profit by Month Name, Total Bookings by Month Name, and Total Nights by Month Name. This page helps users identify seasonal demand, strong travel periods, low-profit months, and months that need additional operational review.
Eco Lodges Dashboard in Power BI vs. Tableau vs. Paid Hotel SaaS – Feature Comparison
| Feature | Eco Lodges Dashboard in Power BI | Tableau or Qlik alternative | Paid hotel SaaS |
|---|---|---|---|
| Cost | $17.99 one-time | BI license or custom build cost | Recurring subscription |
| Platform | Power BI Desktop / Power BI Service | Separate BI platform setup | Vendor cloud system |
| Setup time | Open PBIX, replace data, refresh | Build model and visuals | Implementation and onboarding |
| Customizable fields | Editable report and model | Editable with BI skills | Limited by vendor settings |
| Mobile access | Available through Power BI Service/mobile if published | Available through vendor cloud | Usually included |
| Share with link | Possible through Power BI permissions | Possible with cloud setup | Usually login controlled |
| Year-1 cost at 5 users | $17.99 plus Microsoft licensing | Usually much higher | Often hundreds or thousands |
| Eco-lodge analytics | Built in across 5 pages | Must be designed | Depends on plan or module |
Who Should Use This Template
This template is useful for eco-lodge owners, boutique resort managers, sustainable tourism businesses, hospitality consultants, revenue analysts, finance teams, and Power BI users who already maintain structured booking or lodge-performance data. It works best when the goal is to report on revenue, operating cost, profit, nights, guest types, booking channels, review score, lodge performance, and monthly activity.
It is not meant to replace a PMS, reservation engine, channel manager, payment platform, accounting system, or live guest CRM. Use it as a reporting layer after your booking data has been exported or connected in a clean structure.
Real-World Use Cases
Anita, eco-lodge owner: Anita reviews the Overview and Monthly Trend pages before each monthly review. She can quickly compare revenue, cost, net profit, total nights, and booking movement.
Rahul, hospitality operations manager: Rahul uses Lodge Performance to compare lodges by revenue, profit, and review score. This helps him find locations with strong guest experience but weak margin.
Maria, sustainable tourism consultant: Maria uses Guest Analysis and Channel Analysis when advising clients. She can show which guest types and booking channels deserve more marketing focus.
Advantages of Eco Lodges Dashboard in Power BI
- Faster reporting: Start from a ready PBIX structure instead of building every page, chart, and slicer manually.
- Focused eco-lodge analysis: Pages are designed around lodge, guest, channel, and monthly performance questions.
- Better management reviews: KPI cards and charts support quick conversations about revenue, cost, profit, nights, and guest satisfaction.
- Editable design: Users can adjust fields, visuals, colors, measures, and page names in Power BI Desktop.
- One-time purchase: Useful for small and mid-size operators that do not need an enterprise hotel analytics platform.
Opportunities for Improvement
The dashboard depends on clean data. Users should keep lodge names, lodge types, guest types, booking channels, booking status, month names, revenue, operating cost, nights, and review scores consistent. Advanced users can extend the model with occupancy percentage, average daily rate, RevPAR, sustainability score, carbon impact, local sourcing percentage, marketing spend, or staff cost fields.
Best Practices
- Keep your source table structure consistent before refreshing the PBIX file.
- Use standardized names for guest type, lodge type, and booking channel.
- Refresh the report after every data update.
- Review Overview first, then move into Lodge Performance, Guest Analysis, Channel Analysis, and Monthly Trend.
- Publish to Power BI Service only after checking your Microsoft licensing and data governance rules.
Explore Relevant Templates
You can download this template from Eco Lodges Dashboard in Power BI. You may also like Eco Lodges Dashboard in Excel, Destination Management Companies Dashboard in Power BI, Adventure Tourism Dashboard in Power BI, and Hotel and Hospitality Revenue Dashboard in Power BI.
Frequently Asked Questions
What is included in the Eco Lodges Dashboard in Power BI?
The dashboard includes five Power BI pages: Overview, Lodge Performance, Guest Analysis, Channel Analysis, and Monthly Trend.
What KPI cards are available on the Overview page?
The Overview page includes Total Revenue, Total Operating Cost, Net Profit, Avg Review Score, and Total Nights.
Can I use my own lodge data?
Yes. You can replace the sample data or connect your approved eco-lodge data source, then refresh the report in Power BI Desktop.
Can I customize charts and fields?
Yes. The PBIX file is editable, so you can modify visuals, measures, slicers, labels, colors, and fields.
Is this dashboard a hotel booking system?
No. It is a reporting dashboard for analysis. It does not manage bookings, payments, accounting, or guest CRM workflows.
Can I share the dashboard online?
Yes, you can publish it through Power BI Service if your Microsoft licensing and data security policies allow it.
About the Author
Built by PK – Microsoft Certified Professional with 15+ years of Excel, Google Sheets, and Power BI experience. Founder of NextGenTemplates, reaching 300K+ subscribers across YouTube channels. Every template is hand-built and tested before release.
Conclusion
The Eco Lodges Dashboard in Power BI gives eco-lodge teams a practical way to monitor financial performance, guest behavior, channel quality, lodge results, and monthly trends from one report. Instead of switching between manual files and scattered exports, owners and managers can review KPI cards, charts, and slicers in a focused Power BI dashboard.
Visit our YouTube channel to learn step-by-step video tutorials.