Eco Lodges Dashboard in Excel is built for eco-lodge owners, resort managers, sustainable tourism operators, finance analysts, and hospitality teams who need a clear way to review lodge revenue, operating cost, profit, guest behavior, booking channels, cancellations, and monthly trends without building an Excel dashboard from scratch. Eco-lodge teams often manage bookings across direct channels, OTAs, agencies, groups, repeat guests, and multiple lodge types. This dashboard turns those records into KPI cards, slicers, charts, and analysis pages so managers can review performance quickly.
For official Excel guidance on refreshing data and working with PivotTables, see Microsoft Excel support.

Key Features of Eco Lodges Dashboard in Excel
- 5 dashboard pages covering Overview, Lodge Performance, Guest Analysis, Channel Analysis, and Monthly Trend.
- 4 executive KPI cards for Total Revenue, Net Profit, Total Nights, and Total Bookings.
- Lodge-level performance analysis for revenue, profit, bookings, and review scores by lodge.
- Guest segment reporting for revenue, nights, review score, and repeat guest percentage by guest type.
- Booking channel analysis for revenue, cancellation percentage, booking status, and revenue per night.
- Monthly trend tracking for profit, nights, cancellations, and booking movement.
- Excel slicers and pivot tables to filter and refresh the dashboard after updating the data sheet.
- Data and Support sheets so users can maintain records and keep the reporting model dynamic.
Dashboard Pages Explanation
1. Overview Page
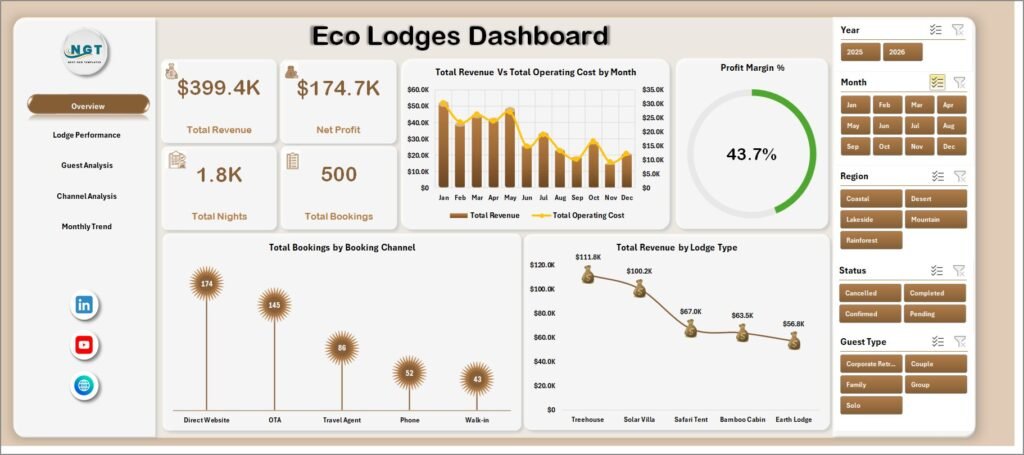
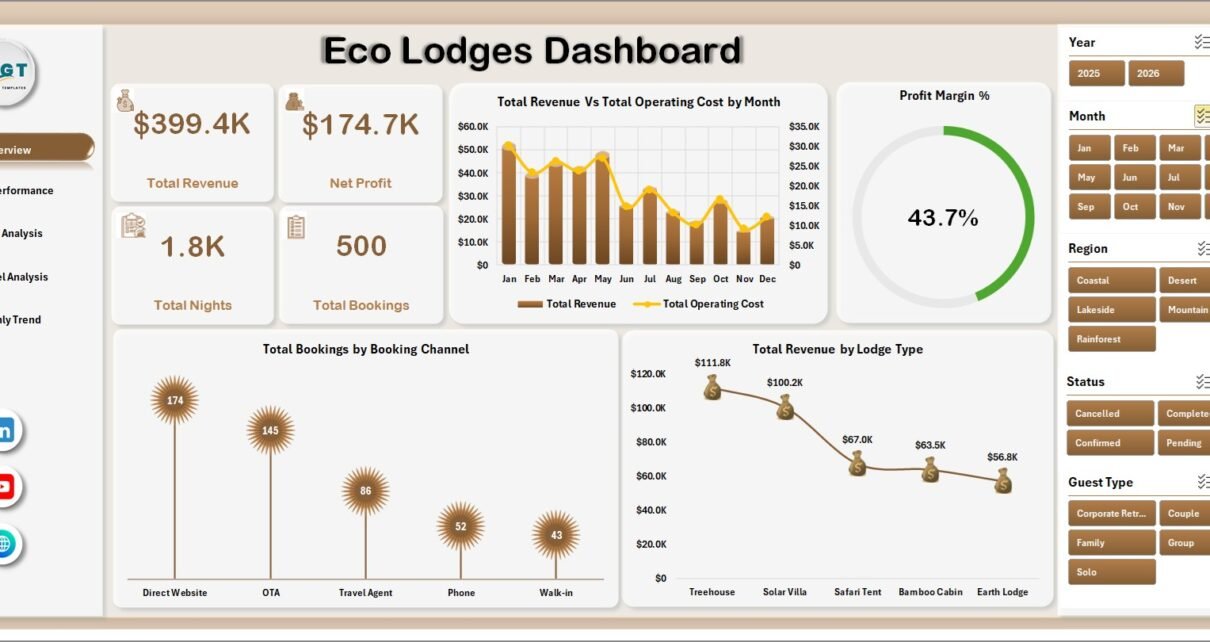
The Overview Page gives a high-level snapshot of eco-lodge performance. The top cards show Total Revenue, Net Profit, Total Nights, and Total Bookings, helping owners understand financial performance, occupancy volume, and reservation activity before moving into detailed pages.
Total Revenue Vs Total Operating Cost by Month: This chart compares income and cost across months. It helps managers spot months where revenue increased but operating cost also climbed.
Profit Margin % by Overall Performance: This chart gives a quick profitability view. It helps users understand whether the eco-lodge is converting revenue into profit at a healthy rate.
Total Bookings by Booking Channel: This chart shows booking volume by source. It helps managers compare direct bookings, OTA bookings, agency bookings, and other channels.
Total Revenue by Lodge Type: This chart shows which lodge types create the highest revenue. It supports pricing and capacity decisions across cabins, tents, villas, cottages, or other accommodation types.
2. Lodge Performance
The Lodge Performance page compares properties or lodge locations side by side. It includes Total Revenue by Lodge, Net Profit by Lodge, Total Bookings by Lodge, and Avg. Review Score by Lodge. This helps teams see which lodges are financially strong, which locations need better margin control, and how guest satisfaction differs across properties.

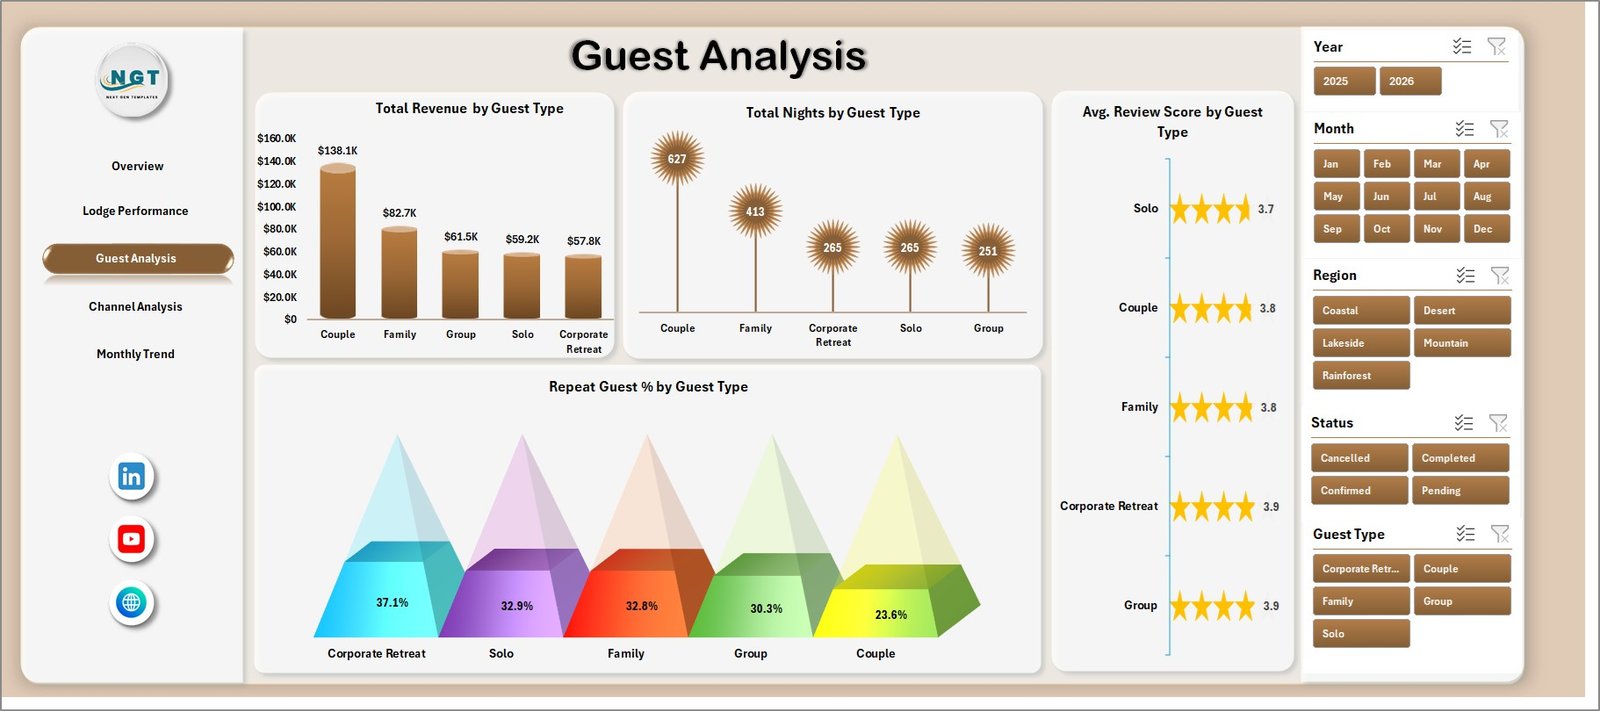
3. Guest Analysis
The Guest Analysis page focuses on guest segments. It includes Total Revenue by Guest Type, Total Nights by Guest Type, Avg. Review Score by Guest Type, and Repeat Guest % by Guest Type. This is useful for understanding which guests stay longer, spend more, rate the experience higher, or return more often.
4. Channel Analysis
The Channel Analysis page reviews booking source performance. It includes Total Revenue by Booking Channel, Cancellation % by Booking Channel, Total Bookings by Status, and Revenue Per Night by Booking Channel. Use this page to compare channel value, cancellation risk, booking status mix, and nightly revenue quality.

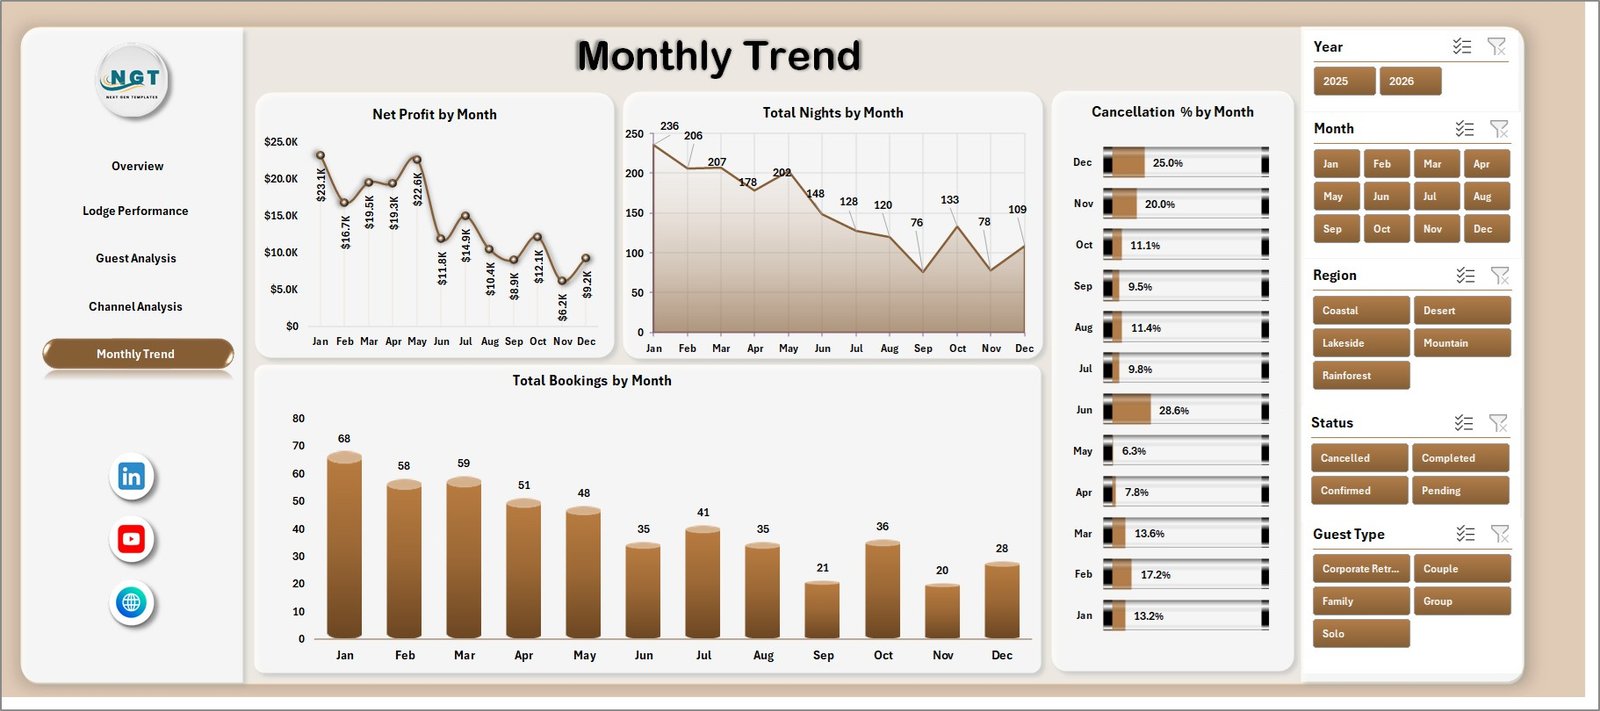
5. Monthly Trend
The Monthly Trend page shows time-based movement. It includes Net Profit by Month, Total Nights by Month, Cancellation % by Month, and Total Bookings by Month. This view helps users identify seasonal demand, low-profit periods, occupancy movement, and cancellation patterns.
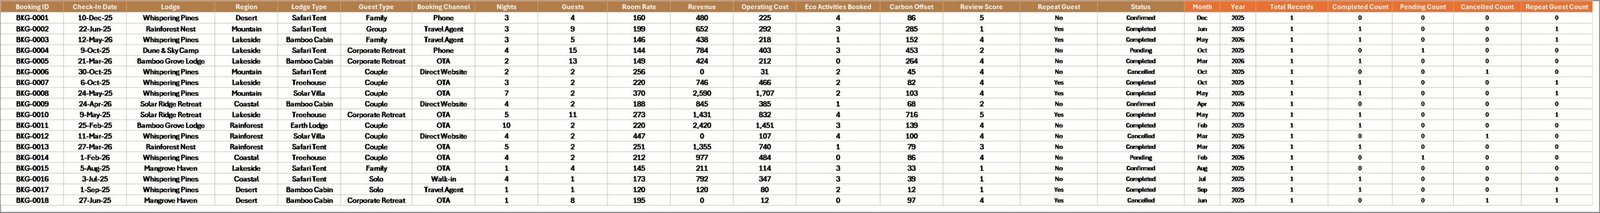
6. Data Sheet Tab
The Data sheet is the source table for the workbook. Add your eco-lodge booking records in the same format as the sample data, keep field names consistent, and refresh the workbook so KPI cards, charts, slicers, and pivots update correctly.
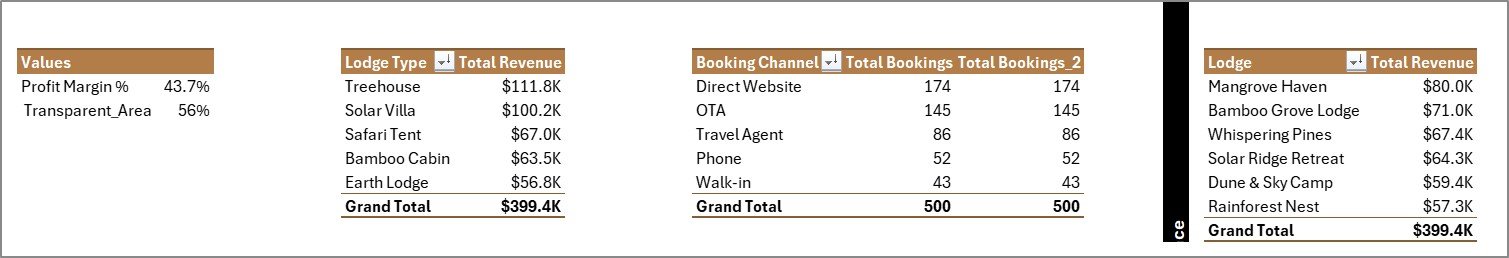
7. Support Sheet
The Support sheet contains the pivot tables used to drive the dashboard dynamically. After updating the Data sheet, go to the Data tab in the Excel Ribbon and click Refresh All. The pivots and charts will refresh, and the Support sheet can be hidden for normal users.
Eco Lodges Dashboard in Excel vs. Google Sheets vs. Paid Hotel SaaS – Feature Comparison
| Feature | Eco Lodges Dashboard in Excel | Google Sheets alternative | Paid hotel SaaS |
|---|---|---|---|
| Cost | $17.99 one-time | Free or template-based | Recurring subscription |
| Platform | Microsoft Excel | Browser-based spreadsheet | Vendor cloud platform |
| Setup time | Paste data and refresh | Import data and configure sharing | Requires onboarding |
| Customizable fields | Editable workbook structure | Editable sheet structure | Limited by vendor settings |
| Real-time team collaboration | Possible through OneDrive or SharePoint | Built in | Usually included |
| Mobile access | Possible through Excel mobile or web | Built in | Usually included |
| Share with link | Possible through Microsoft sharing | Built in | Usually login controlled |
| Eco-lodge analytics | Built in across 5 analysis pages | Must be configured | Depends on the vendor plan |
| Year-1 cost at 5 users | $17.99 plus existing Microsoft licensing | Depends on Workspace plan | Often hundreds or thousands |
Who Should Use This Template
This template is useful for eco-lodge owners, resort managers, hospitality operations teams, sustainable tourism consultants, finance analysts, and Excel users who already maintain structured booking records. It works well when the goal is to report on revenue, nights, profit, bookings, guest segments, booking channels, lodge types, cancellations, and monthly performance.
It is not meant to replace a reservation system, channel manager, payment tool, accounting system, PMS, or live guest CRM. It is best used as an Excel reporting layer after your booking data has been exported or maintained in a clean table.
Real-World Use Cases
Anita, eco-lodge owner: Anita reviews the Overview and Monthly Trend pages before each monthly business review. She can quickly compare revenue, net profit, bookings, nights, and cancellation movement.
Rahul, hospitality operations manager: Rahul uses the Lodge Performance page to compare revenue and review scores across lodges. This helps him find properties that have strong guest ratings but weaker profit margins.
Maria, sustainable tourism consultant: Maria uses Guest Analysis and Channel Analysis when advising eco-tourism clients. She can show which guest segments and booking channels deserve more marketing focus.
Advantages of Eco Lodges Dashboard in Excel
- Fast setup: Start from an already designed workbook instead of building pages, pivots, and charts manually.
- Familiar platform: Teams that already use Excel can update data and refresh the dashboard without adopting a new tool.
- Focused lodge reporting: The pages are built around lodge, guest, channel, and monthly performance questions.
- Cost control: A one-time Excel template can be practical for small and mid-size operators that do not need enterprise hotel software.
- Editable structure: Users can adjust charts, labels, formulas, pivots, colors, and source fields as needed.
Opportunities for Improvement
The dashboard depends on clean data. Users should keep month names, lodge names, guest types, booking channels, lodge types, booking status, revenue, operating cost, nights, review score, and repeat guest fields consistent. Advanced users can extend the workbook with occupancy percentage, average daily rate, RevPAR, sustainability score, carbon impact, local sourcing percentage, or staff cost fields.
Best Practices
- Keep one row per booking or stay record so pivot tables summarize correctly.
- Use consistent lodge, channel, status, and guest type names.
- Review revenue together with operating cost and profit, not separately.
- Refresh the workbook after every data update.
- Hide the Support sheet when sharing the dashboard with business users.
- Review cancellation percentage by channel before adjusting marketing spend.
Explore Relevant Templates
- Eco Lodges Dashboard in Excel – the product page for this downloadable template.
- Sustainable Tourism KPI Scorecard in Excel – useful for eco-tourism KPI and sustainability tracking.
- Destination Management Companies Dashboard in Power BI – related travel and tourism analytics dashboard.
- Catering Services Dashboard in Power BI – related hospitality operations dashboard.
- Browse more Excel Dashboard Templates.
Frequently Asked Questions
What is included in the Eco Lodges Dashboard in Excel?
The workbook includes Overview, Lodge Performance, Guest Analysis, Channel Analysis, Monthly Trend, Data Sheet, and Support Sheet tabs.
What KPI cards are available on the Overview page?
The Overview page includes Total Revenue, Net Profit, Total Nights, and Total Bookings.
Can I add my own lodge data?
Yes. Add or paste your records into the Data sheet using the same format, then refresh the workbook from the Excel Data tab.
What does the Support sheet do?
The Support sheet contains pivot tables used to drive dashboard charts and cards. You can hide it after setup.
Can I customize the charts and fields?
Yes. Because it is an Excel workbook, you can edit the data table, pivot tables, charts, formatting, slicers, and labels.
Is this dashboard a hotel booking system?
No. It analyzes structured booking and lodge performance data. It does not manage reservations, payments, or live channel inventory.
About the Author
Built by PK – Microsoft Certified Professional with 15+ years of Excel, Google Sheets, and Power BI experience. Founder of NextGenTemplates, reaching 300K+ subscribers across YouTube channels. Every template is hand-built and tested before release.
Conclusion
The Eco Lodges Dashboard in Excel gives eco-lodge and sustainable tourism teams a practical way to review revenue, net profit, nights, bookings, lodge performance, guest behavior, booking channels, cancellations, and monthly trends from one workbook. It is especially useful when you already have structured booking records and need a clean Excel reporting layer for management review.
Click here to purchase the Eco Lodges Dashboard in Excel.
Instant download. One-time payment. Editable Excel dashboard. No subscription.
For step-by-step Excel tutorials and template walkthroughs, visit YouTube.com/@PK-AnExcelExpert.
Last updated: June 2026