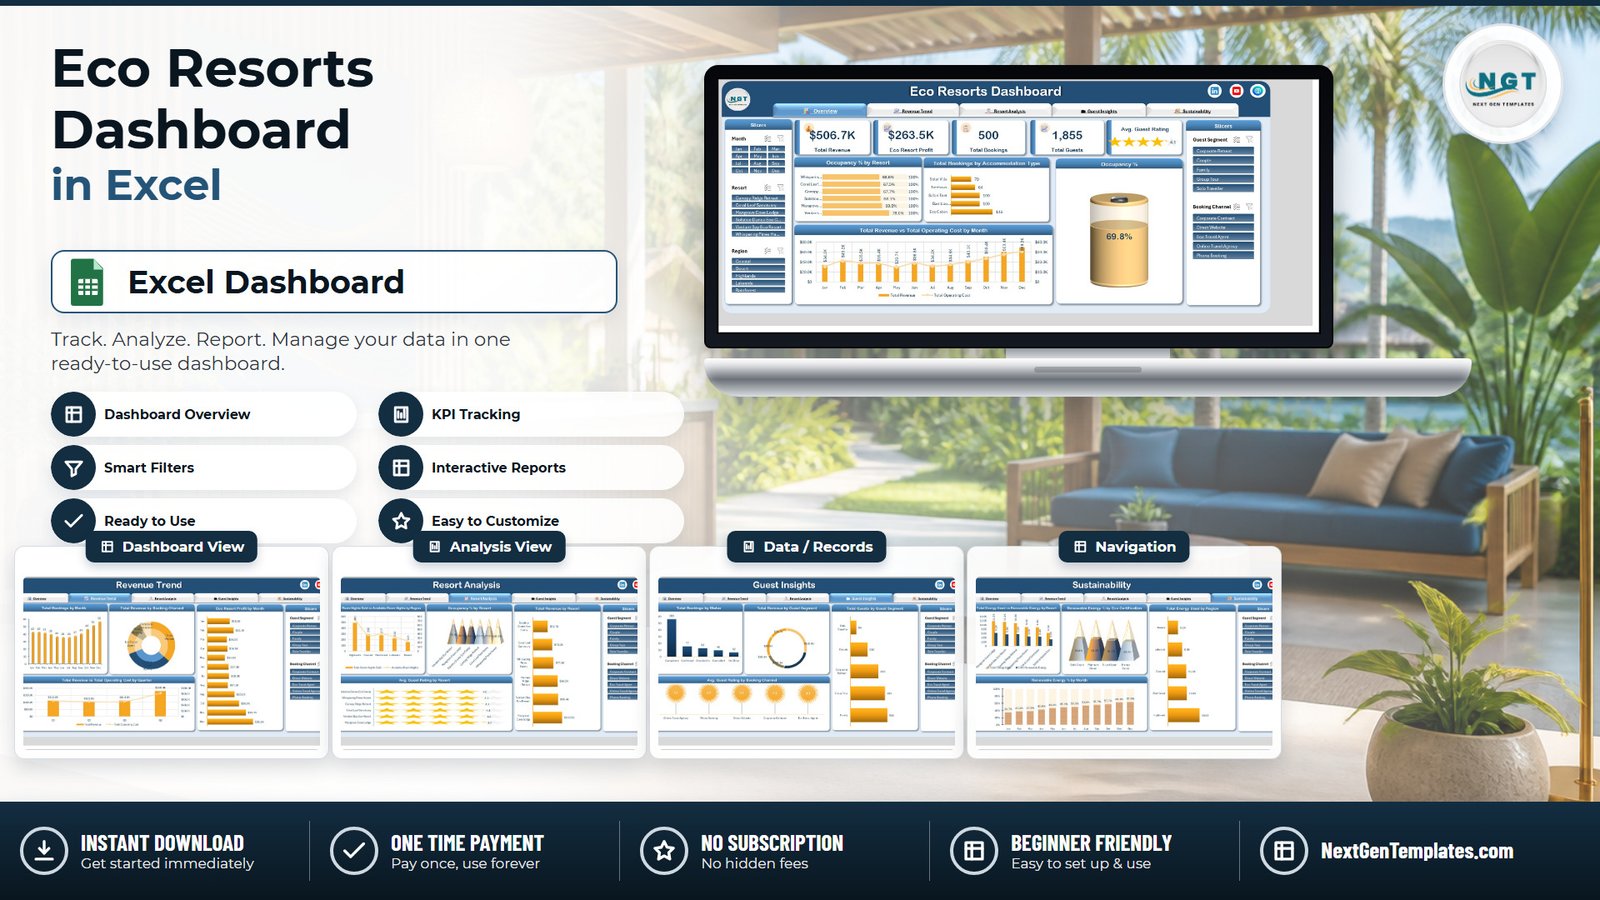
Most eco-resort operators can tell you how green they are. Far fewer can show it on the same screen as the money. In the sample book behind the Eco Resorts Dashboard in Excel, 500 bookings produced $506.7K of revenue and $263.5K of eco resort profit across six properties, 1,855 guests and a 4.1 average rating – and the renewable share of energy moved from 34.7% in January to 63.5% in December. Occupancy sat at 69.8%. Those five numbers usually live in five different files. This template puts them on one filtered page.
This is the analytical Excel dashboard line: five linked report pages, 20 charts and five synchronised slicers over a flat table you can replace with your own booking export. It is not a scorecard with targets and traffic lights, and it is not property management software. It is the monthly pack you currently rebuild by hand.
Key Features of the Eco Resorts Dashboard in Excel
- Five report pages – Overview, Revenue Trend, Resort Analysis, Guest Insights and Sustainability – with a fixed tab strip across the top of every sheet.
- Five KPI cards: Total Revenue, Eco Resort Profit, Total Bookings, Total Guests and Avg. Guest Rating on a five-star display.
- Five synchronised slicers: Month, Resort and Region on the left rail, Guest Segment and Booking Channel on the right.
- 20 charts, each named for the metric it shows, so a screenshot needs no caption.
- Six properties across five regions – Canopy Ridge Retreat, Coral Leaf Sanctuary, Mangrove Cove Lodge, Solstice Dunes Eco Camp, Verdant Bay Eco Resort and Whispering Pines Haven in Coastal, Desert, Highlands, Lakeside and Rainforest settings.
- Five accommodation types: Eco Cabin, Bamboo Bungalow, Safari Tent, Treehouse Suite and Solar Villa.
- A real sustainability page – energy consumed against renewable energy per resort, renewable share by certification tier and by month.
- 500 sample booking rows across 23 columns, including Nights Booked, Room Nights Available, Energy Consumed, Renewable Energy, Waste Generated and Waste Recycled.
- No VBA – a plain .xlsx for Excel 2016+, Microsoft 365 and Excel for Mac, with a PDF user manual in the ZIP.
Dashboard Pages Explanation
Page 1 – Overview
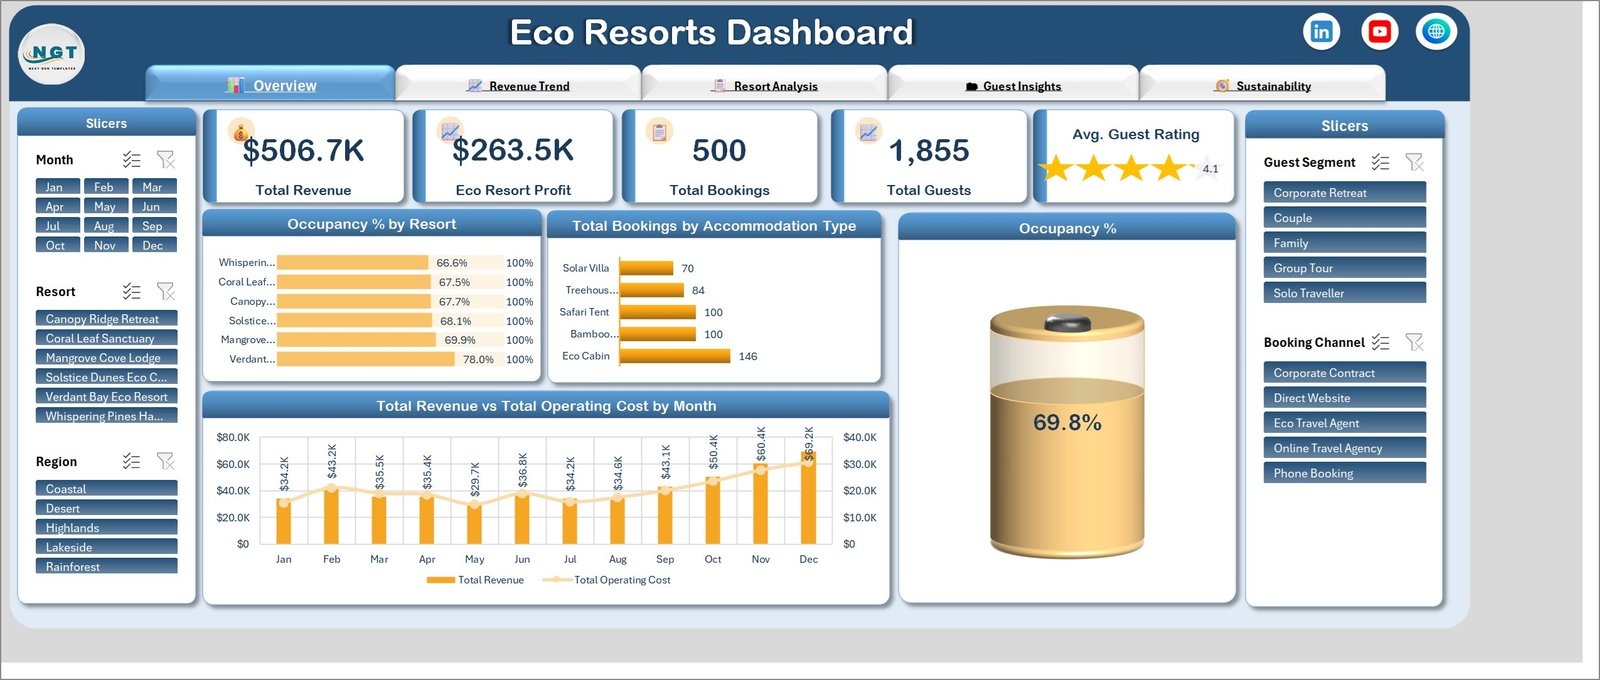
The five KPI cards – $506.7K revenue, $263.5K eco resort profit, 500 bookings, 1,855 guests and a 4.1 rating – sit above four charts. Occupancy % by Resort puts Verdant Bay Eco Resort at 78.0% and Whispering Pines Haven at 66.6%, each against a 100% reference bar. Total Bookings by Accommodation Type gives Eco Cabin 146 of the 500 bookings, with Bamboo Bungalow and Safari Tent at 100 each, Treehouse Suite at 84 and Solar Villa at 70. An Occupancy % gauge reads 69.8% for the group. Total Revenue vs Total Operating Cost by Month runs from $34.2K in January through a $29.7K trough in May to $69.2K in December, with the operating-cost line tracking underneath.
Page 2 – Revenue Trend
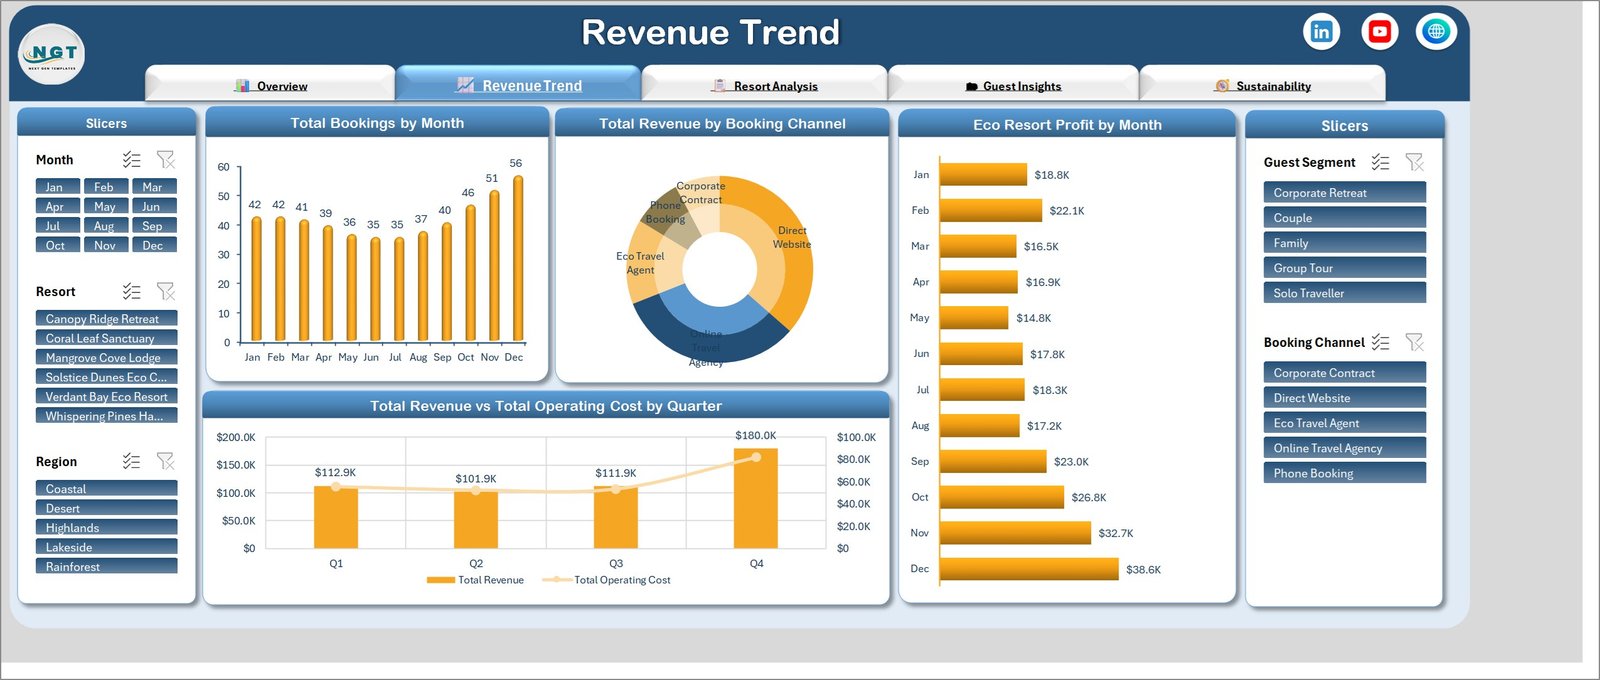
Total Bookings by Month is the seasonality chart: 42 in January and February, a 35-booking floor in June and July, then 46, 51 and 56 across the fourth quarter. Total Revenue by Booking Channel splits the book as a donut across Direct Website, Online Travel Agency, Eco Travel Agent, Phone Booking and Corporate Contract. Eco Resort Profit by Month ranges from $14.8K in May to $38.6K in December. Total Revenue vs Total Operating Cost by Quarter is the one that changes budget conversations: Q1 $112.9K, Q2 $101.9K, Q3 $111.9K and Q4 $180.0K – one quarter carrying the year.
Page 3 – Resort Analysis
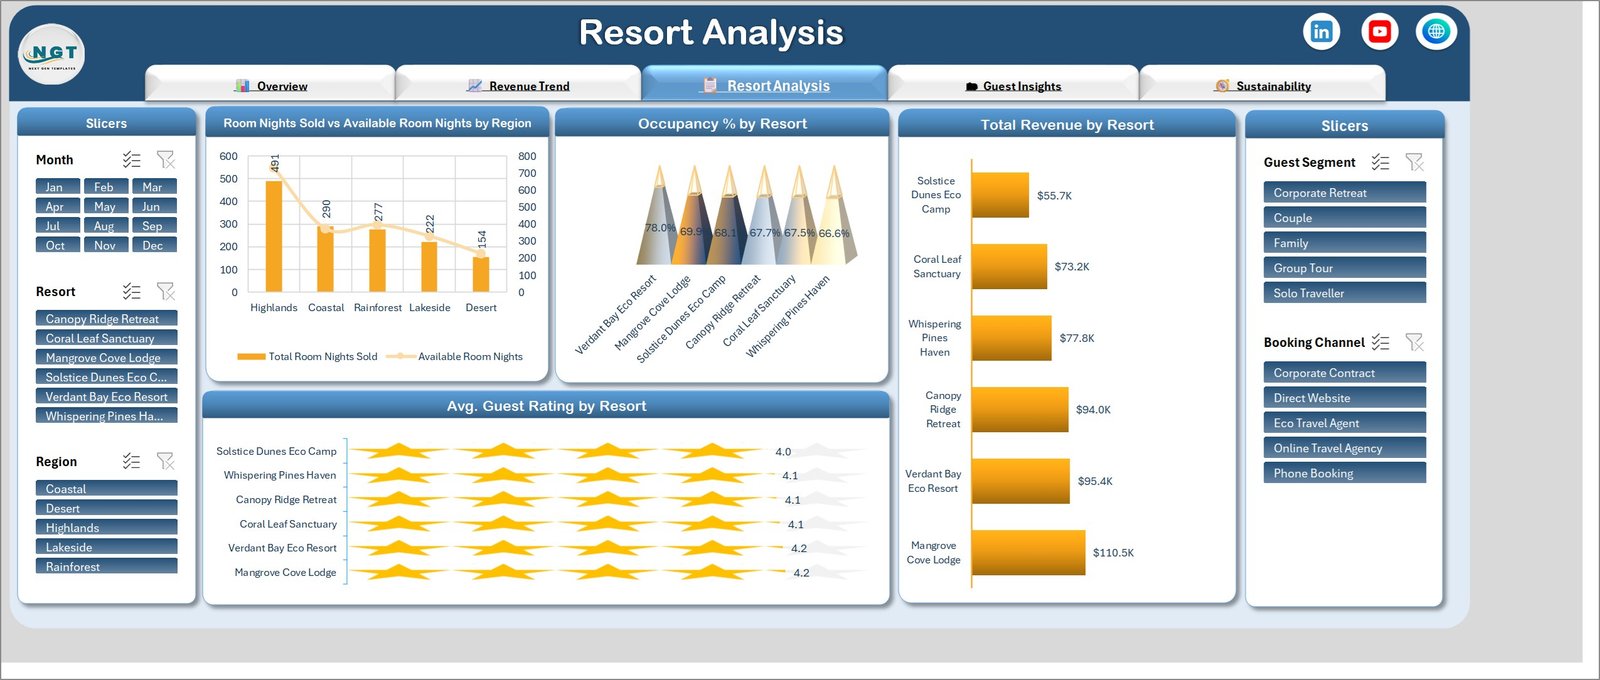
Room Nights Sold vs Available Room Nights by Region gives the Highlands 491 room nights sold – it is the only region carrying two properties – ahead of Coastal 290, Rainforest 277, Lakeside 222 and Desert 154. Occupancy % by Resort ranks all six from Verdant Bay Eco Resort at 78.0% down to Whispering Pines Haven at 66.6%. Total Revenue by Resort is the page’s real payload: Mangrove Cove Lodge $110.5K, Verdant Bay Eco Resort $95.4K, Canopy Ridge Retreat $94.0K, Whispering Pines Haven $77.8K, Coral Leaf Sanctuary $73.2K and Solstice Dunes Eco Camp $55.7K – twice the revenue from top to bottom of the same estate. Avg. Guest Rating by Resort then flattens that story: 4.2 at the top, 4.0 at the bottom. Revenue varies; satisfaction barely does.
Page 4 – Guest Insights
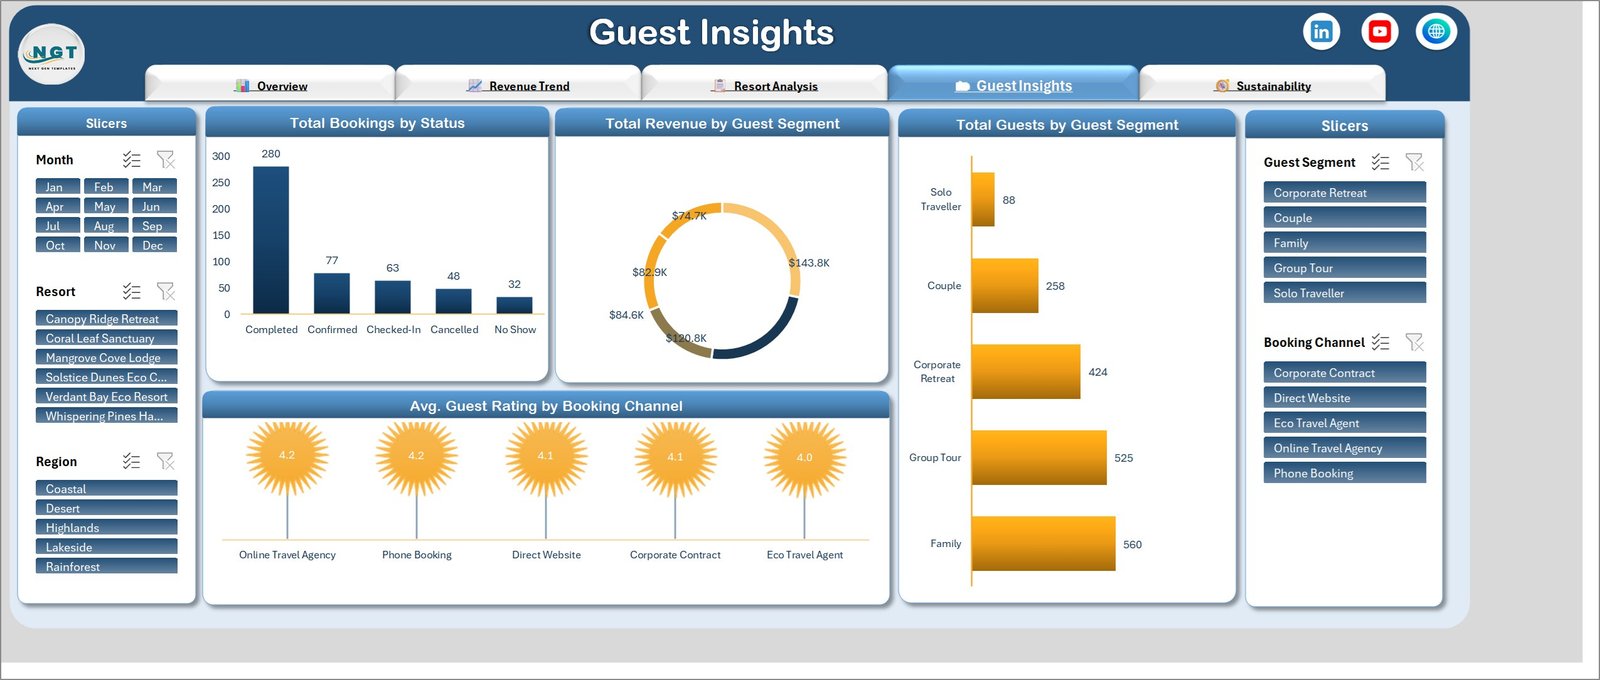
Total Bookings by Status accounts for every one of the 500 rows: 280 completed, 77 confirmed, 63 checked-in, 48 cancelled and 32 no-shows. Total Revenue by Guest Segment spreads from $143.8K at the top of the donut to $74.7K at the bottom. Total Guests by Guest Segment reorders the same segments by headcount – Family 560, Group Tour 525, Corporate Retreat 424, Couple 258, Solo Traveller 88 – which is the gap that matters, because the segment bringing the most people is not automatically the segment bringing the most money. Avg. Guest Rating by Booking Channel holds Online Travel Agency and Phone Booking at 4.2, Direct Website and Corporate Contract at 4.1, and Eco Travel Agent at 4.0.
Page 5 – Sustainability
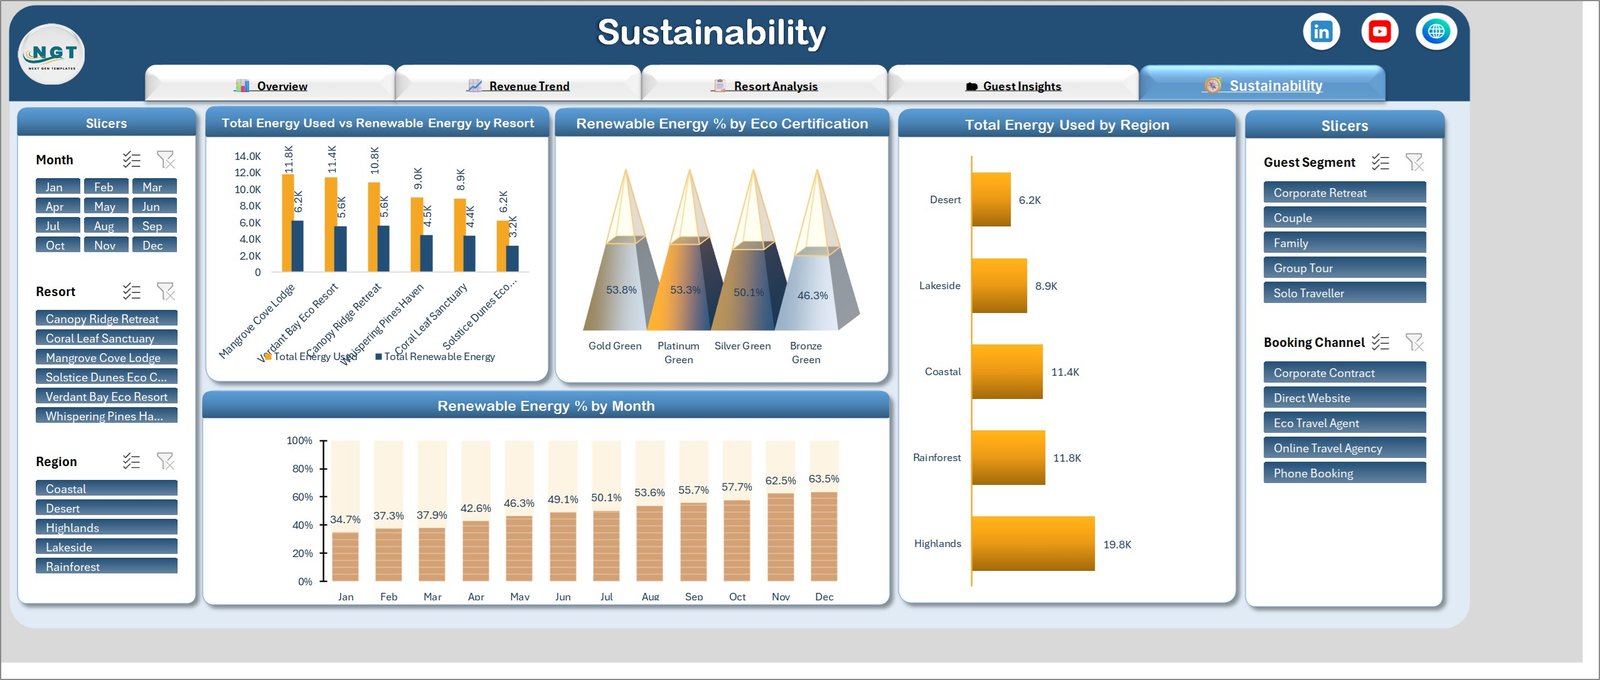
Total Energy Used vs Renewable Energy by Resort pairs consumption with renewable generation site by site: Mangrove Cove Lodge 11.8K against 6.2K, Verdant Bay Eco Resort 11.4K against 5.6K, Canopy Ridge Retreat 10.8K against 5.6K, down to Solstice Dunes Eco Camp at 6.2K against 3.2K. Renewable Energy % by Eco Certification compares the four tiers – Gold Green 53.8%, Platinum Green 53.3%, Silver Green 50.1% and Bronze Green 46.3% – and quietly asks whether the badge is doing any work. Total Energy Used by Region concentrates 19.8K units in the Highlands against 6.2K in the Desert. Renewable Energy % by Month traces the year from 34.7% in January to 63.5% in December, which is the single chart most certification bodies want to see.
Eco Resorts Dashboard in Excel vs. Google Sheets vs. Paid Hospitality BI – Feature Comparison
| What matters | This Excel dashboard | Google Sheets equivalent | Paid hospitality BI |
|---|---|---|---|
| Cost | $17.99 once | $9.99 once | $3,000-$25,000 per year |
| Platform | Excel 2016+, Microsoft 365, Mac | Browser, any device | Vendor cloud only |
| Setup time | Under 15 minutes | Under 15 minutes | 3-10 weeks |
| Live PMS or channel-manager feed | No – you paste your export | No – you paste your export | Yes, automatic |
| Rate shopping and competitor pricing | No | No | Yes |
| Energy, renewable and waste reporting | Built in on its own page | Built in | Usually a separate ESG module |
| Occupancy from room nights sold vs available | Built in | Built in | Built in |
| Offline use | Yes | Limited | No |
| Year-1 cost at 5 users | $17.99 | $9.99 | $6,000+ |
| Data leaves your organisation | No | Stays in your Google account | Yes, vendor-hosted |
Who Should Use This Template
It suits eco-resort and eco-lodge groups running two to ten properties, sustainable tourism operators who must publish a renewable-energy or recycling figure next to their revenue, independent nature retreats whose monthly review means exporting a booking list and rebuilding the same pivot table, and green-certification holders who need evidence per property rather than a group average. Revenue managers get occupancy, nightly rates and guest ratings on one filtered screen.
It is the wrong tool if you need live rate shopping, channel-manager syncing or a booking engine – that is property management software. It is also wrong past roughly 100,000 booking rows, or where you need per-property row-level permissions. If you want a one-page monthly scorecard with red, amber and green thresholds instead of five exploration pages, read about the Eco Resorts KPI Dashboard in Excel instead.
Real-World Use Cases
A six-property eco collection preparing a board pack. The operations manager filters Region to Highlands, shows 491 of the group’s room nights sold coming from two properties, and argues for a seventh lodge with the occupancy chart rather than a paragraph of prose.
A rainforest lodge group renewing its certification. The auditor wants a renewable share per site, not a group figure. Total Energy Used vs Renewable Energy by Resort supplies 6.2K of 11.8K at Mangrove Cove Lodge, and Renewable Energy % by Eco Certification is what justifies moving two sites off the Bronze Green tier at 46.3%.
A commercial director renegotiating agent commission. Mangrove Cove Lodge brings $110.5K against Solstice Dunes Eco Camp’s $55.7K while ratings barely differ, and Eco Travel Agent bookings carry the lowest average rating at 4.0. Filtering Booking Channel before the call turns a hunch into a position.
A marketing lead planning the shoulder season. Bookings bottom out at 35 in June and July while December reaches 56. Family and Group Tour bring 1,085 of the 1,855 guests between them, which is where the off-season campaign budget goes.
Advantages of the Eco Resorts Dashboard in Excel
- Money and sustainability in one file. Revenue, profit, occupancy, energy and renewable share come off the same 500-row table, so the ESG page can never disagree with the finance page.
- Occupancy you can audit. Room nights sold against room nights available, per resort and per region – not a single headline percentage nobody can reproduce.
- Five slicers, one click. Filtering Resort or Guest Segment redraws all 20 charts at once, so a property review takes one click rather than five rebuilt pivots.
- Nothing hard-coded. Add a seventh property or a sixth room type on the Data sheet, refresh, and the slicers pick it up.
- No macros, no subscription. A plain .xlsx that opens on Windows and Mac, bought once, with a PDF manual in the ZIP.
Frequently Asked Questions
Which Excel versions does the Eco Resorts Dashboard in Excel work in?
Excel 2016, 2019, 2021, 2024 and Microsoft 365 on Windows, and Excel for Mac. It is a standard .xlsx built on pivot tables and slicers – there are no macros to enable and no add-ins to install.
How is this different from the Eco Resorts KPI Dashboard?
This is the analytical line: five exploration pages, 20 charts and free-form slicing across 500 booking records. The KPI dashboard is a month-picker scorecard with targets and traffic lights. They answer different questions and many operators keep both.
Can I add my own resorts, regions or accommodation types?
Yes. Type your own values into the Data sheet and refresh – the slicers and charts rebuild around whatever list they find. Nothing is tied to the six sample properties or the five sample room types.
Does it connect to my property management system?
No. It reads a flat table you paste in, which is what almost every PMS, channel manager and booking engine can export. There is no live link to a PMS, an OTA or a rate-shopping service.
Where do the sustainability figures come from?
Four columns on the Data sheet – Energy Consumed, Renewable Energy, Waste Generated and Waste Recycled – filled from your own meters and waste contractor reports. The workbook aggregates and calculates percentages; it does not estimate or model anything.
How many booking records can it hold?
It ships with 500 rows and stays responsive into the tens of thousands. Past roughly 100,000 rows, refresh times become noticeable on an average laptop.
Is the sample data real?
No. Resort names, guest counts, energy readings and financial figures are realistic sample data used to demonstrate the charts. Replace them before sharing anything externally.
What exactly is in the download?
A ZIP containing the .xlsx workbook and a PDF user manual. Nothing else to install.
Get the Eco Resorts Dashboard in Excel
The template is a one-time purchase with instant download and lifetime access – no subscription and no per-property fee. Get the Eco Resorts Dashboard in Excel on NextGenTemplates.
If you run a different kind of property, these cover the same ground for other estates:
- Eco Lodges Dashboard in Excel – the same five-page build for smaller lodge estates.
- Camping Resorts Dashboard in Excel – pitches, seasons and site utilisation instead of rooms.
- Outdoor Adventure Parks Dashboard in Excel – for operators whose revenue is activities rather than nights.
- Hotel Revenue RevPAR Dashboard in Excel – rate and RevPAR reporting for conventional hotels.
- Hotel and Hospitality Revenue Dashboard in Excel – the broader hospitality revenue view.
- Marina Dashboard in Excel – berths, occupancy and seasonality for waterfront operators.