Managing electricity tenders demands accuracy, transparency, and continuous monitoring. Because electricity projects involve high capital investment, strict regulatory frameworks, long timelines, and multiple stakeholders, even a small deviation can lead to major financial and operational risks. Therefore, organizations need a structured and reliable way to track performance.
That is exactly why the Electricity Tender KPI Dashboard in Power BI becomes an essential analytical solution.
In this detailed and SEO-friendly article, you will learn everything about the Electricity Tender KPI Dashboard in Power BI. You will understand what it is, how it works, its structure, key features, advantages, best practices, and frequently asked questions. By the end, you will clearly see how this dashboard helps electricity boards, utility companies, EPC contractors, and government authorities gain control over tender performance.
Click to buy Electricity Tender KPI Dashboard in Power BI
What Is an Electricity Tender KPI Dashboard in Power BI?
An Electricity Tender KPI Dashboard in Power BI is a ready-to-use analytical dashboard designed to track, monitor, and analyze key performance indicators related to electricity tenders.
Instead of managing multiple Excel files and manual reports, this dashboard consolidates all tender KPIs into a single interactive Power BI report. As a result, decision-makers can instantly evaluate whether tenders meet targets or miss expectations.
Moreover, because the dashboard uses Power BI, users benefit from dynamic visuals, slicers, drill-through features, and automated calculations. At the same time, the data source remains simple, as the dashboard captures all inputs from an Excel file.
Why Is Electricity Tender KPI Tracking Important?
Electricity tenders play a critical role in power generation, transmission, and distribution projects. Therefore, performance tracking becomes non-negotiable.
Here is why KPI tracking matters so much:
- Electricity tenders involve high-value contracts
- Delays directly impact power availability and revenue
- Cost overruns affect government budgets and tariffs
- Regulatory compliance requires accurate reporting
- Stakeholders demand transparency and accountability
Because of these reasons, organizations must rely on a KPI-driven dashboard rather than manual tracking methods.
How Does the Electricity Tender KPI Dashboard in Power BI Work?
The Electricity Tender KPI Dashboard in Power BI works on a simple yet powerful concept.
First, users enter actual and target KPI data in structured Excel worksheets. Then, Power BI reads this data and converts it into meaningful insights using predefined calculations and visuals.
As a result, users can:
- Compare Actual vs Target performance
- Analyze Month-to-Date (MTD) and Year-to-Date (YTD) trends
- Measure Current Year vs Previous Year performance
- Identify target-met and target-missed KPIs instantly
Because everything updates automatically, reporting becomes fast, accurate, and reliable.
Data Source Structure: Excel-Driven Simplicity
The dashboard uses an Excel file as its data source. This design ensures flexibility and ease of maintenance.
Input_Actual Sheet
In this sheet, users enter:
- KPI Name
- Month (first date of the month)
- Actual MTD values
- Actual YTD values
Because the structure stays simple, data entry remains quick and error-free.
Input_Target Sheet
In this sheet, users enter:
- KPI Name
- Month (first date of the month)
- Target MTD values
- Target YTD values
As a result, Power BI can compare actual performance against targets accurately.
KPI Definition Sheet
This sheet provides context and clarity. Here, users define:
- KPI Number
- KPI Group
- KPI Name
- Unit of Measurement
- Formula
- Definition
- KPI Type (LTB or UTB)
Because of this structure, every KPI remains well-documented and easy to understand.
Dashboard Pages Explained in Detail
The Electricity Tender KPI Dashboard in Power BI contains three structured pages, each serving a specific analytical purpose.
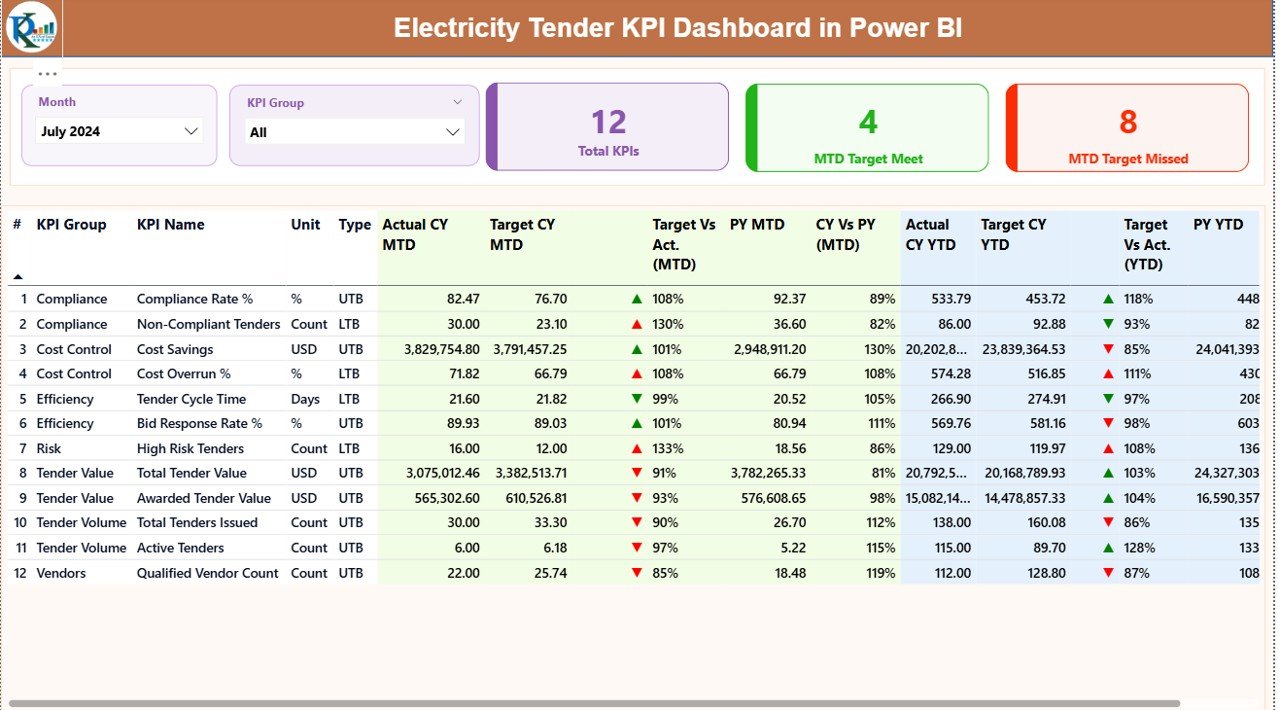
Summary Page: Where Decisions Begin
The Summary Page acts as the central control panel of the dashboard.
Key Elements on the Summary Page
- Month Slicer at the top
- KPI Group Slicer at the top
Three KPI Cards, showing:
Total KPI Count
MTD Target Met Count
MTD Target Missed Count
Because of these elements, users get a quick performance snapshot immediately.
Detailed KPI Table Explained
Below the KPI cards, the dashboard displays a detailed KPI table with the following columns:
- KPI Number – Sequence number of the KPI
- KPI Group – Category of the KPI
- KPI Name – Name of the KPI
- Unit – Measurement unit
- Type – LTB (Lower the Better) or UTB (Upper the Better)
Performance Metrics (MTD Analysis)
- Actual CY MTD – Current Year actual MTD value
- Target CY MTD – Current Year target MTD value
- MTD Icon – ▲ or ▼ icon with green/red color
- Target vs Actual (MTD) – Actual ÷ Target
- PY MTD – Previous Year MTD value
- CY vs PY (MTD) – CY MTD ÷ PY MTD
Because of this structure, users instantly understand monthly performance.
Performance Metrics (YTD Analysis)
- Actual CY YTD – Current Year actual YTD value
- Target CY YTD – Current Year target YTD value
- YTD Icon – ▲ or ▼ icon with green/red color
- Target vs Actual (YTD) – Actual ÷ Target
- PY YTD – Previous Year YTD value
- CY vs PY (YTD) – CY YTD ÷ PY YTD
Therefore, long-term performance becomes equally visible.
Click to buy Electricity Tender KPI Dashboard in Power BI
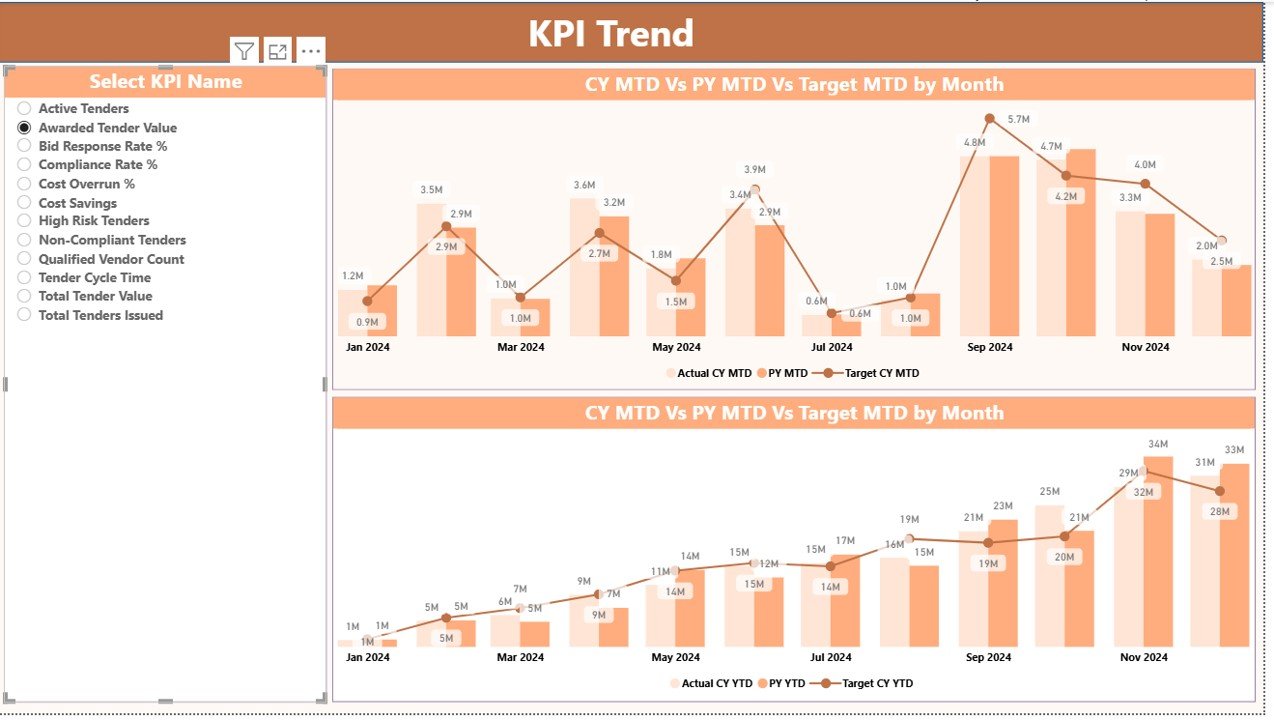
KPI Trend Page: Tracking Performance Over Time
The KPI Trend Page focuses on performance trends rather than static values.
What Does This Page Show?
Two Combo Charts:
MTD Trend: Actual CY, PY, and Target
YTD Trend: Actual CY, PY, and Target
KPI Name Slicer on the left
Because users can select any KPI, trend analysis becomes highly interactive.
Why Trend Analysis Matters
Trend analysis helps users:
- Identify consistent underperformance
- Detect early warning signs
- Validate improvement strategies
- Compare historical and current performance
As a result, teams can act before issues escalate.
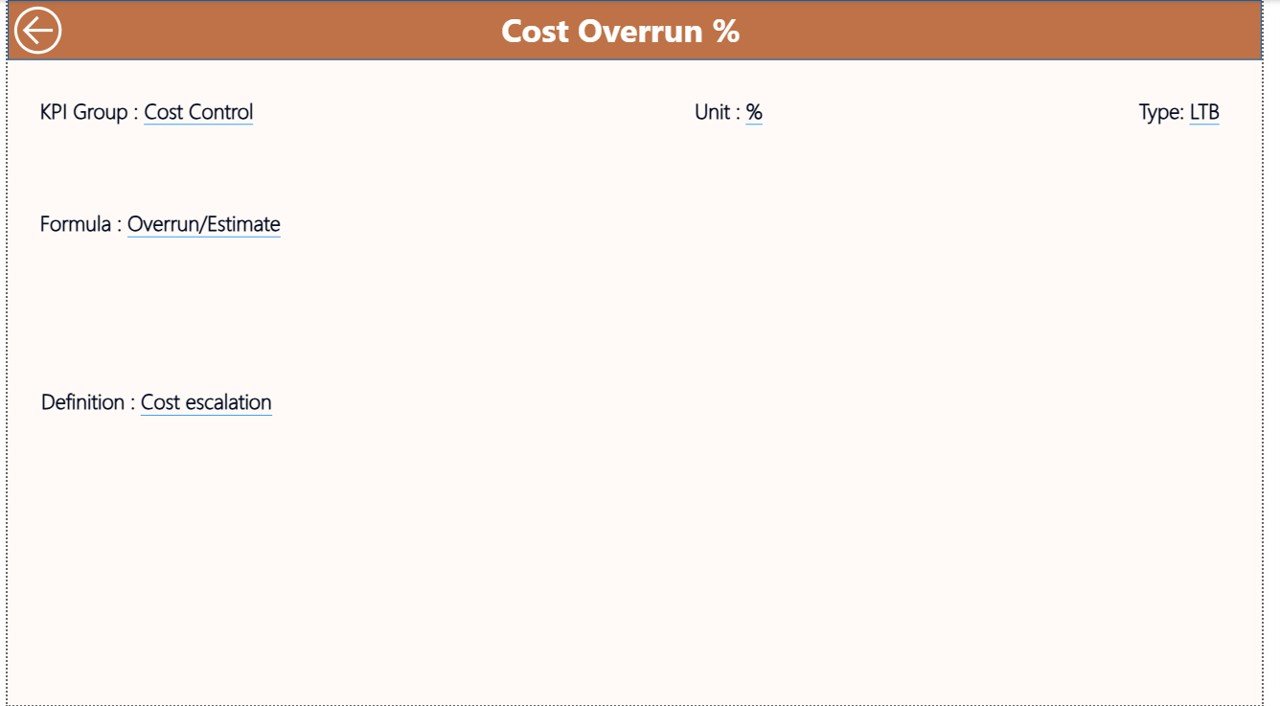
KPI Definition Page: Deep Dive into KPI Details
The KPI Definition Page works as a hidden drill-through page.
From the Summary Page, users can drill through to view:
- KPI Formula
- KPI Definition
- KPI Type (LTB or UTB)
To return to the main page, users simply click the Back button located at the top-left corner.
Because of this design, the dashboard stays clean while still providing deep insights.
Click to buy Electricity Tender KPI Dashboard in Power BI
Advantages of Electricity Tender KPI Dashboard in Power BI
Centralized KPI Monitoring
The dashboard consolidates all electricity tender KPIs into one interactive report. As a result, teams avoid fragmented data sources.
Real-Time Performance Visibility
Because Power BI refreshes data dynamically, users always see the latest performance numbers.
Clear Target Accountability
Target vs Actual comparisons ensure accountability at every stage of the tender lifecycle.
Improved Decision-Making
With MTD, YTD, and PY comparisons available instantly, decision-makers act faster and with confidence.
User-Friendly Excel Integration
Since the data source uses Excel, even non-technical users can manage inputs easily.
Scalability and Flexibility
Organizations can add new KPIs, months, or categories without redesigning the dashboard.
Who Should Use This Dashboard?
The Electricity Tender KPI Dashboard in Power BI suits multiple stakeholders, including:
- Electricity Boards
- Power Generation Companies
- Transmission and Distribution Utilities
- EPC Contractors
- Government Tender Authorities
- Energy Project Managers
- Financial Controllers
Because the dashboard adapts easily, it supports both public and private sector needs.
Best Practices for the Electricity Tender KPI Dashboard in Power BI
Maintain Clean Excel Data
Always validate Excel inputs before refreshing the dashboard. Clean data ensures accurate insights.
Define KPIs Clearly
Use the KPI Definition sheet properly. Clear definitions avoid confusion and misinterpretation.
Review KPIs Monthly
Regular monthly reviews help detect issues early and improve corrective actions.
Focus on Exceptions
Use icons and variance percentages to focus on missed targets first.
Use Drill-Through Wisely
Encourage users to drill into KPI definitions whenever clarity is needed.
Align KPIs with Tender Objectives
Ensure every KPI supports strategic electricity tender goals.
Common Challenges Without a KPI Dashboard
Without a structured KPI dashboard, organizations often face:
- Delayed reporting
- Manual calculation errors
- Poor visibility into trends
- Missed performance gaps
- Reactive decision-making
Fortunately, the Electricity Tender KPI Dashboard in Power BI eliminates these challenges effectively.
How Does This Dashboard Improve Tender Governance?
Because governance relies on transparency and accountability, this dashboard plays a vital role.
It ensures:
- Clear performance ownership
- Consistent KPI measurement
- Audit-ready reporting
- Better compliance tracking
Therefore, governance improves naturally.
Conclusion: Why You Need an Electricity Tender KPI Dashboard in Power BI
The Electricity Tender KPI Dashboard in Power BI transforms how organizations track and manage electricity tender performance.
Instead of manual reports and delayed insights, teams gain real-time visibility, accurate comparisons, and actionable trends. Moreover, the Excel-driven data structure keeps the solution flexible and easy to maintain.
If your organization handles electricity tenders and values performance, transparency, and accountability, this dashboard becomes an indispensable tool.
Frequently Asked Questions (FAQs)
- 1) What is the main purpose of an Electricity Tender KPI Dashboard in Power BI?
- The dashboard helps track, analyze, and monitor electricity tender KPIs using MTD, YTD, and historical comparisons.
- 2) Do I need advanced Power BI skills to use this dashboard?
- No. Users only need basic Excel skills for data entry. Power BI handles all calculations and visuals.
- 3) Can I add more KPIs to the dashboard?
- Yes. You can easily add new KPIs by updating the Excel input sheets.
- 4) What does LTB and UTB mean in KPIs?
- LTB means Lower the Better, while UTB means Upper the Better. These types define performance direction.
- 5) How often should I update the data?
- You should update the data monthly to ensure accurate MTD and YTD analysis.
- 6) Can this dashboard support government electricity tenders?
- Yes. The dashboard suits both government and private electricity tender projects.
- 7) Does the dashboard support previous year comparison?
- Yes. It includes both MTD and YTD comparisons against previous year performance.
- 8) Is the KPI Definition page mandatory?
- Yes. It ensures clarity, consistency, and proper KPI understanding across teams.
Watch the step-by-step video tutorial:
Visit our YouTube channel to learn step-by-step video tutorials
Click to buy Electricity Tender KPI Dashboard in Power BI