In today’s data-driven world, energy efficiency is no longer optional — it’s essential. Whether you manage an industrial facility, a commercial complex, or an organization striving to reduce energy costs, understanding your energy data is the key to better decisions. That’s where an Energy Report in Excel becomes your most powerful tool.
This ready-to-use Excel template allows you to collect, analyze, and visualize energy consumption data easily. With automated calculations, interactive charts, and data-driven summaries, you can measure efficiency, identify patterns, and manage your energy targets all in one place.
In this comprehensive guide, we’ll explore what an Energy Report in Excel is, how it works, its key components, advantages, and best practices for using it effectively.
Click to Purchases Energy Report in Excel
What Is an Energy Report in Excel?
An Energy Report in Excel is a structured and visualized document designed to track, evaluate, and present energy consumption data across various departments, projects, or locations. It helps energy managers, sustainability professionals, and operations teams monitor usage patterns, compare actual versus budgeted consumption, and identify opportunities for energy savings.
Unlike static reports, this Excel-based report template is interactive, customizable, and fully automated. You can easily filter the data by month, department, or project type and instantly visualize performance with charts and KPIs (Key Performance Indicators).
Why Use Excel for Energy Reporting?
Microsoft Excel remains one of the most accessible, flexible, and powerful tools for data management. For energy tracking and reporting, Excel offers a range of advantages, including:
📊 Visual Analysis – Create dynamic charts and graphs to display energy trends.
🔁 Automation – Use formulas and pivot tables to automatically calculate totals, percentages, and trends.
🔍 Transparency – Keep all calculations and data visible, traceable, and auditable.
⚙️ Customization – Modify the report structure to suit your specific business needs.
🕒 Efficiency – Save time with ready-to-use templates that consolidate energy data automatically.
When used correctly, an Excel energy report provides not only insights but also accountability. It helps you understand how, where, and when your organization consumes energy.
Structure of the Energy Report in Excel
The Energy Report in Excel consists of three main pages and one support sheet, each playing a specific role in making energy management simple, visual, and actionable.
Let’s explore each of them in detail:
1. Summary Page
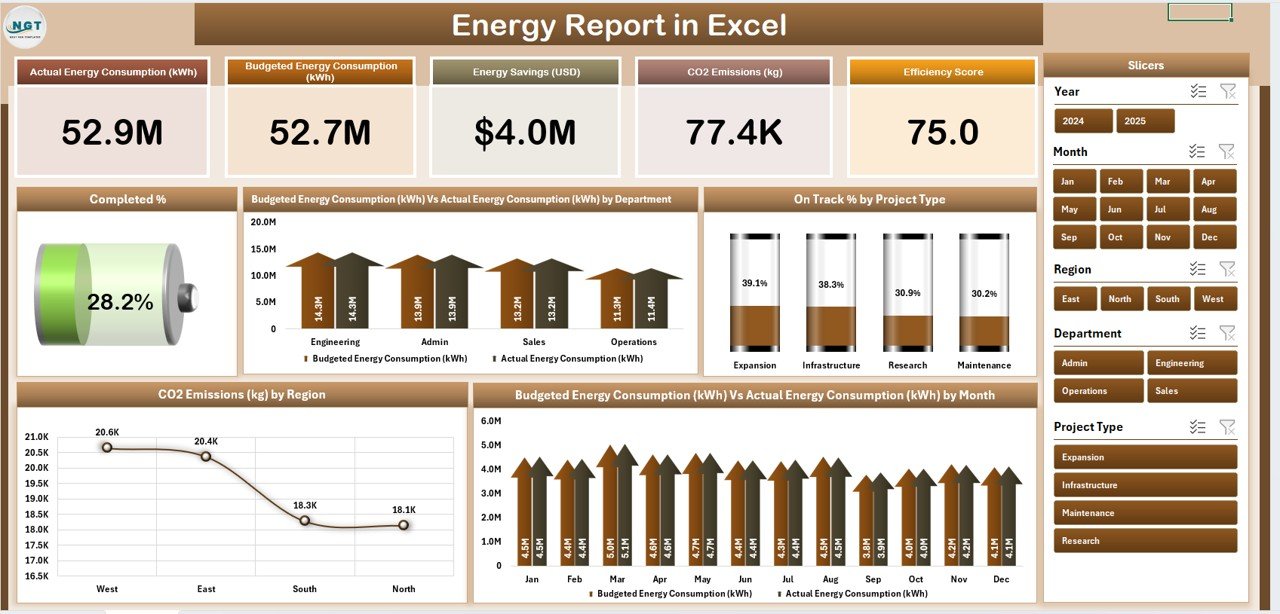
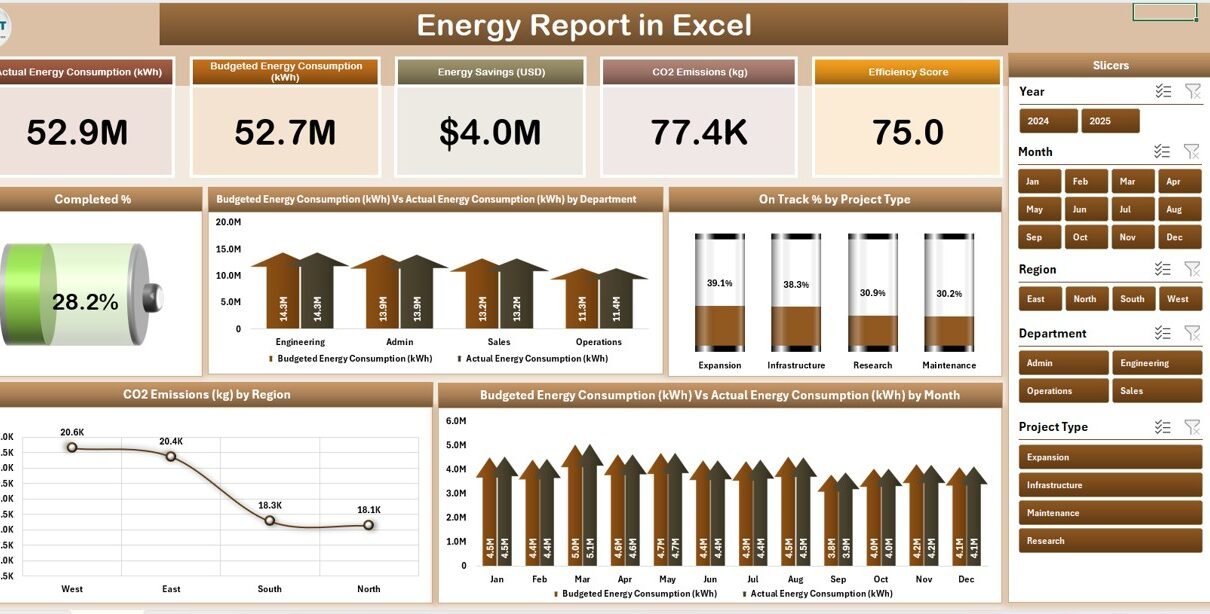
The Summary Page acts as the dashboard of the report. It gives a high-level overview of your energy performance through cards, slicers, and charts.
Key Components Include:
-
Five KPI Cards: These display critical metrics such as Total Energy Consumption, Budget Energy Consumption, Actual Energy Consumption, CO2 Emissions, and Completion Percentage.
-
Right-Side Slicers: Users can filter data by department, region, or project type, making the dashboard interactive.
Five Analytical Charts:
✅ Completed % by Department
⚡ Budget Energy Consumption (kWh) vs. Actual Energy Consumption (kWh) by Department
🔄 On-Track % by Project Type
🌍 CO2 Emissions (kg) by Region
📆 Budget vs. Actual Energy Consumption by Month
This page provides a bird’s-eye view of the organization’s energy performance — helping managers quickly spot inefficiencies and make informed adjustments.
Click to Purchases Energy Report in Excel
2. Report Page
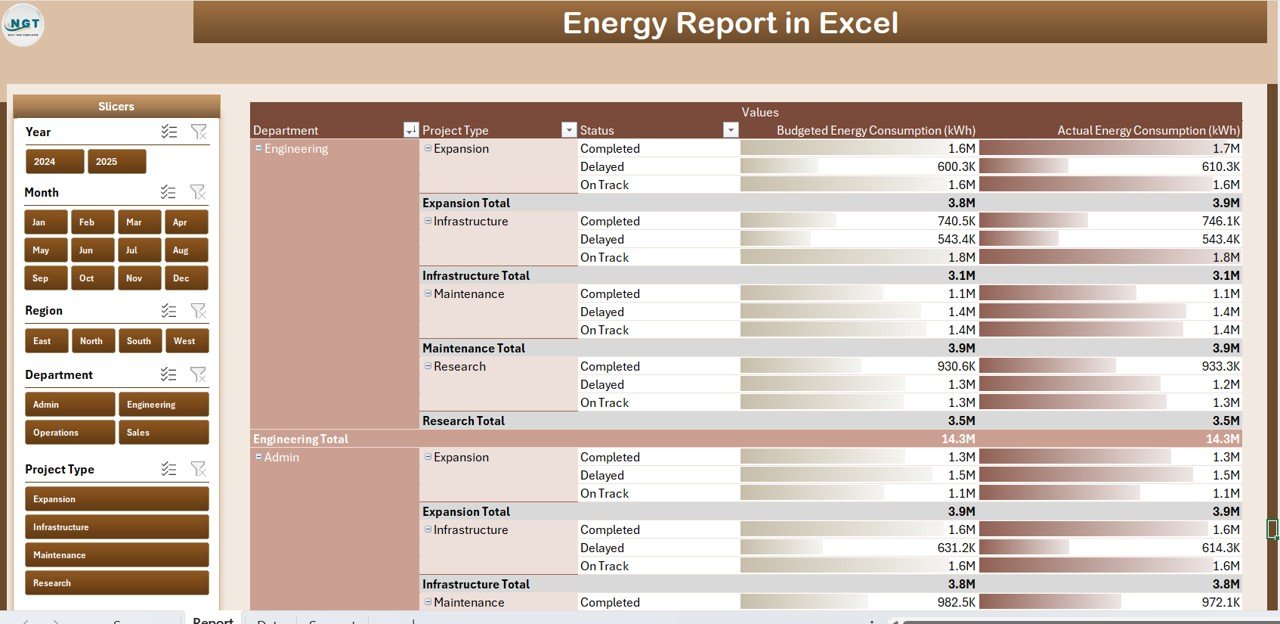
The Report Page is where users can deep dive into the data. It’s ideal for detailed analysis, auditing, and record keeping.
Features Include:
-
Left-Side Slicer Panel: Allows users to select filters such as department, project type, or month.
Detailed Information Table: Displays KPIs and related metrics for each segment.
For example:
- Department Name
- Budget Energy (kWh)
- Actual Energy (kWh)
- Variance %
- On-Track/Off-Track Status
With these details, you can easily compare performance and identify areas needing attention.
3. Data Sheet

The Data Sheet is the backbone of the entire report. It stores all raw data related to energy consumption, project details, departments, and months.
Common Columns Include:
-
Project ID
-
Project Name
-
Department
-
Region
-
Energy Source (Electricity, Gas, Water, etc.)
-
Budgeted Energy (kWh)
-
Actual Energy (kWh)
-
CO2 Emissions (kg)
-
Month
-
Year
This sheet powers all calculations and visuals in the report. It’s recommended to keep this sheet clean and formatted properly for accurate results.
4. Support Sheet

The Support Sheet contains predefined lists, formulas, and supporting data such as departments, regions, and units.
It ensures data consistency and smooth operation of dropdown menus, slicers, and charts.
Click to Purchases Energy Report in Excel
How to Use the Energy Report in Excel
Using the Energy Report in Excel is simple and intuitive. Follow these steps to get started:
-
Enter Data in the Data Sheet – Record energy consumption details for each department, project, and month.
-
Set Targets in Budget Columns – Define monthly or yearly targets for each segment.
-
View Insights on the Summary Page – Use slicers to filter data by region, department, or project type.
-
Analyze Trends – Review charts to identify underperforming areas or positive trends.
-
Take Action – Implement energy-saving initiatives based on insights drawn from the report.
The Excel file automatically updates visuals when you modify or add data, ensuring real-time accuracy.
Key Metrics Tracked in the Energy Report
The success of energy reporting depends on tracking the right metrics. Here are some important KPIs captured in this report:
-
Budget Energy Consumption (kWh): Planned energy use per department or project.
-
Actual Energy Consumption (kWh): Real energy used during the period.
-
Variance %: Difference between budgeted and actual energy consumption.
-
CO2 Emissions (kg): Environmental impact indicator.
-
On-Track %: Percentage of projects performing within energy targets.
-
Completion %: Percentage of energy initiatives or projects completed successfully.
These KPIs provide both operational and environmental perspectives, allowing teams to measure performance comprehensively.
Advantages of the Energy Report in Excel
Implementing an Energy Report in Excel offers numerous benefits across organizational levels.
1. 💰 Cost Reduction
By comparing actual consumption against budgets, organizations can identify wastage and cut unnecessary energy expenses.
2. 📈 Performance Transparency
Stakeholders can clearly see how each department or region contributes to energy efficiency goals.
3. 🌍 Environmental Sustainability
Tracking CO2 emissions helps align operations with sustainability targets and corporate responsibility goals.
4. 🧩 Better Decision-Making
With visual insights and KPIs, management can make quick, informed decisions about energy policies and projects.
5. 🕒 Time Efficiency
The automated calculations and pre-designed visuals save countless hours spent on manual reporting.
6. 🧠 Easy Customization
Since the report is built in Excel, users can modify charts, formulas, and layouts without specialized tools.
How This Template Enhances Energy Management
The Energy Report in Excel is not just a reporting tool—it’s a strategic solution.
It bridges the gap between energy data collection and decision-making. With instant access to data-driven visuals, businesses can:
-
Detect inefficiencies early.
-
Monitor trends over time.
-
Optimize energy utilization per department.
-
Set realistic budgets for future periods.
When combined with regular updates and organizational collaboration, this report can transform how energy is monitored and managed.
Visualization and Dashboard Insights
Charts make complex data easy to understand. Here’s a quick overview of the visuals included in the template:
-
Budget vs. Actual Energy by Department – Compare consumption performance across business units.
-
CO2 Emissions by Region – Identify regions contributing most to carbon output.
-
Budget vs. Actual Energy by Month – Spot seasonal variations and plan accordingly.
-
On-Track % by Project Type – Evaluate which project types maintain efficiency.
-
Completed % Overview – Track progress toward energy goals.
Each chart uses color-coded visuals, making the data more engaging and actionable.
Customizing the Energy Report Template
Excel gives you full flexibility to adapt this report to your organization’s needs. Here are a few customization ideas:
-
Add new departments or project types in the Support Sheet.
-
Include additional KPIs such as Cost per kWh, Renewable Energy %, or Energy Savings vs. Previous Year.
-
Create a Year-over-Year Comparison chart using pivot tables.
-
Add conditional formatting to highlight energy overuse automatically.
Such customization allows organizations to evolve their reporting systems as they grow.
Best Practices for the Energy Report in Excel
To make the most out of your energy report, follow these best practices:
✅ 1. Keep Data Consistent
Ensure all energy figures are entered in consistent units (e.g., kWh). This avoids reporting errors.
✅ 2. Update Regularly
Enter data monthly or weekly to keep your visuals and KPIs accurate.
✅ 3. Use Clear Naming Conventions
Label departments, regions, and projects consistently across sheets.
✅ 4. Protect Key Formulas
Lock calculation cells to prevent accidental edits.
✅ 5. Validate Data Inputs
Use Excel’s data validation to control entries and prevent duplicates or incorrect data.
✅ 6. Compare Against Industry Benchmarks
Regularly assess your KPIs against industry averages to identify improvement opportunities.
✅ 7. Visualize Trends Over Time
Use charts to observe seasonal fluctuations and long-term improvements.
By following these best practices, you’ll ensure that your report remains reliable, actionable, and easy to interpret.
Conclusion
An Energy Report in Excel is more than a spreadsheet — it’s a complete energy management solution.
It enables organizations to track consumption, control costs, and support sustainability goals with precision. With its interactive dashboard, analytical visuals, and automated calculations, this Excel template simplifies the complex task of energy reporting.
Whether you are a facility manager, sustainability coordinator, or energy analyst, this tool empowers you to make smarter, data-driven decisions. Start using it today and take control of your energy efficiency journey.
❓ Frequently Asked Questions (FAQs)
1. What is the purpose of an Energy Report in Excel?
The main purpose is to track, analyze, and present energy consumption data across departments and projects. It helps identify inefficiencies and supports better decision-making.
2. Can I customize the Energy Report in Excel?
Yes, you can easily modify formulas, add new KPIs, and change visuals to match your organization’s needs.
3. How often should I update the Energy Report?
Ideally, update it monthly to ensure accuracy and keep the data relevant.
4. Is Excel suitable for large-scale energy reporting?
Yes. Excel can handle thousands of records efficiently when properly structured. However, for very large datasets, connecting it to Power BI can enhance visualization and performance.
5. What are the key metrics to track in an energy report?
Important metrics include Budget Energy (kWh), Actual Energy (kWh), CO2 Emissions, Variance %, and On-Track %.
6. How can this report help reduce costs?
By identifying high-consumption areas and comparing actual vs. budgeted energy use, you can make targeted improvements and reduce waste.
7. Can I integrate this Excel file with other tools?
Yes, you can link it with Power BI or Google Sheets to expand its analytical power and shareability.
Visit our YouTube channel to learn step-by-step video tutorials