In a world where sustainability is not just a trend but a responsibility, organizations need to track, monitor, and communicate their environmental and sustainability efforts more transparently than ever. Stakeholders—whether they are investors, regulators, customers, or internal teams—expect regular, data-driven updates on environmental performance.
To meet this growing demand, the Environmental and Sustainability Stakeholder Reporting KPI Dashboard in Excel offers a powerful, easy-to-use, and customizable solution that puts vital metrics at your fingertips.
This comprehensive Excel-based dashboard helps you monitor key performance indicators (KPIs), compare progress against targets, and visualize trends that matter to your stakeholders.
Click to Purchases Environmental and Sustainability Stakeholder Reporting KPI Dashboard in Excel
What Is an Environmental and Sustainability Stakeholder Reporting KPI Dashboard?
An Environmental and Sustainability Stakeholder Reporting KPI Dashboard is a structured reporting tool designed in Microsoft Excel to track, analyze, and report sustainability-related KPIs. These metrics often cover environmental impact, energy usage, water conservation, carbon footprint, waste reduction, and more.
This dashboard is tailored for stakeholder communication, helping organizations clearly present progress toward sustainability goals.
Key Features of the Dashboard
This Excel-based dashboard includes seven essential worksheet tabs, each serving a specific function:
Home Sheet – Your Navigation Hub

-
Acts as the index page for the entire tool.
-
Includes six clickable buttons that instantly take users to other sheets.
-
Designed for ease of use and smooth navigation.
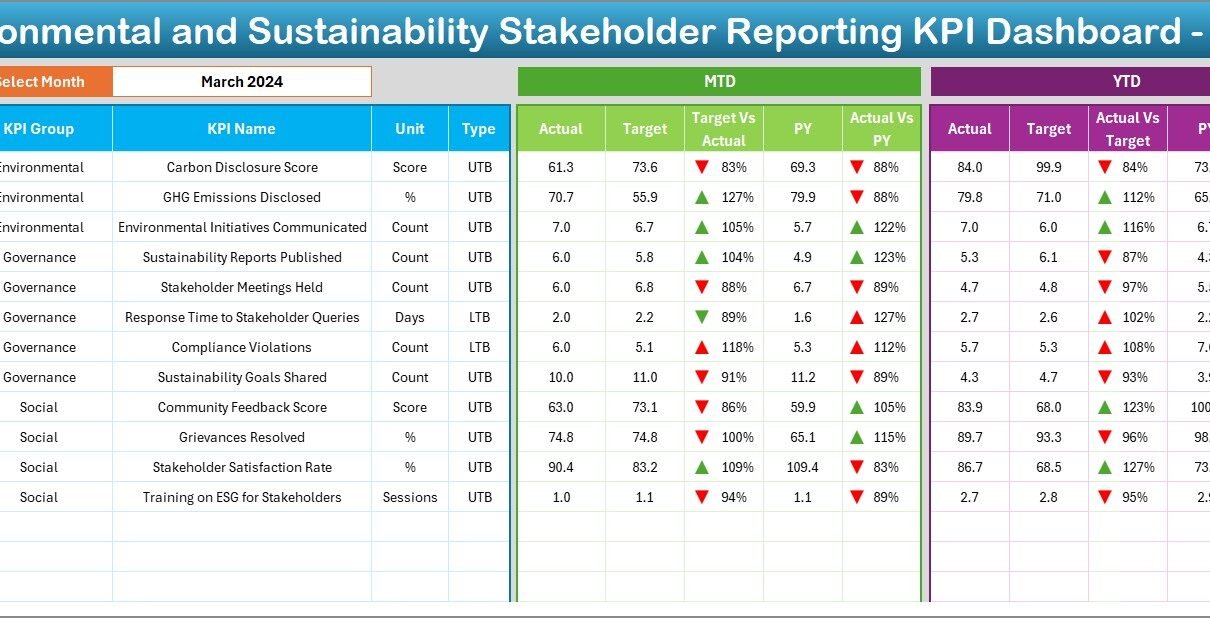
Dashboard Sheet – Central KPI Summary

-
This is the heart of the dashboard.
-
Select any month from a drop-down in cell D3 to dynamically update the dashboard.
Displays:
- MTD (Month-to-Date) and YTD (Year-to-Date) values.
- Actual vs Target comparison with conditional arrows.
- Actual vs Previous Year comparison.
-
Visually intuitive, using conditional formatting for performance signals.
KPI Trend Sheet – In-Depth Performance Insights

-
Allows KPI selection via a drop-down in C3.
Shows:
- KPI Group, Unit, Type (LTB/UTB), Formula, and Definition.
- Trend charts for both MTD and YTD for Actual, Target, and Previous Year values.
Actual Numbers Input Sheet – Data Entry Made Easy

-
Input monthly Actual MTD and YTD data.
-
Choose the first month of the fiscal year in E1 to set timelines.
Target Sheet – Set Your Monthly Goals

-
Enter monthly Target MTD and YTD values for each KPI.
-
Ensures alignment with sustainability goals.
Previous Year Number Sheet – Historical Comparisons

-
Input last year’s MTD and YTD values to compare progress.
-
Crucial for trend analysis and continuous improvement.
KPI Definition Sheet – Glossary of KPIs

-
Define each KPI’s Name, Group, Unit, Formula, and Description.
-
Promotes consistency and transparency across teams and reports.
Advantages of Environmental and Sustainability Stakeholder Reporting KPI Dashboard in Excel
Using this dashboard offers numerous benefits:
📌 Enhanced Stakeholder Communication
-
Simplifies the reporting process for sustainability performance.
-
Makes it easier to communicate with investors, partners, and customers.
📌 Centralized Performance Monitoring
-
Consolidates all KPIs into a single view.
-
Tracks both current and historical data.
📌 Visual Data Interpretation
-
Conditional formatting, arrows, and trend charts enhance visual appeal.
-
Quick identification of positive or negative performance.
📌 Excel-Based Flexibility
-
No need for third-party software.
-
Easily customizable to suit industry-specific KPIs or branding.
📌 Supports Proactive Decision-Making
-
Real-time visibility empowers faster corrective actions.
-
Encourages data-driven environmental strategies.
Best Practices for Using the KPI Dashboard
To maximize the impact of your stakeholder reporting dashboard, follow these best practices:
✔ Define SMART KPIs
-
Ensure KPIs are Specific, Measurable, Achievable, Relevant, and Time-bound.
-
Align them with global sustainability standards (e.g., GRI, ESG frameworks).
✔ Keep It Updated Regularly
-
Input actuals monthly without delay.
-
Maintain consistency in unit measures and definitions.
✔ Use Visual Elements Wisely
-
Let the conditional formatting do the talking.
-
Avoid overcrowding with too many KPIs on one page.
✔ Train Stakeholders
-
Provide brief training or guides on how to use and interpret the dashboard.
-
This ensures consistent understanding across departments.
✔ Backup and Version Control
-
Always maintain a backup of each monthly update.
-
Keep versioned copies to track changes over time.
Use Cases Across Industries
This dashboard is not limited to any specific sector. It is versatile and suitable for:
-
Manufacturing: Monitoring emissions, energy, and waste disposal.
-
Education: Tracking resource utilization and green campus initiatives.
-
Retail: Measuring packaging efficiency and sustainable sourcing.
-
IT and Tech: Tracking energy usage in data centers and cloud infrastructure.
-
Healthcare: Monitoring waste segregation and water consumption.
Why Transition to Excel-Based Sustainability Reporting?
Many organizations still rely on fragmented reports or costly software. Transitioning to this Excel-based system brings:
-
Lower implementation cost.
-
No need for new software licenses.
-
Ease of access across departments.
-
Offline availability for secure environments.
With Excel’s versatility, you can build powerful dashboards without coding or complex integrations.
How to Get Started?
Here’s a step-by-step approach to begin using this dashboard effectively:
1. Gather Your KPI List
List all key environmental and sustainability KPIs relevant to your organization. Use the KPI Definition Sheet to define each one clearly.
2. Enter Historical and Target Data
Populate the Previous Year Numbers Sheet and the Target Sheet. This gives context to your actuals.
3. Start Monthly Data Input
Use the Actual Numbers Input Sheet to input the MTD and YTD figures every month.
4. Monitor Dashboard
On the Dashboard Sheet, select the relevant month and instantly view the performance summary.
5. Drill Down When Needed
Use the KPI Trend Sheet to analyze individual KPI performance across time.
Tips to Customize Your Dashboard Further
-
Add a filter for department or business unit if you track data at that level.
-
Include additional sheets for CO2 emissions per product, energy usage per location, or cost per saved resource.
-
Convert to Google Sheets if you want cloud access and team collaboration.
-
Use VBA or macros to automate repetitive input or formatting tasks.
Aligning with ESG and Global Frameworks
The KPIs used in this dashboard can be aligned with several global standards:
-
ESG (Environmental, Social, Governance) reporting requirements
-
GRI (Global Reporting Initiative)
-
UN Sustainable Development Goals (SDGs)
-
ISO 14001 Environmental Management Systems
By customizing the KPI Definitions to match these frameworks, your reports become more relevant to global stakeholders.
Future-Proofing Your Sustainability Reporting
Click to Purchases Environmental and Sustainability Stakeholder Reporting KPI Dashboard in Excel
As regulatory and investor demands increase, organizations will need to evolve their reporting tools. This dashboard provides the flexibility and scalability to:
-
Add new KPIs as sustainability goals expand.
-
Support internal audits and external compliance.
-
Serve as a prototype for future BI tool migration (Power BI, Tableau, etc.).
Conclusion
The Environmental and Sustainability Stakeholder Reporting KPI Dashboard in Excel is a practical, low-cost, and effective solution to communicate your sustainability efforts. It empowers organizations to track key metrics, visualize performance, and make data-driven environmental decisions—all within the familiar environment of Excel.
Whether you’re a sustainability officer, compliance manager, or data analyst, this dashboard gives you the tools to confidently manage and report your environmental performance to all stakeholders.
Frequently Asked Questions (FAQs)
1. What is the purpose of a stakeholder reporting KPI dashboard?
It provides transparency and visibility into environmental and sustainability metrics, allowing stakeholders to assess progress and make informed decisions.
2. Can I customize this dashboard for my industry-specific KPIs?
Yes, the Excel template is fully customizable. You can edit KPI names, units, formulas, and data entries.
3. Does it support year-over-year comparisons?
Absolutely. The dashboard includes fields to input Previous Year numbers, making comparisons easy and visual.
4. Do I need advanced Excel skills to use this?
Not at all. Basic Excel knowledge is enough. All dropdowns, charts, and conditional formatting are already built-in.
5. Can I use this dashboard for ESG reporting?
Yes, the KPIs and structure can align with ESG, GRI, and other global reporting standards.
6. Is it possible to automate data input in this dashboard?
Yes. You can use Excel Power Query or VBA macros to automate monthly data imports if your data comes from external sources.
Visit our YouTube channel to learn step-by-step video tutorials